4946
Single and Multi-channel evaluations of factors that affect cartilage T1ρ and T2 quantification
zhiyuan zhang1,2,3, Jeehun Kim2,3,4, Richard Lartey2,3, Carl S. Winalski2,3,5, and Xiaojuan Li2,3,5
1Biomedical Engineering, Case Western Reserve University, Cleveland, OH, United States, 2Program of Advanced Musculoskeletal Imaging (PAMI), Cleveland Clinic, Cleveland, OH, United States, 3Department of Biomedical Engineering, Lerner Research Institute, Cleveland Clinic, Cleveland, OH, United States, 4Department of Electrical, Computer, and Systems Engineering, Case Western Reserve University, Cleveland, OH, United States, 5Department of Diagnostic Radiology, Imaging Institute, Cleveland Clinic, Cleveland, OH, United States
1Biomedical Engineering, Case Western Reserve University, Cleveland, OH, United States, 2Program of Advanced Musculoskeletal Imaging (PAMI), Cleveland Clinic, Cleveland, OH, United States, 3Department of Biomedical Engineering, Lerner Research Institute, Cleveland Clinic, Cleveland, OH, United States, 4Department of Electrical, Computer, and Systems Engineering, Case Western Reserve University, Cleveland, OH, United States, 5Department of Diagnostic Radiology, Imaging Institute, Cleveland Clinic, Cleveland, OH, United States
Synopsis
MR T1ρ and T2 have been suggested as promising imaging markers for detecting early cartilage degeneration in osteoarthritis1. However, one hurdle of applying such quantitative MRI to large clinical trials and clinical practice is the lack of standardization of data acquisition and processing. In this study, we evaluated multiple factors that affect cartilage T1ρ and T2 quantification including maximum TE, number of echoes, SNR, and fitting methods for single and multi-channel situations with simulations, phantoms and human data. Such evaluations will help to provide useful guidance in standardizing data acquisition and processing for cartilage T1ρ and T2 imaging.
Introduction
MR T1ρ and T2 have been suggested as promising imaging markers for detecting early cartilage degeneration in osteoarthritis1. Recent efforts from the MSK committee of RSNA QIBA made recommendations on standardized data acquisitions for cartilage T1ρ and T2 imaging2. However, no recommendations are available yet for standardized data analysis. Monoexpnential decay fitting on square-root-sum-of-squares (rSoS)-combined data is commonly used for T1ρ and T2 analysis in cartilage. Previous studies suggested that the T1ρ and T2 fitting results can be affected by many factors such as the signal-to-noise ratio (SNR) and fitting methods3,4,5. However, limited studies have specifically investigated multi-channel situations5. Furthermore, previous evaluations were primarily focused on estimate bias, while the estimate repeatability is also important to investigate. Therefore, the purpose of this study was to systematically evaluate effects of multiple factors, including maximum TE, number of echoes, SNR, fitting methods on monoexponential fitting regarding estimate bias and repeatability for both single- and multi-channel situations with simulations, phantoms and human knee data. Such evaluations will help to provide useful guidance in standardizing data acquisition and processing for cartilage T1ρ and T2 imaging.Methods
Simulations: For single- and multi-channel, the signal was simulated with gaussian distribution (Figure 1) for n receivers using a monoexponential decay function with additive noise from a gaussian distribution independent for each channel using following parameters: T1ρ/T2 was fixed at 30ms with different SNR levels at TE=0 (SNR0) from 20 to 90 and different number of echoes from 2 to 10 with maximum TE (maxTE) from 10 to 100ms,1000 Monte Carlo simulations. Measured signal intensity was calculated as rSoS from each channel.The following three non-linear fitting methods were evaluated in this study:
Fitting Method 1-NLS: Nonlinear least square (NLS) fitting.
Fitting Method 2-MLE: Maximum likelihood estimation5 was used by creating log likelihood function substitute for maximum likelihood for a Rician distribution of single channel Eqs.(1) and a non-central 2 distribution of multi channel6. Eqs.(2):
$$p(M;S,σ)=\frac{M}{σ^2}⋅exp(\frac{-(M^2+S^2)}{σ^2 })⋅I_0 (\frac{M⋅S}{σ^2} )(1)$$
$$p(M_n;S_n,σ,n)=\frac{S_n}{σ^2} ⋅(\frac{M_n}{S_n })^n⋅exp(\frac{-(M_n^2+S_n^2)}{σ^2} )⋅I_{n-1}(\frac{M_n⋅S_n}{σ^2}) (2)$$
Where M and Mn is the signal intensity for single and n channels scenario calculated from noise free signal S and Sn with noise standard deviation (SD).
Fitting Method 3-NCNLS: Noise-corrected nonlinear least square fitting4. was used by employing the equation Eqs. (3) and Eqs. (4) of mean of measured signal magnitude:
$$\overline{M}=\sqrt{\frac{π⋅σ^2}{2})}⋅exp(\frac{-S^2}{4σ^2})⋅((1+\frac{-S^2}{2σ^2})⋅I_0 (\frac{-S^2}{4σ^2})+(\frac{-S^2}{2σ^2})⋅I_1 (\frac{-S^2}{4σ^2})) (3)$$
$$\overline{M_n}=\frac{(1⋅3⋅5⋅⋅⋅(2n-1))}{(2^{(n-1)}⋅(n-1)!)}⋅\sqrt{(\frac{π⋅σ^2}{2})}\cdot {_1}F{_1}(\frac{-1}{2},n,\frac{-S_n^2}{2σ^2})(4)$$
Where $$${_1}F{_1}$$$ is the confluent hypergeometric function.
Agarose gel phantoms and four volunteers were scanned from a 3T Siemens Prisma MRI scanner with a knee coil (1Tx/15Rx, QED, Mayfield, OH). The T1ρ/T2 data was acquired with 3D MAPSS sequence7,8, with time of spinlocks (TSLs) of 0/10/20/30/40/50/60/70ms and spin-lock frequency of 500Hz and TE of 1.86/11.58/23.17/34.75/46.34/57.92/69.50/81.09ms. Different number of echoes were fitted, choosing all, 1/3/5/8th, 1/5/8th, and 1/8th echo for 8/4/3/2 echo fitting. For phantoms, scan/rescan coefficients of variation (CVs) of T1ρ/T2 values were calculated within the center region: CV=SD/mean. For human data, six major compartments of cartilage were segmented automatically (medial/lateral femoral condyle, medial/lateral tibia, patellar, trochlear) and the mean voxel-wise CVs of cartilage T1ρ/T2 values were calculated between scan/rescans.
Result and Discussion
Consistent with theoretical expectation, Figure 2a shows fitted T1ρ/T2 had the minimum bias when maxTE was 2 times the T1ρ/T2 of interest. Using max TE=60ms and single-channel simulation, Table 1 shows estimated T1ρ/T2s using different fitting methods with SNR0 ranging from 20 to 90, and number of echoes ranging from 4 to 10. No significant bias was observed with all methods and parameters. However, we noticed that the CVs increased with decreased number of echoes, which will translate into inferior repeatability, Figure 2b (using NLS fitting as an example).Based on the single-channel simulation results, maxTE of 60ms and echo number of 8 were applied for multi-channel simulations. Figure 3 shows the estimated mean value and CVs of different methods. Both methods perform well at high SNR0. At low SNR0, NLS methods overestimated T1ρ/T2, while no bias was observed with NCNLS methods when correct noise SD was used for the fitting. However, both methods showed higher CVs (inferior repeatability) at low SNR0.
For phantom and human data, using NLS fitting, decreased number of echoes resulted in overestimates of T1ρ and T2 values, and increased CVs (inferior repeatability), Figure 4, which is consistent with our simulation results. The SNR0 for human and phantom data was 33.82±4.74 and 149±19.2, respectively.
Conclusion
In this study, we evaluated the effect of multiple factors on monoexponential decay fitting for cartilage T1ρ and T2 analysis for both single and multi-channel scenarios. Such evaluation may provide guidance on cartilage T1ρ and T2 data acquisition and analysis. For example, to achieve repeatability of CV < 5%, with SNR0 of first echo at 40, a minimum of 4 echoes are needed (Figure 2b). Phantom and human data were consistent with simulation results. In the simulation, the NCNLS method provided superior results compared to the NLS method. However, it is well known that accurate estimation of noise is challenging with multi-channel acquisitions and parallel imaging or other advanced acceleration methods6. Thus, for future work, a practical application strategy for NCNLS method as well as fitting methods with maximum likelihood for multi-channel acquisitions will be investigated.Acknowledgements
The study was supported by NIH/NIAMS R01 AR077452.References
- MacKay JW, Low SBL, Smith TO, Toms AP, McCaskie AW, Gilbert FJ. Systematic review and meta-analysis of the reliability and discriminative validity of cartilage compositional MRI in knee osteoarthritis. Osteoarthritis Cartilage. 2018;26(9):1140-52.
- Chalian M, Li X, Guermazi A, Obuchowski NA, Carrino JA, Oei EH, Link TM, Committee RQMB. The QIBA Profile for MRI-based Compositional Imaging of Knee Cartilage. Radiology. 2021:204587.
- Koff MF, Amrami KK, Felmlee JP, Kaufman KR. Bias of cartilage T2 values related to method of calculation. Magn Reson Imaging. 2008;26(9):1236-43.
- Raya JG, Dietrich O, Horng A, Weber J, Reiser MF, Glaser C. T2 measurement in articular cartilage: impact of the fitting method on accuracy and precision at low SNR. Magn Reson Med. 2010 Jan;63(1):181-93. doi: 10.1002/mrm.22178. PMID: 19859960.
- Hardy PA, Andersen AH. Calculating T2 in images from a phased array receiver. Magn Reson Med. 2009 Apr;61(4):962-9. doi: 10.1002/mrm.21904. PMID: 19215046; PMCID: PMC2710582.
- Dietrich O, Raya JG, Reeder SB, Ingrisch M, Reiser MF, Schoenberg SO. Influence of multichannel combination, parallel imaging and other reconstruction techniques on MRI noise characteristics. Magn Reson Imaging. 2008 Jul;26(6):754-62. doi: 10.1016/j.mri.2008.02.001. Epub 2008 Apr 28. PMID: 18440746.
- Li X, Han ET, Busse RF, Majumdar S. In vivo T(1rho) mapping in cartilage using 3D magnetization-prepared angle-modulated partitioned k-space spoiled gradient echo snapshots (3D MAPSS). Magnetic resonance in medicine. 2008;59(2):298-307
- Kim J, Mamoto K, Lartey R, Xu K, Nakamura K, Shin W, Winalski CS, Obuchowski N, Tanaka M, Bahroos E, Link TM, Hardy PA, Peng Q, Reddy R, Botto-van Bemden A, Liu K, Peters RD, Wu C, Li X. Multi-vendor multi-site T1rho and T2 quantification of knee cartilage. Osteoarthritis Cartilage. 2020;28(12):1539-50.
Figures
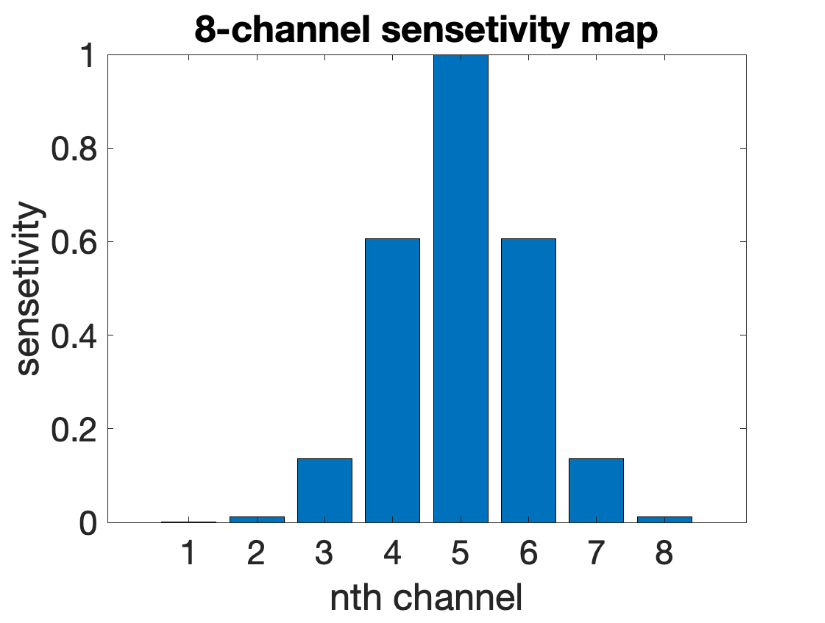
Figure 1. An example of a coil sensitivity map for 8-channel coils. The gaussian distribution is applied.
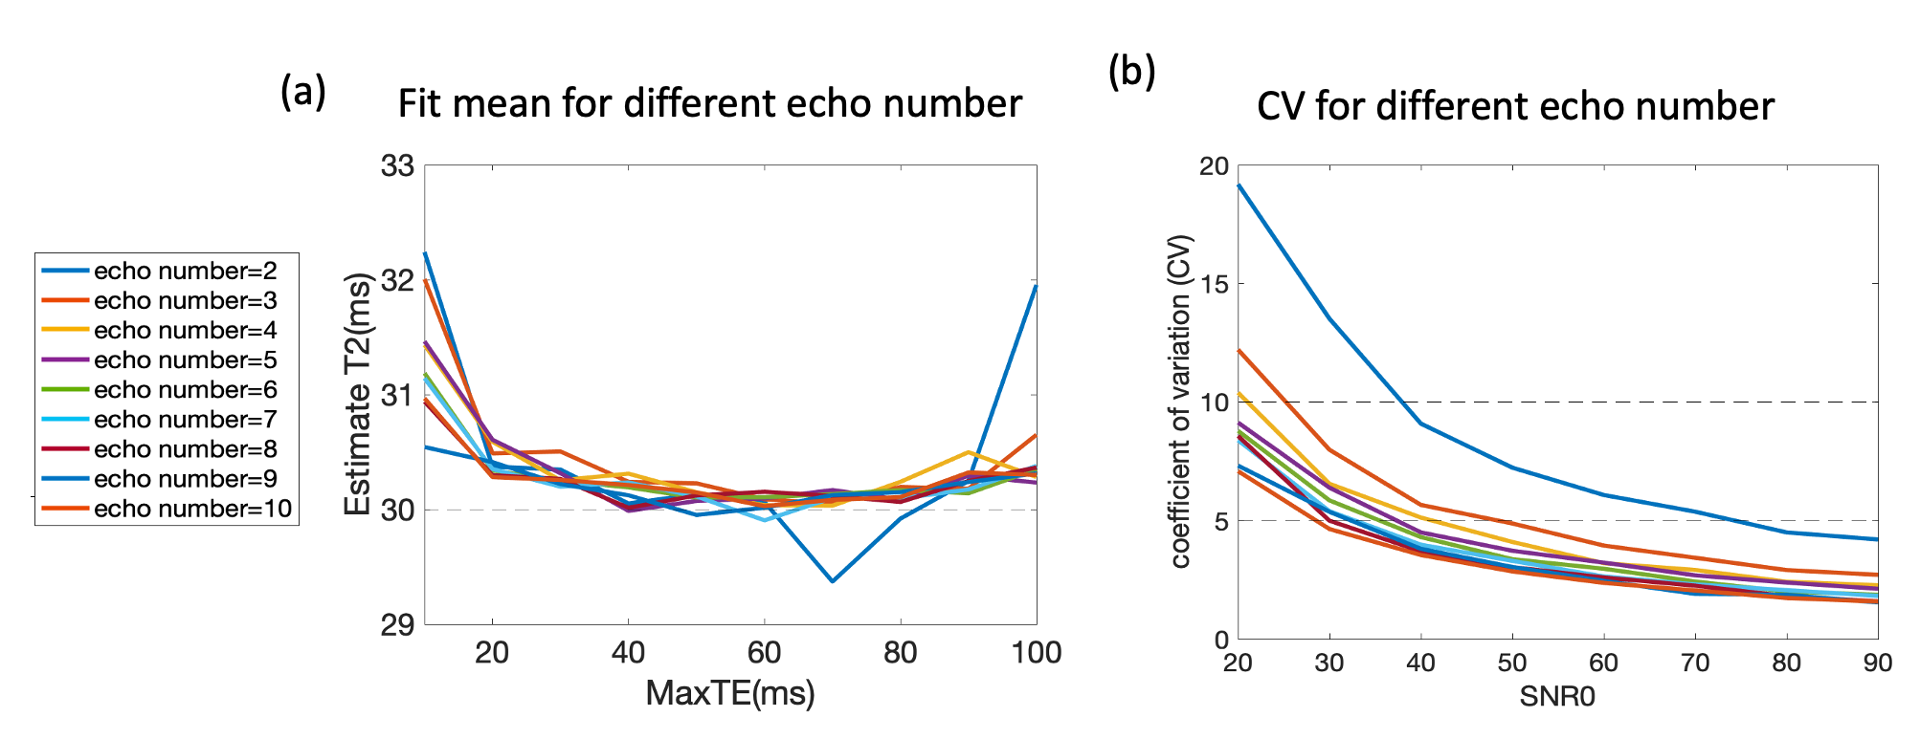
Figure 2. a) The mean of estimated T1ρ/T2 with single channel simulations at TE from 10 to 100. Different colors encode the echo number from 2 to 10, SNR0=20 is used. b) The coefficients of variation (CV) of fitted T1ρ/T2 values at SNR0 level from 20 to 90. Different colors encode different echo numbers from 2 to 10. CVs increase (inferior repeatability) with decreased SNR0 and decreased number of echoes. CV = SD/mean of fitted T1ρ/T2 values.
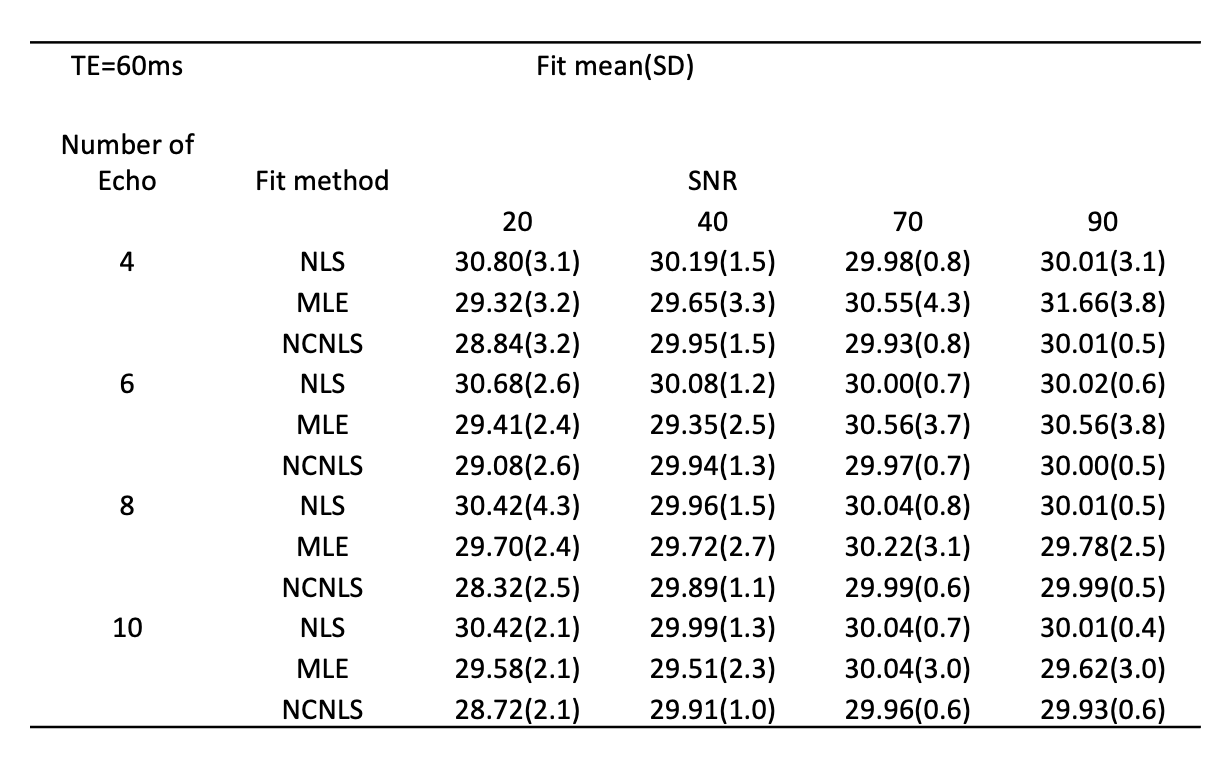
Table 1. Fitting results using three different methods with single channel simulations. The mean and standard deviation of fitted values at different SNR0 (20,40,70) and different echo numbers (4,6,8,10) are shown. NLS: nonlinear least square; MLE: maximum likelihood estimate; NCNLS: noise-corrected NLS.
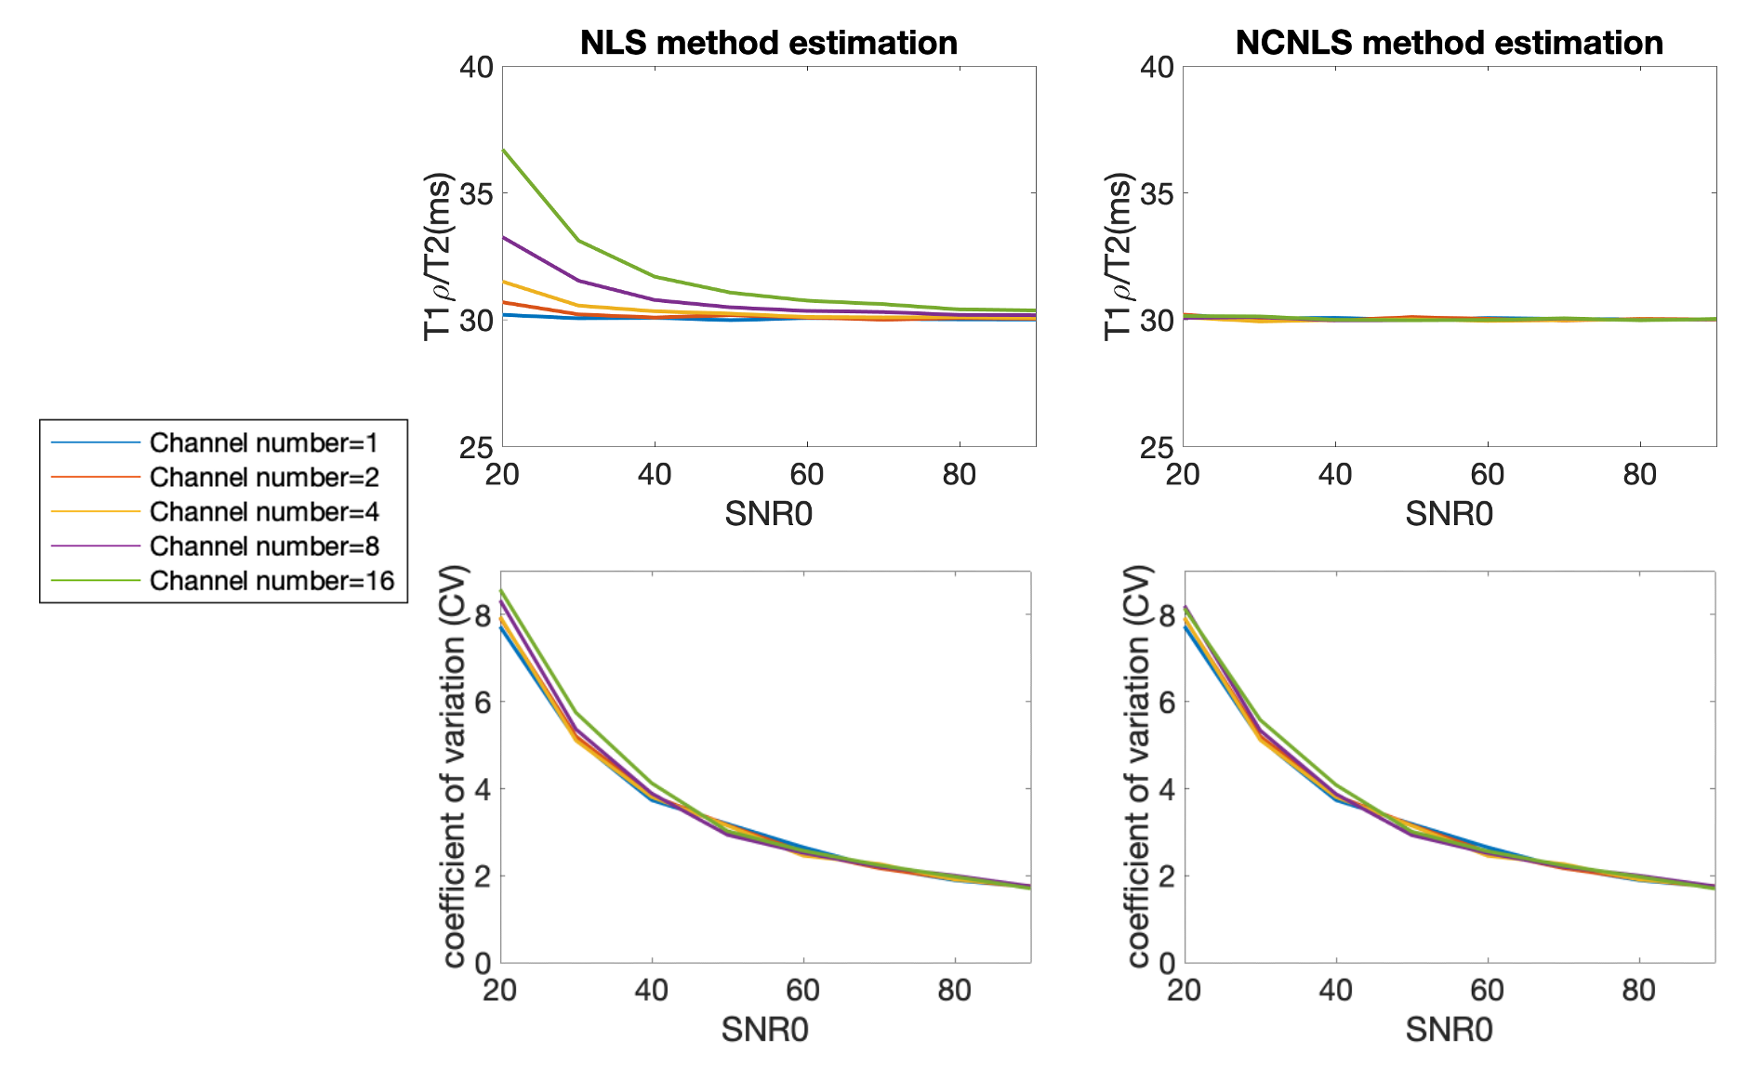
Figure 3. The mean and CV of fitted T1ρ/T2 values using three different fitting methods with multi-channel simulations at SNR0 from 20 to 90. Different colors encode different channel numbers of 1/2/4/8/16 respectively. NLS methods overestimate T1ρ/T2 at low SNR0. Both methods have increased CVs (inferior repeatability) with decreased SNR0. NLS: nonlinear least square fitting; NCNLS: noise-corrected NLS.

Figure 4. Mean values and scan/rescan CVs of T1ρ and T2 in phantom and human knee cartilage with different echo number of 2/3/4/8. Higher T1ρ and T2 values and higher CVs (inferior repeatability) are observed with decreased number of echoes.
DOI: https://doi.org/10.58530/2022/4946