4945
Correlation between T1, T1rho, T2*, MMF, and Biomechanics in Human Interspinous Ligament Using quantitative Ultrashort Echo Time (UTE) MRI1Department of Radiology, University of California, San Diego, CA, United States, 2Radiology Service, Veterans Affairs, San Diego Healthcare System, San Diego, CA, United States, 3Department of Orthopedic Surgery, Scripps Clinic, San Diego, CA, United States, 4Department of Orthopedic Surgery, University of California, San Diego, CA, United States
Synopsis
This study aimed to quantify T1, T1rho, T2*, and MMF values of the human interspinous ligament using 3D ultrashort echo time (UTE) cones MRI and correlate them with biomechanical properties. We found a significant negative correlation between T1 and elastic modulus; significant moderate to strong negative correlations between T1rho and both tensile stress and maximum load; and significant moderate to strong positive correlations between MMF and both tensile stress and maximum load. There was an overall trend towards negative correlation between T2* and biomechanical properties.
Summary of Main Findings
Our results suggest that 3D UTE MRI may be used as a non-invasive method of quantification of biomechanical properties of human interspinous ligaments.Introduction
Interspinous ligaments of the spine are important to maintain spinal stability. Their rupture or degeneration may result in spinal instability and contribute to spinal degeneration and disc postoperative failure. Attempts have been made to grade degeneration of interspinous ligaments mostly using morphologic MRI features1,2, but quantitative MRI’s capability to non-invasively estimate tissue components such as collagen, proteoglycan, and water content suggests that it may have the potential to represent biomechanical properties. Here we use a 3D UTE MRI cones sequence to investigate T1, T1rho, MMF, and T2* of interspinous ligaments and compare their values with tissue tensile stress, elastic modulus, and maximum load.Methods
Bone-ligament-bone biopsies of the posterior ligamentous complex (interspinous and supraspinous ligaments together) were obtained from consented individuals undergoing posterior spinal fusion for degenerative spinal conditions.The characteristics of UTE MRI sequences are shown in Figure 1. Fifteen ex vivo thoracolumbar interspinous ligament specimens were scanned on a 3T GE MR750 scanner. The detailed sequence parameters were: A) 3D multi-echo UTE sequence with an echo train of six TEs=0.032, 4.1, 26.79, 30.5, 34.2, and 37.9ms; repetition time (TR)=100ms; and flip angle (FA)=10˚; B) 3D UTE-AdiabT1rho sequence3: spin lock times (TSLs)=0, 12, 24, 36, 48, 72, and 96ms corresponding to the number of adiabatic full passage pulses=0, 2, 4, 6, 8, 12, and 16; TR=500ms; FA=10°; number of spokes (Nsp) in a TR=21; and interspoke interval τ=8ms; C) 3D UTE-MT sequence4: MT pulse FAs=500°, 1000°, and 1500°; MT pulse frequency offsets=2, 5, 10, 20, and 50kHz; TR=100ms; FA=7˚; Nsp=9; and τ=6ms; D) 3D UTE-AFI sequence5: TR1/TR2=20/100ms and FA=45˚; and E) 3D UTE-VFA sequence: FAs=5, 10, 20, and 30˚ and TR=20ms. The field of view, matrix size, and scan time were 14×14×9cm3, 256×256×40, and 240min, respectively. All specimens were also scanned on a Siemens computed tomography (CT) scanner with 100 µm isotropic resolution for morphologic analysis and comparison against MRI images.
Regions of interest (ROIs) were drawn by an experienced musculoskeletal radiologist in the interspinous ligaments on the axial plane. Imaging analysis was performed using MATLAB.
For biomechanical analysis, samples were clamped at an appropriate testing angle and tensile testing was performed (Instron model 1122; Norwood, MA). Prior to undergoing tensile loading to failure, ligaments were preconditioned to reduce the effects of hysteresis. Strain measurements were documented based on displacement values from tensile loading. Tensile stress (MPa), elastic modulus (MPa) and maximum load (N) were determined.
Descriptive statistics were calculated. Spearman correlation was performed between imaging biomarker values and biomechanical measures.
Results and Discussion
Fifteen thoracolumbar human interspinous ligaments were biomechanically tested and assessed using quantitative UTE MRI and CT. Representative images of one sample are shown in Figure 2. Interspinous ligaments were observed with high resolution and contrast on MRI images. Representative fitting curves are shown in Figure 3. We found significant moderate negative correlation between T1 and elastic modulus (rho = -0.5, p = 0.05); significant moderate to strong negative correlations between T1rho and both tensile stress and maximum load (rho = -0.67, p < .01 and rho = -0.7, p < .01, respectively); and significant moderate to strong positive correlations between MMF and both tensile stress and maximum load (rho = 0.67, p < .01 and rho = 0.76, p < .01, respectively), as shown in Figure 4. There was an overall trend towards negative correlation between T2* and biomechanical properties, although it was not statistically significant (Figure 3). A summary of quantitative MR measurements and biomechanical values is shown in Table 1.In this study we demonstrated a significant negative correlation between T1 and T1rho values and biomechanical measurements, as well as a significant positive correlation between MMF values and biomechanical measurements of human interspinous ligament based on a 3D UTE MRI cones sequence. Macromolecular fraction (MMF) has been associated with the collagen protons relative to water protons in cortical bone6 and tendon7. Our results show that MMF estimation can also be applied to human interspinous ligaments as a surrogate maker of these ligaments’ biomechanical properties.
Acknowledgements
The authors acknowledge grant support from NIH (R01AR062581, R01AR068987, R01AR075825, R01AR078877, and R21AR075851), VA Clinical Science and Rehabilitation Research and Development Services (Merit Awards I01CX001388 and I01RX002604), GE Healthcare, and Scripps Clinic Medical Group.
References
1. Keorochana G, Taghavi CE, Tzeng S-T, et al. Magnetic resonance imaging grading of interspinous ligament degeneration of the lumbar spine and its relation to aging, spinal degeneration, and segmental motion. Journal of Neurosurgery: Spine. 2010;13(4):494-499.
2. Lee H-M, Kim H-S, Kim D-J, Suk K-S, Park J-O, Kim N-H. Reliability of magnetic resonance imaging in detecting posterior ligament complex injury in thoracolumbar spinal fractures. Spine. 2000;25(16):2079-2084.
3. Ma YJ, Carl M, Searleman A, Lu X, Chang EY, Du J. 3D adiabatic T1ρ prepared ultrashort echo time cones sequence for whole knee imaging. Magnetic resonance in medicine. 2018;80(4):1429-1439.
4. Ma YJ, Chang EY, Carl M, Du J. Quantitative magnetization transfer ultrashort echo time imaging using a time‐efficient 3D multispoke Cones sequence. Magnetic resonance in medicine. 2018;79(2):692-700.
5. Ma YJ, Zhao W, Wan L, et al. Whole knee joint T1 values measured in vivo at 3T by combined 3D ultrashort echo time cones actual flip angle and variable flip angle methods. Magnetic resonance in medicine. 2019;81(3):1634-1644.
6. Jerban S, Ma Y, Wan L, et al. Collagen proton fraction from ultrashort echo time magnetization transfer (UTE-MT) MRI modelling correlates significantly with cortical bone porosity measured with micro-computed tomography (μCT). NMR Biomed. 2019;32(2):e4045.
7. Jerban S, Ma Y, Namiranian B, et al. Age-related decrease in collagen proton fraction in tibial tendons estimated by magnetization transfer modeling of ultrashort echo time magnetic resonance imaging (UTE-MRI). Sci Rep. 2019;9(1):17974.
Figures
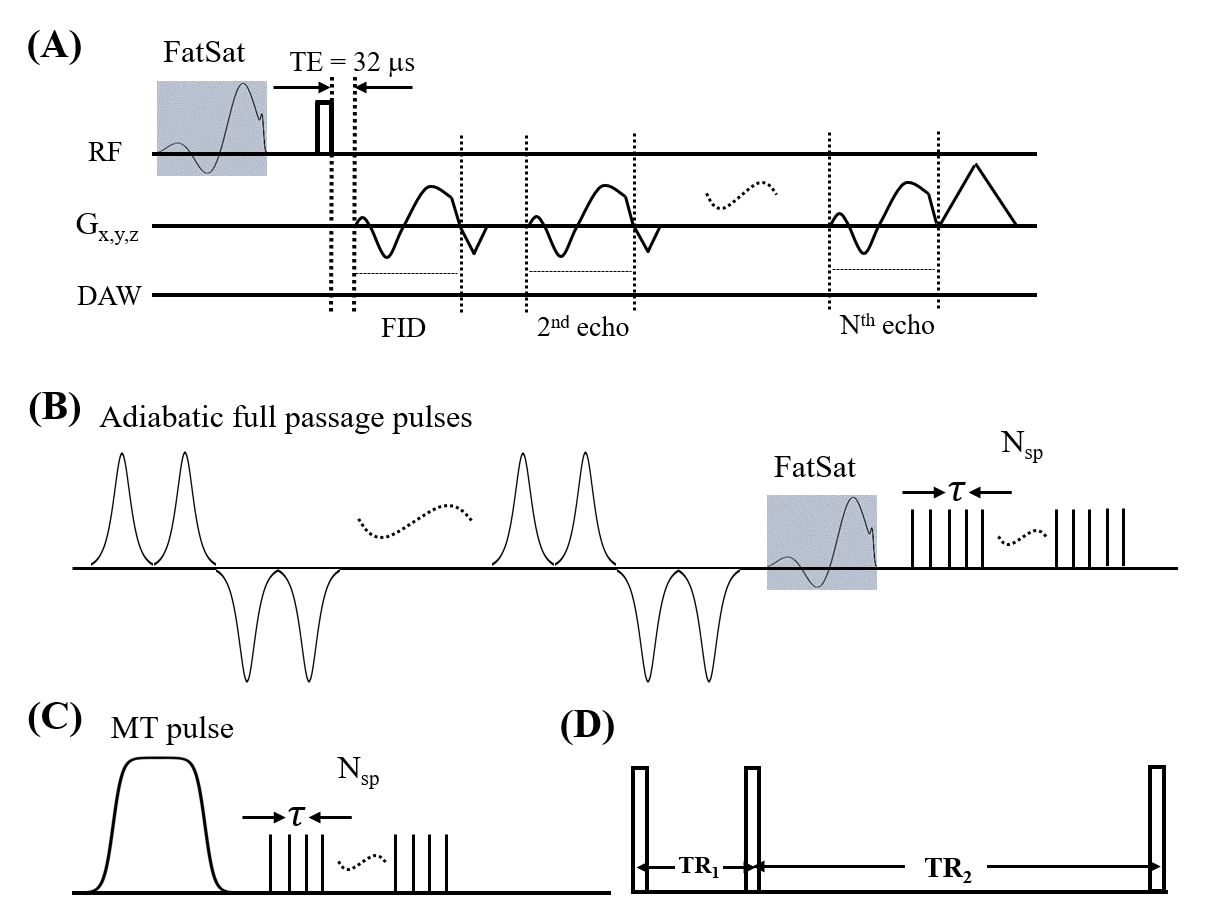
Figure 1. The diagram of the quantitative 3D UTE sequences. A multi-echo UTE sequence is used for T2* measurement (A). A train of AFP pulses (hyperbolic secant shape, duration of 6.048 ms, and bandwidth of 1.643 kHz) is used to lock the spin to generate the T1rho contrast (B). A Fermi pulse with a duration of 8 ms and a bandwidth of 160 Hz is used to saturate the magnetization of the macromolecular proton pool to generate the MT contrast (C). The AFI sequence with two interleaved TRs (D) is used to measure and correct B1 inhomogeneity for all quantifications.

Figure 2. Sagittal (A), coronal (B), and axial (C) CT images of a representative interspinous ligament sample showing ligament fiber orientation (yellow dashed lines). Corresponding sagittal (D), coronal (E), and axial (F) UTE-MR images of the same sample showing interspinous ligaments between spinous processes (yellow arrows).
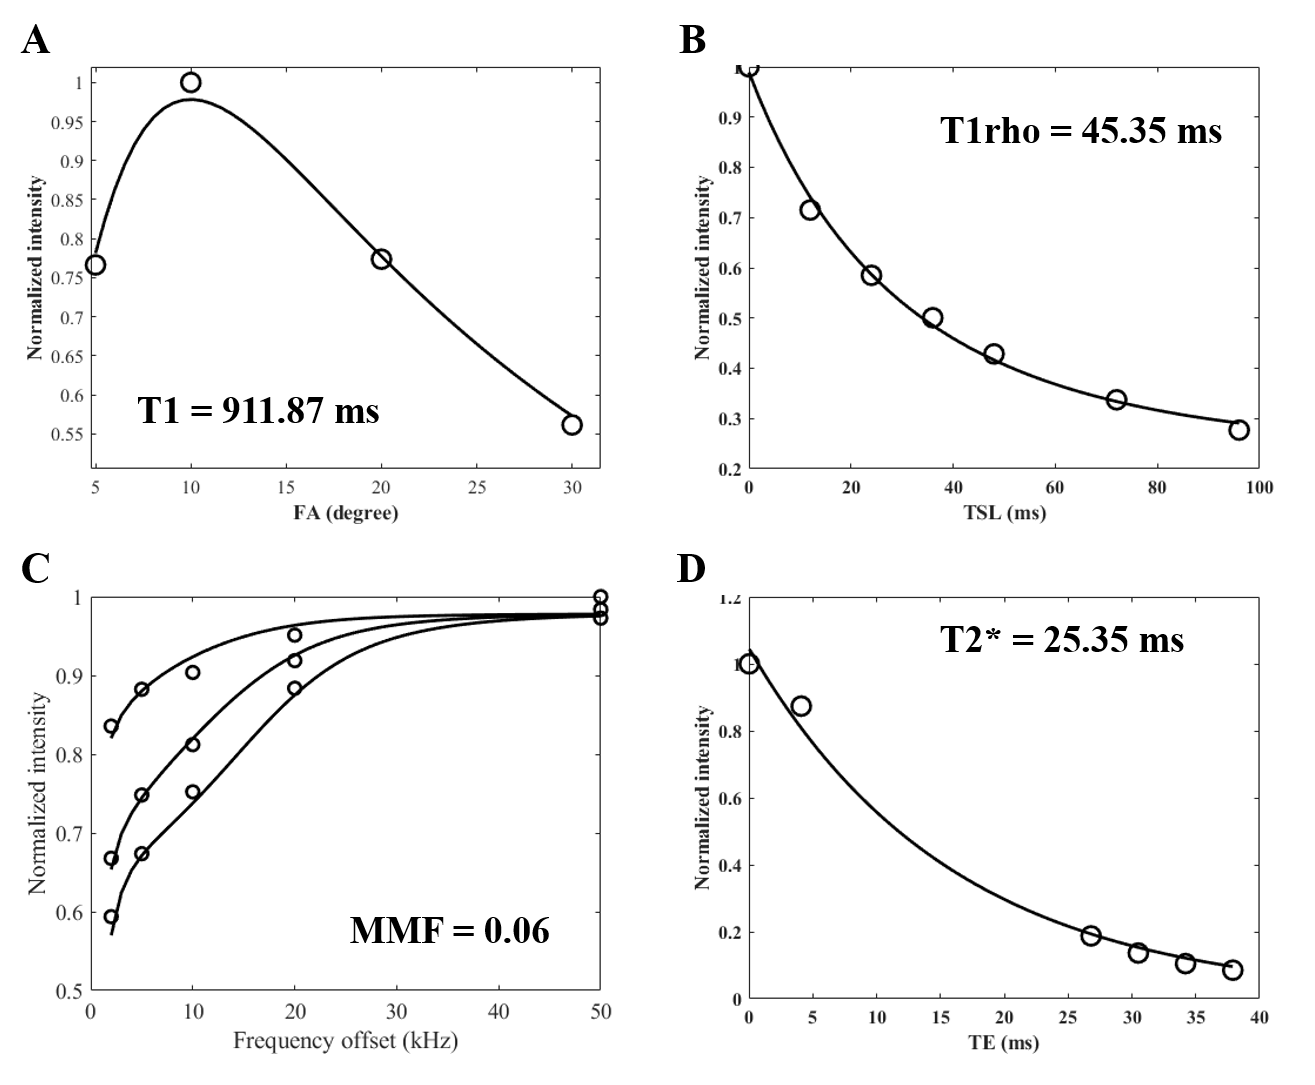
Figure 3. Representative fitting curves and corresponding T1 (A), T1rho (B), MMF (C), and T2*(D) values.
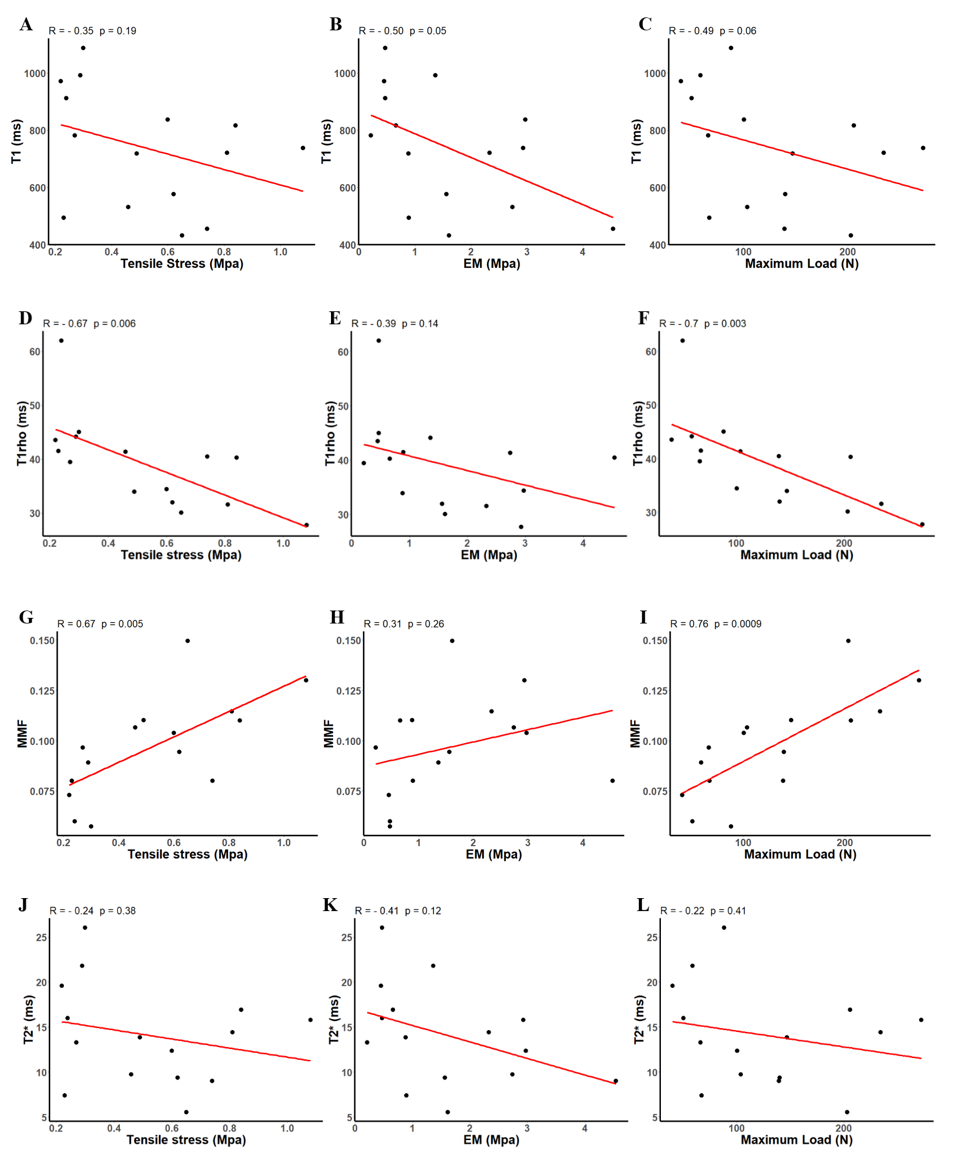
Figure 4. Scatterplots of T1 (A-C), T1rho (D-F), MMF (G-I), and T2* (J-L) versus tensile stress, elastic modulus, and maximum load, respectively, applied to the interspinous ligament samples. A significant moderate negative correlation is observed between T1 and EM; significant strong negative correlations are observed between T1rho and both tensile stress and maximum load; and significant strong positive correlations are observed between MMF and both tensile stress and maximum load. There is a trend towards negative correlation between T2* and biomechanical measurements.

Table 1. Summary of T1, T1rho, MMF, T2*, and biomechanical measurements of interspinous ligaments.