4943
2D Fiber Strains Correlated to DTI in the Medial Gastrocnemius under Isometric Contractions at Different Foot Positions1Physics, San Diego State University, San Diego, CA, United States, 2Radiology, UC San Diego, San Diego, CA, United States, 3Inteegrative Biology and Physiology, UC Los Angeles, Los Angles, CA, United States
Synopsis
Study of muscle fiber strains at different foot positions can reveal the dependence of muscle force on muscle architecture. Prior studies of isometric contraction in calf muscle using dynamic MRI revealed in the medial gastrocnemius (MG), strain heterogeneity along and across fibers, constant in-plane areas, and gear ratios decreasing with unloading. This study examines correlation of fiber strains in the MG at three-foot positions and two sub-maximal isometric contractions with fiber directions extracted from DTI. The plantarflexed foot position had the highest normalized fiber strain (to force and to torque) while the dorsiflexed position had the lowest normalized fiber strains.
Introduction
Prior studies of isometric contraction in calf muscle using velocity encoded phase contrast (VE-PC) imaging have revealed several interesting features in the medial gastrocnemius including strain heterogeneity along and across fibers, gear ratios decreasing with unloading, and constant in-plane areas during isometric contraction suggesting little or no deformation in the out-plane direction [1,2]. Earlier studies identified fiber direction from fascicle directions on water suppressed MR images (fascicles appear bright due to fat infiltration at the fascicles). However, identification of fascicles in young subjects is difficult since the fascicles are relatively thin and do not have sufficient fat infiltration. We used the average of the lead DTI eigenvector in each region to extract the direction of fibers. Fiber strains, length and angle changes were calculated for three-foot positions and at two % MVC at each position.Methods
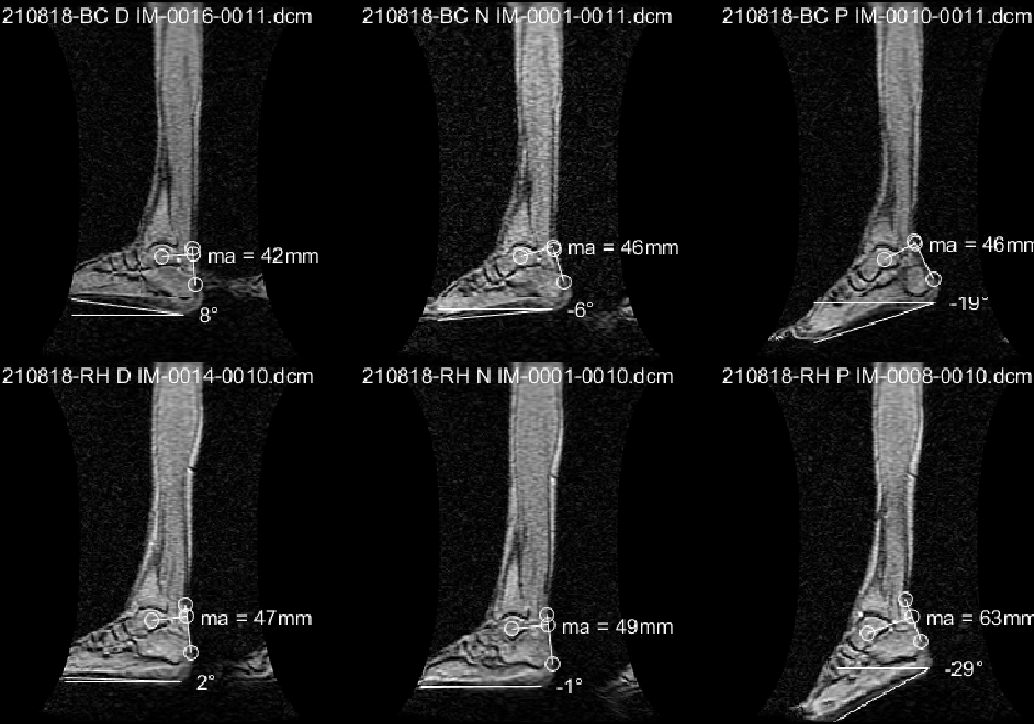
Six young subjects were recruited after IRB approval and scanned on a 1.5-T GE scanner with a specially designed 8-Ch phased array coil. The leg was constrained in a foot pedal device allowing the foot to be positioned and imaged at three different ankle angles [3]: dorsiflexed (DF), neutral (N), plantarflexed (PF), with the ankle angle identified from large FOV MR images. A strain sensor embedded in the foot-plate and a visual display of the current force curve superposed on a template, allowed subjects to exert forces ~22 and 45% MVC. MVC was measured at each foot position (MVCD=288N, MVCN=244N, MVCP=109N) and sub-maximal contractions were calculated from the respective MVCs. Dynamic images of calf muscles were acquired under isometric contractions, with the foot at three positions, using a gated VE-PC sequence, velocity encoded in all three directions, and collected in 22 phases, 1 oblique-sagittal slice, 5mm thick and 1.7x1.7 mm in-plane resolution. Prior to analysis, phase-contrast images were corrected for phase shading artifacts and denoised using a 2D anisotropic diffusion filter.DTI images were acquired using an anatomically and geometrically matched slice to the VE-PC image, using a SE-EPI DTI (TE/TR=63/2200ms) sequence with 32 diffusion gradient directions, 3 slices; DTI images were acquired for each foot position. DTI was corrected for eddy current artifacts and processed for the eigenvalues/vectors. The VE-PC magnitude image was segmented into three regions (proximal, middle, distal), eroded to be well within the aponeurosis, and the average lead eigenvector was extracted. A fiber with the average in-plane direction of the region was placed in the center of the image. It should be noted that the out-plane component of the lead DTI eigenvector was small, confirming the orientation of the oblique sagittal image as capturing the MG fibers in-plane of the slice.End points of the fiber were tracked through the dynamic cycle using the velocity data and whole fiber strain, fiber length and fiber angle (determined with reference to the y-axis) changes were calculated for the temporal cycle. Values of the fiber strain, length and angle changes at the peak of the strain (minimum) was extracted for different regions, foot positions and %MVCs.Results
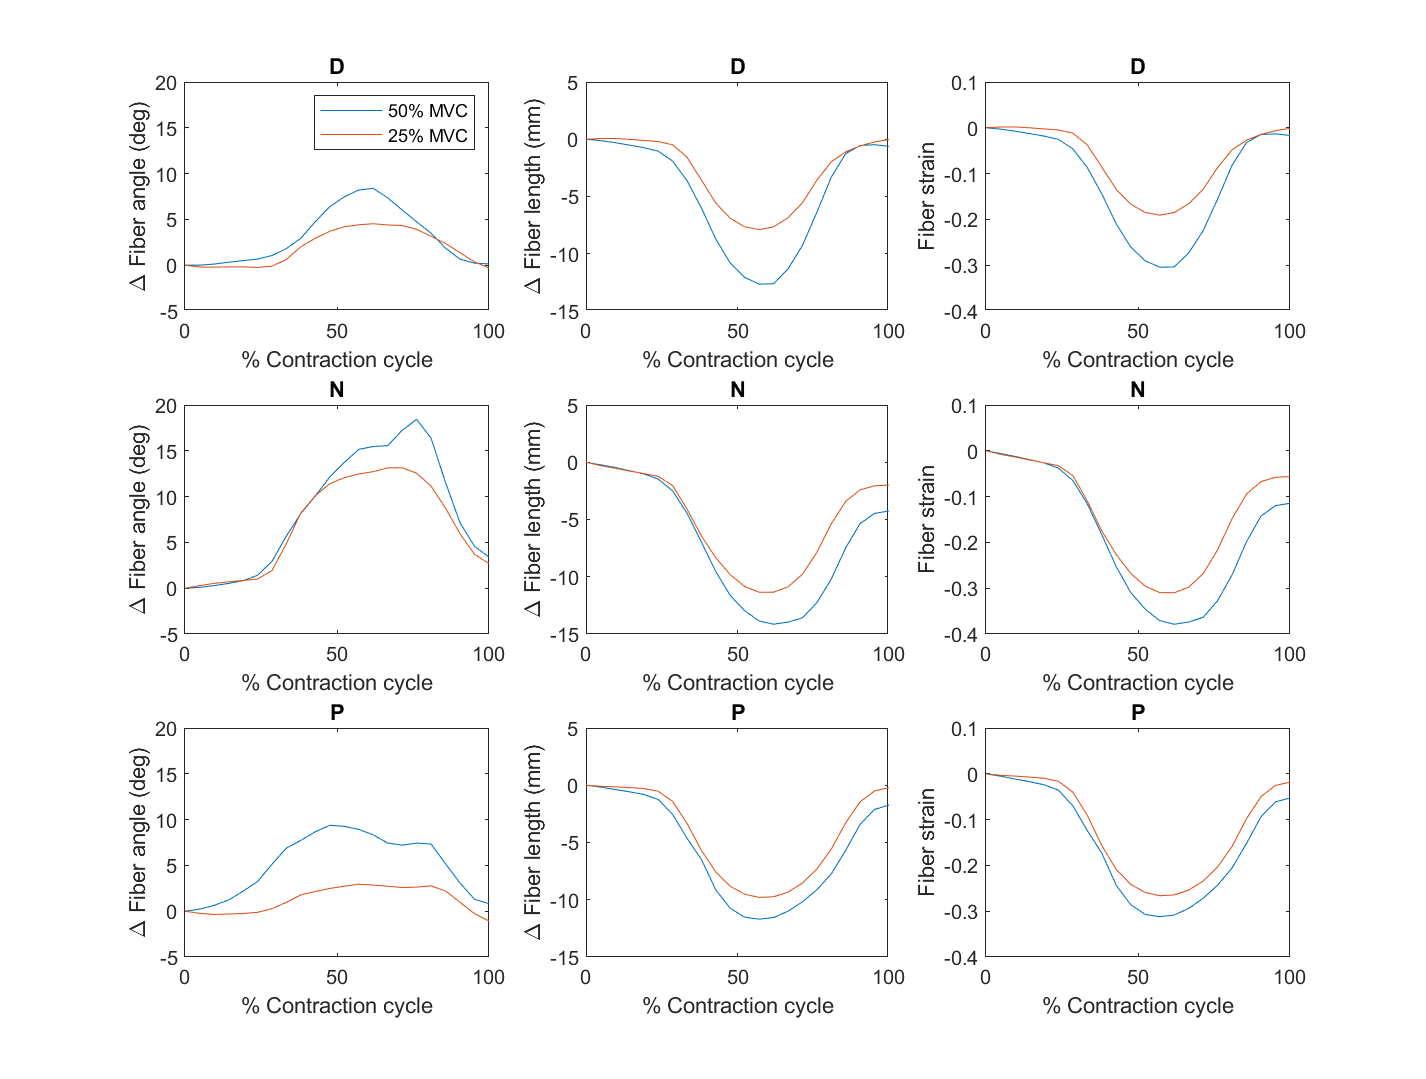
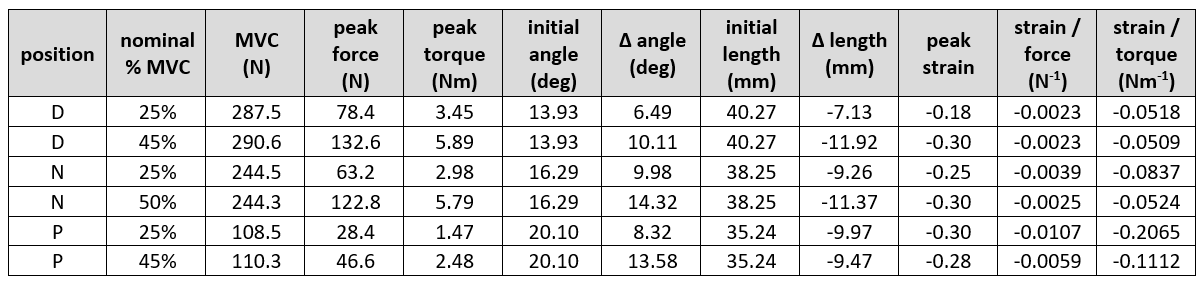
Figure 1 is the large FOV sagittal image of two subjects at the three-foot positions showing the ankle angle and measurements to determine the moment arm and torque. Figure 2 shows the fibers identified from the DTI data for the three regions, with variation of the fiber with direction shown in the cine image. Unlike manual identification of fascicles, DTI data was able to consistently identify muscle fibers for all the subjects (at different foot positions). Figure 3 summarizes the temporal plots for the fiber strain and architecture at each %MVC and the three-foot positions averaging over the three regions (since the study had few subjects). Table 1 is the average over all subjects for MVC, torque, initial and changes in fiber angle, initial and changes in fiber length, strain and normalized strains. Strains increased the most in the dorsiflexed foot position going from lower to higher %MVC and even decreased a little at higher %MVC in the plantarflexed position. Strain normalized to force or to torque were lowest for the dorsiflexed position.Discussion
Fiber architecture parameters reflected the foot position with initial fiber lengths increasing and fiber angles decreasing going from PF to DF. These initial starting lengths/pennation angles clearly influence both fiber strains as well as force generation. The small decrease in strain at higher %MVC in the plantarflexed position may arise from either (i) shorter fiber lengths at PF imply bigger fiber cross-sections. There is a possibility that when the fiber is initially radially expanded, there are constraints to further radial expansion which in turn limits contraction [4] (ii) it is possible that the soleus may have larger strains than the MG when the foot is in the PF position. Further work examining all the plantarflexors may throw further light on the fiber strains and force generation. The DF position is the most efficient for producing force (smallest normalized strains) and possibly reflects an optimal length (e.g., the peak of the muscle stress-strain curve).Conclusion
Fiber strain and architecture at different foot positions provides insight into muscle physiology and force production.Acknowledgements
This work was supported by the National Institute on Aging Grant No. R01AG056999.References
[1] Shin DD, et al. J Appl Physiol (1985) 2009;107:1276-84.
[2] Kinugasa et al. J Appl Physiol (1985) 2012;112:463-70.
[3] Sinha S, et al. J Magn Reson Imaging. 2012; 36(2): 498–504.
[4] Azizi E, et al. Biomech Model Mechan. 2017 ; 1-11.
Figures