4942
High Prevalence of Abnormal 3T MRI Findings in Clinically Asymptomatic Siblings of Patients with Osteochondritis Dissecans of the Knee1Center for Magnetic Resonance Research, University of Minnesota, Minneapolis, MN, United States, 2Department of Radiology, University of Minnesota, Minneapolis, MN, United States, 3Department of Orthopedic Surgery, University of Minnesota, Minneapolis, MN, United States, 4Stanford Children's Hospital, Stanford University, Palo Alto, CA, United States, 5Department of Veterinary Medicine, University of Minnesota, St. Paul, MN, United States
Synopsis
This study examined seven clinically asymptomatic siblings of patients with Osteochondritis Dissecans (OCD) utilizing 3T MRI, including quantitative apparent diffusion coefficient (ADC) mapping to evaluate morphological integrity of the epiphyseal cartilage, integrity of secondary physis and trabecular bone quality in the distal femoral condyles of bilateral knees. A high prevalence (86%) of morphological MRI abnormalities that can be seen in early OCD and increased diffusivity (high quantitative ADC values) in trabecular bone were detected. The high prevalence of early signs of OCD in clinically asymptomatic siblings of OCD patients supports evidence of a genetic predisposition for the disease.
INTRODUCTION
Endochondral ossification is a skeletal developmental process in children by which the embryonic cartilaginous model of bones undergoes gradual ossification over time until skeletal maturity is reached. Osteochondritis Dissecans (OCD) is a developmental disease characterized by focal areas of chondronecrosis within the epiphyseal cartilage and subsequent delay of the ossification front. OCD lesions can become loose bodies and lead to premature Osteoarthritis1. The etiology of OCD is not yet well understood, however, there is mounting evidence of a genetic predisposition2-4. In this longitudinal prospective pilot study, we examined siblings of OCD patients utilizing clinical 3T MRI and quantitative apparent diffusion coefficient (ADC) mapping to evaluate morphological integrity of the epiphyseal cartilage, secondary physis and trabecular bone in the distal femoral condyles of bilateral knees. ADC mapping derived from diffusion-weighted imaging (DWI) principally quantifies differences in the diffusivity of water molecules in tissue and proved to be a sensitive indicator of bone marrow pathologies5-7. We hypothesized that in clinically asymptomatic siblings of OCD patients, abnormalities that can be seen in early OCD are highly prevalent on clinical MRI and quantitative ADC mapping.METHODS
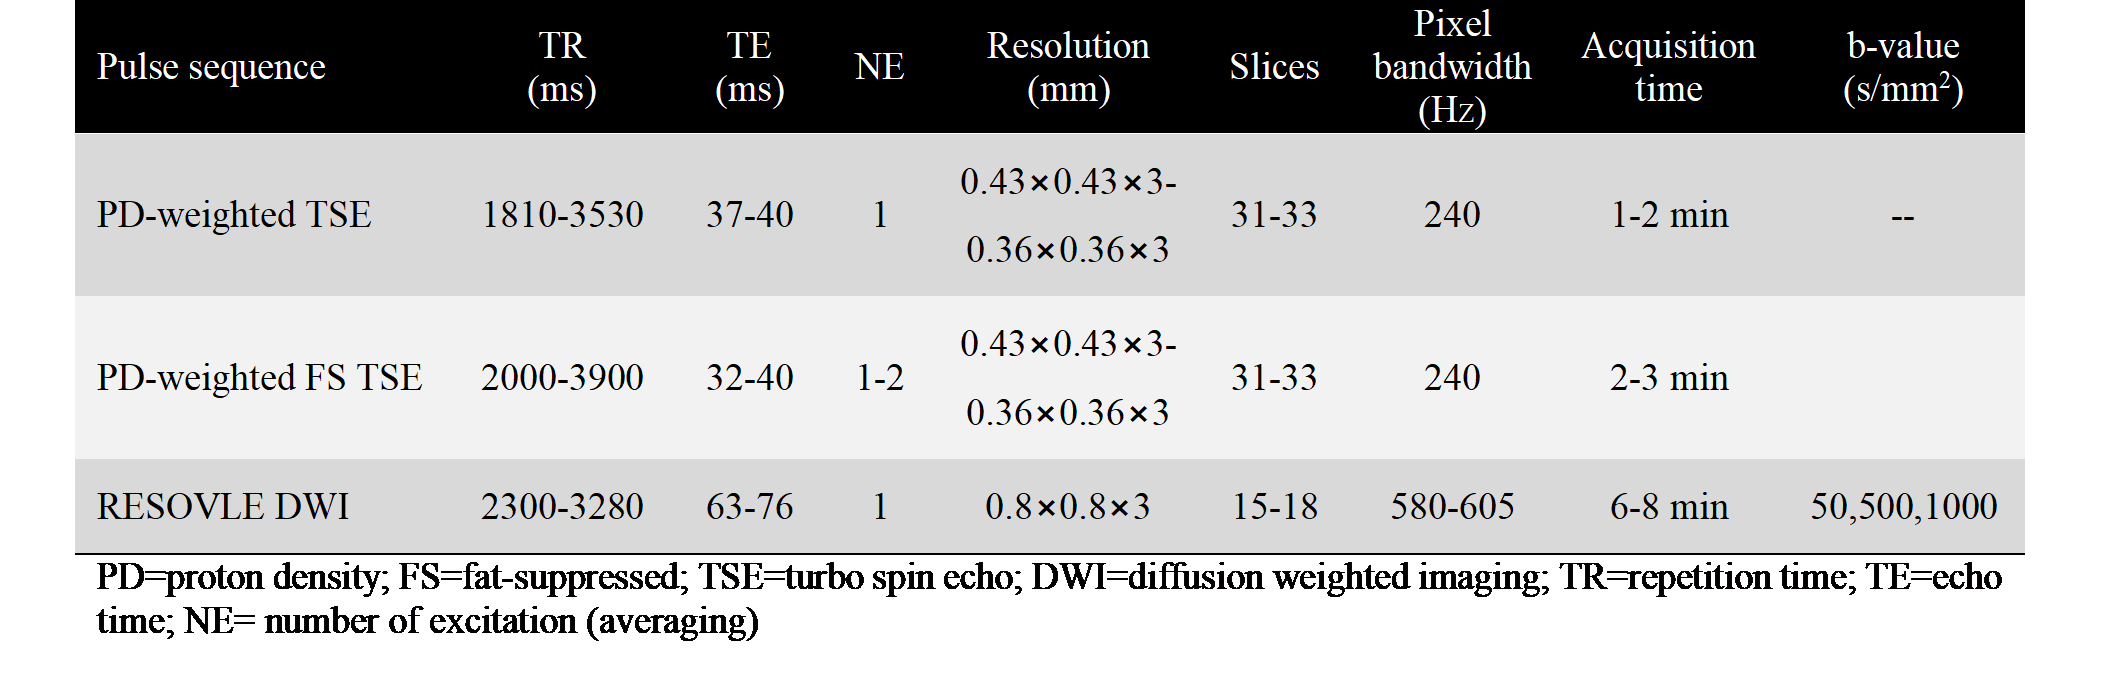
In this prospective longitudinal study, 40 MRI datasets (13 knees imaged at baseline and 2-3 follow-up visits) from seven skeletally immature participants with no clinical symptoms (6 bilateral and one unilateral sibling of OCD patients, 3 females; average age at first visit=8.7 years; range=6-10 years) were evaluated. This study was approved by the institutional review board and informed consent was obtained. All images were acquired at 3T MRI system with a 1Tx/15Rx knee coil. Sagittal PD-weighted TSE images with and without fat suppression and coronal segmented, multi-shot EPI-DWI sequence with fat suppression (Fig. 1) were acquired bilaterally at first visit and at 2-3 MRI follow-up studies ranging from 6-21 months. The morphological images were reviewed by an experienced musculoskeletal radiologist using the following MRI criteria indicative of early signs of OCD1,9: (i) presence/absence of irregular ossification front; (ii) presence/absence of bone marrow edema; (iii) disrupted integrity of the secondary physis; and (iv) hyperintense signal in the epiphyseal cartilage. ADC maps were calculated on the MRI scanner from DWI measurements. Regions were manually segmented including trabecular bone in the central region of the distal femoral epicondyles on the coronal DWI images with the lowest b-value (50 s/mm2). Based on previous DWI studies5,6,8, a threshold ADC value of 0.6×10⁻³ mm2/s was used to distinguish between normal and abnormal bone marrow in this cohort.RESULTS
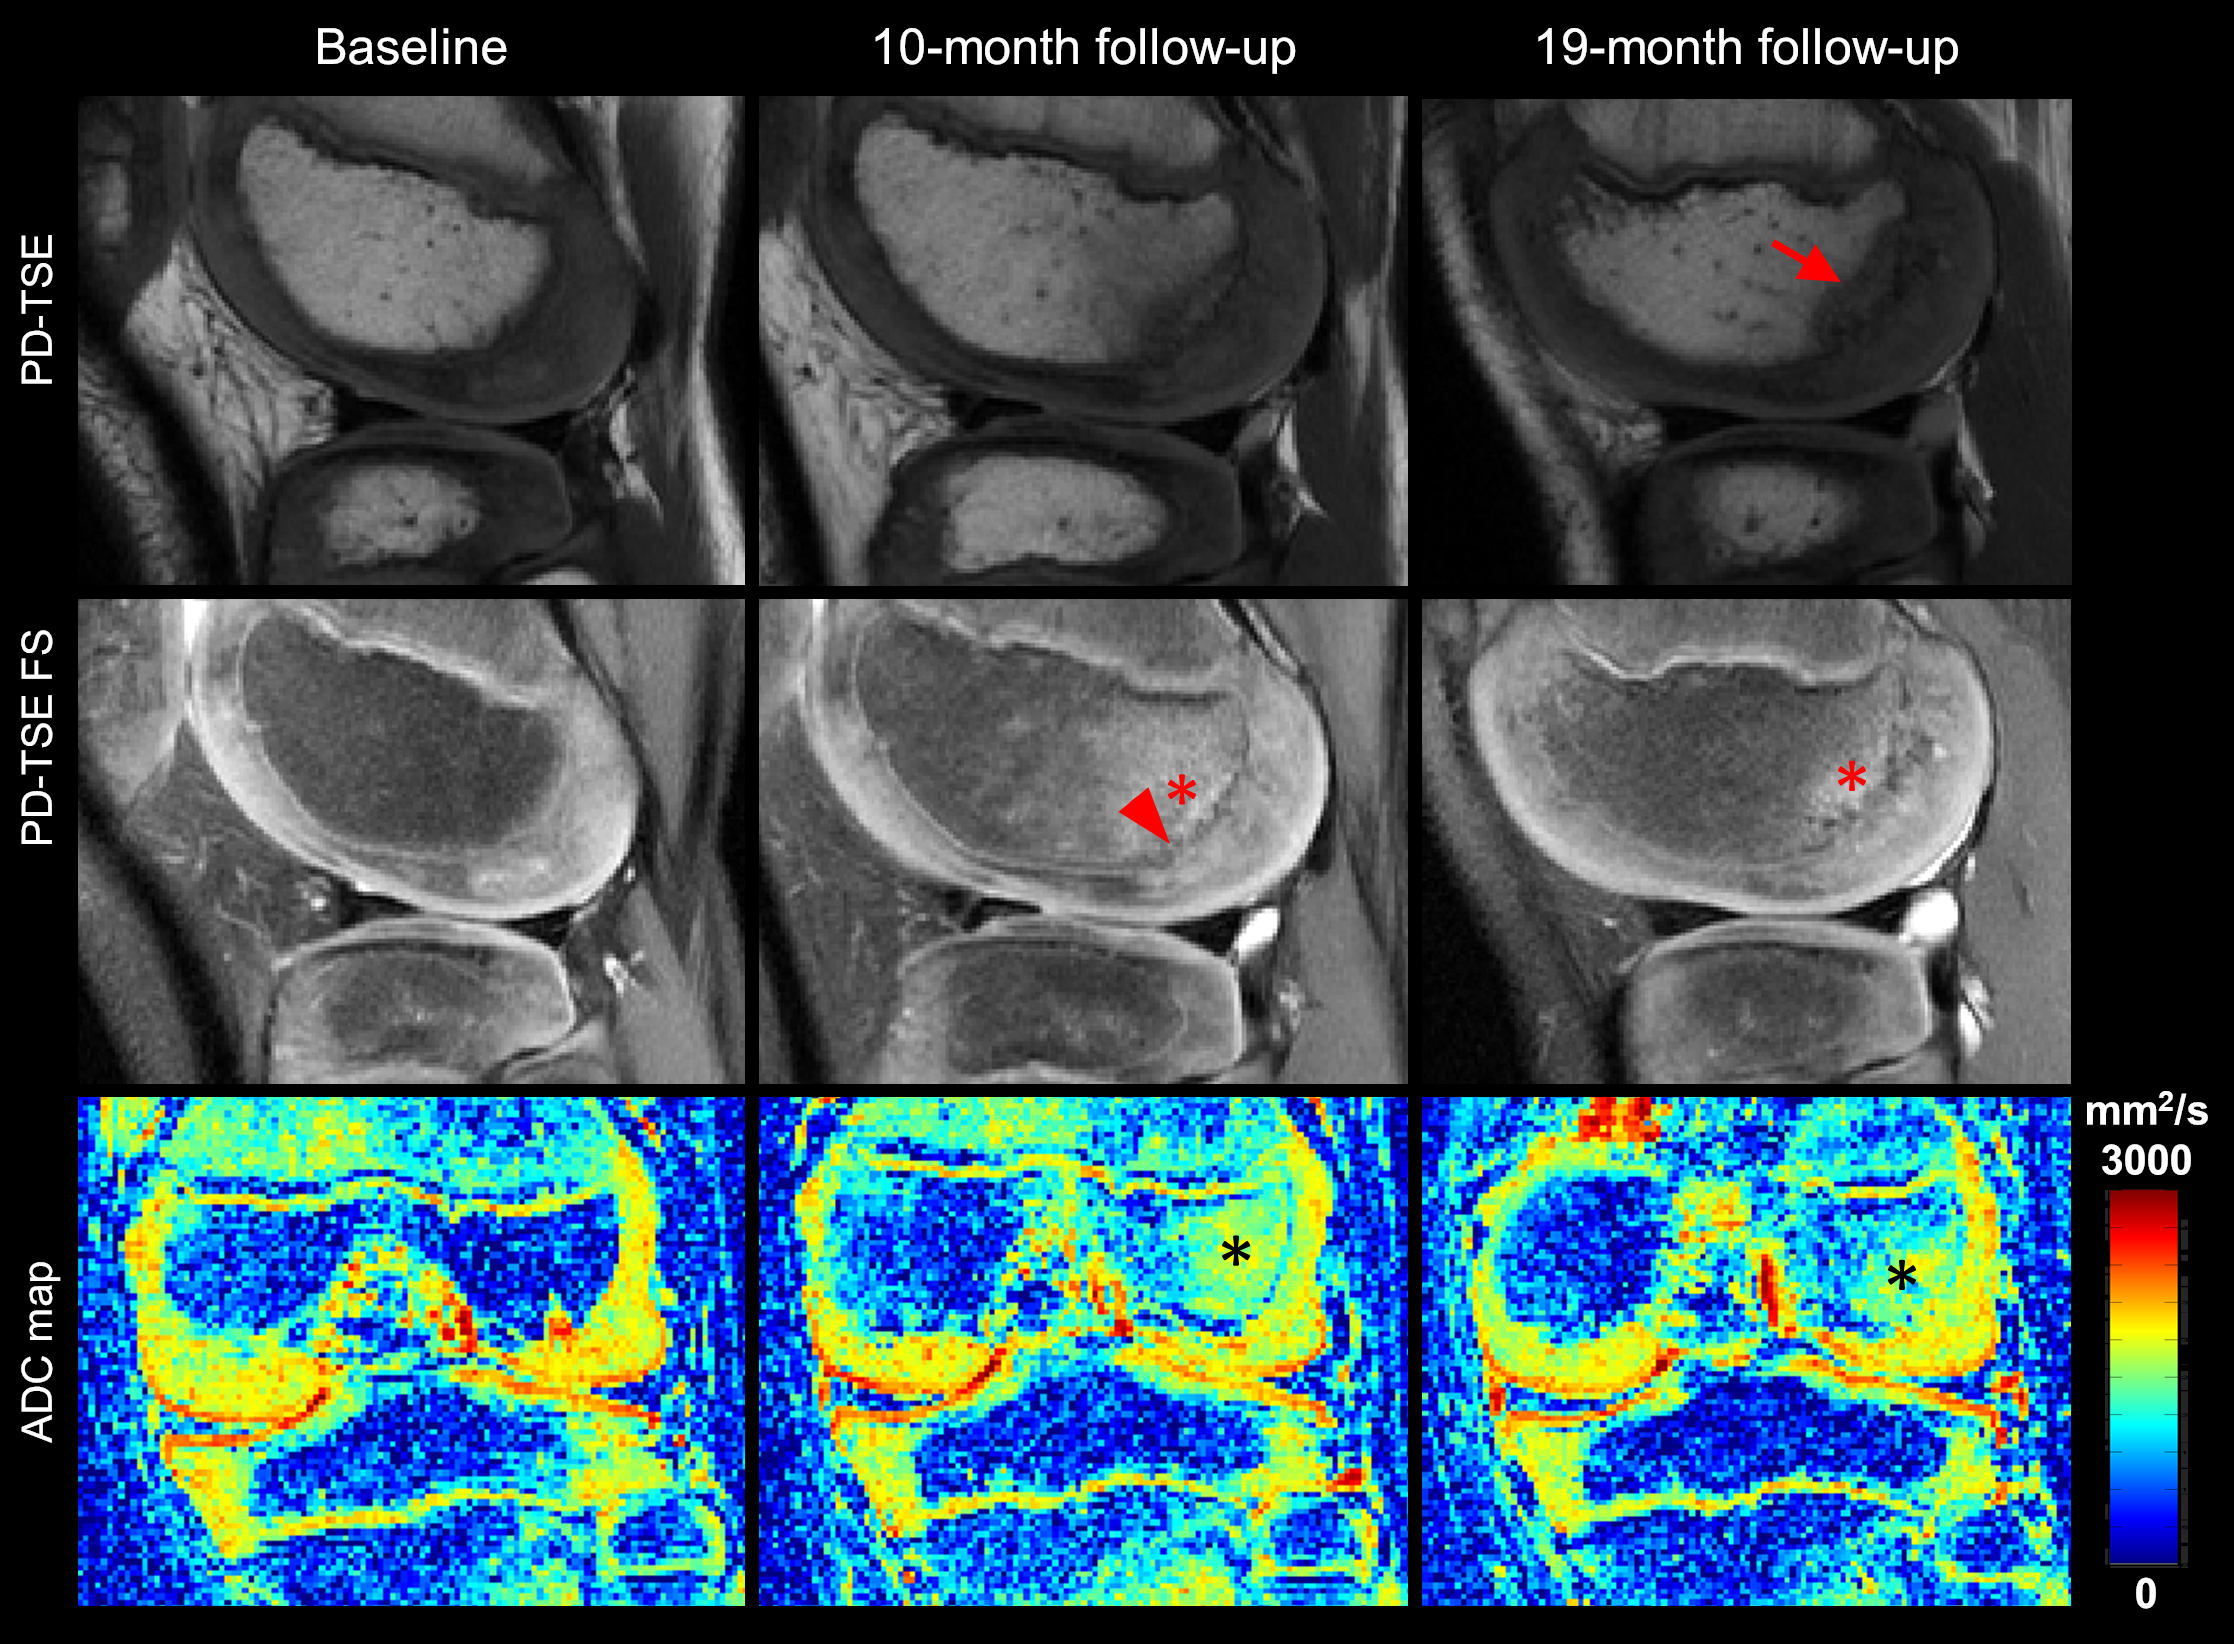
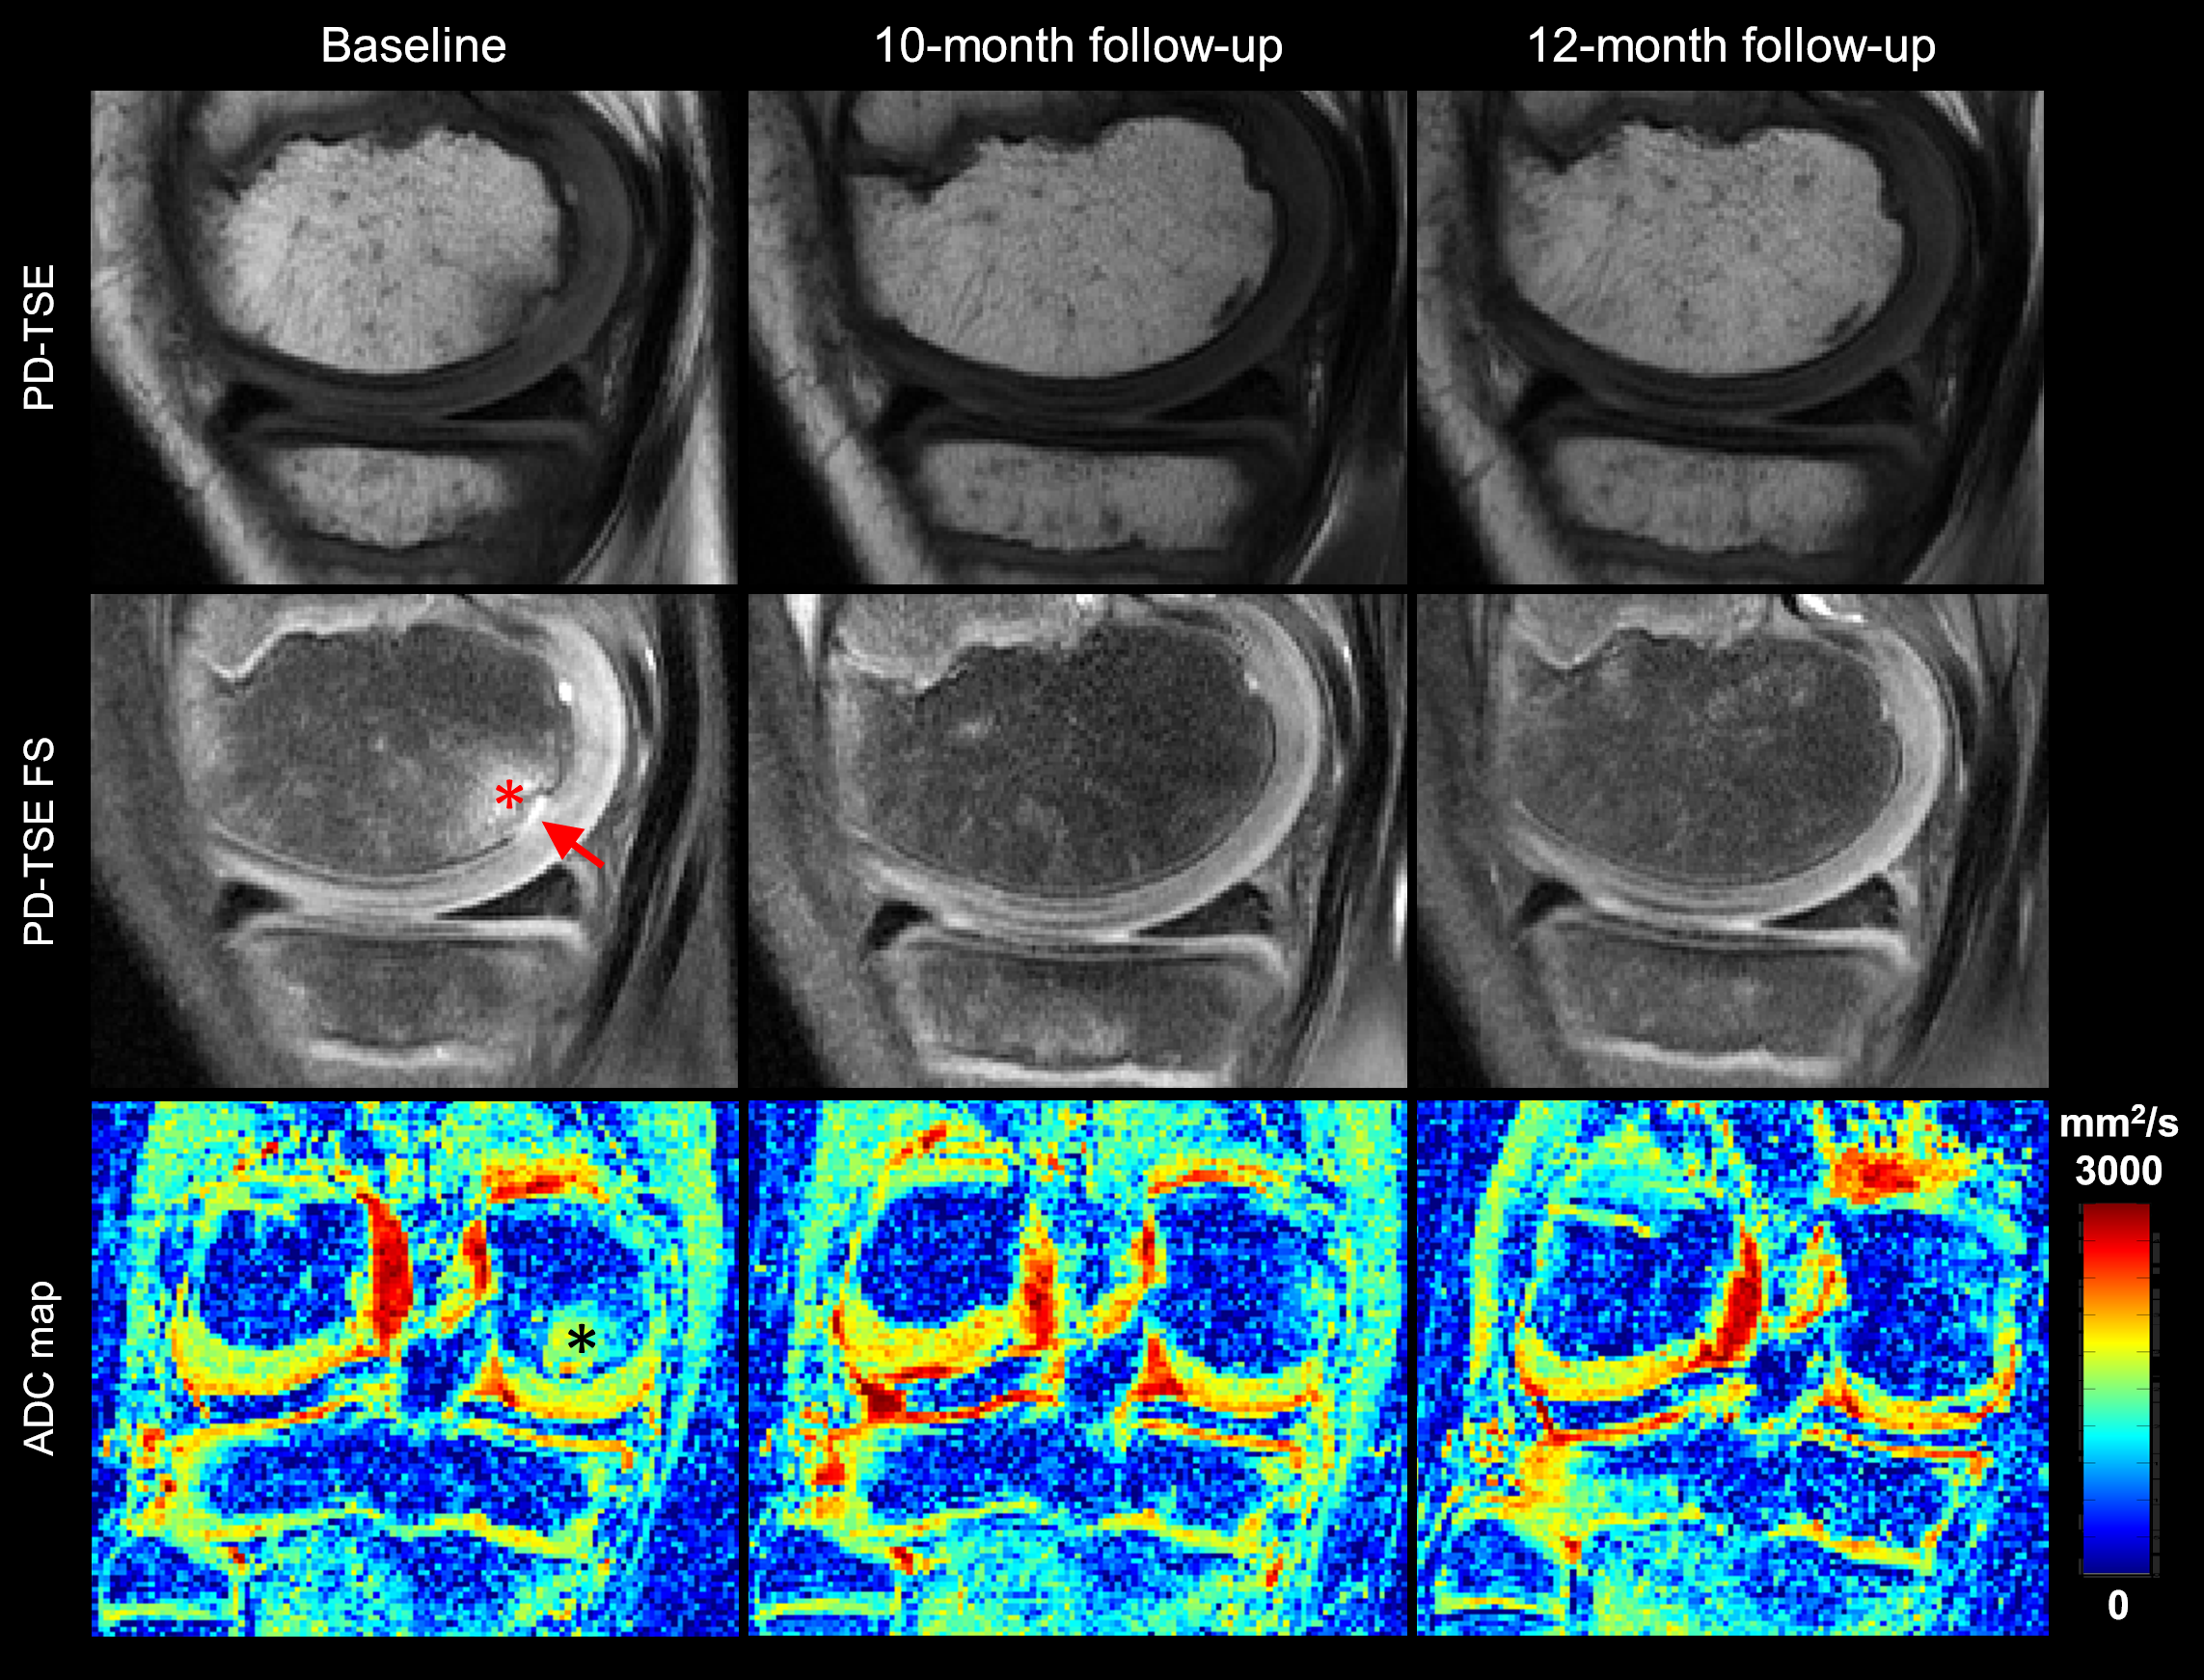
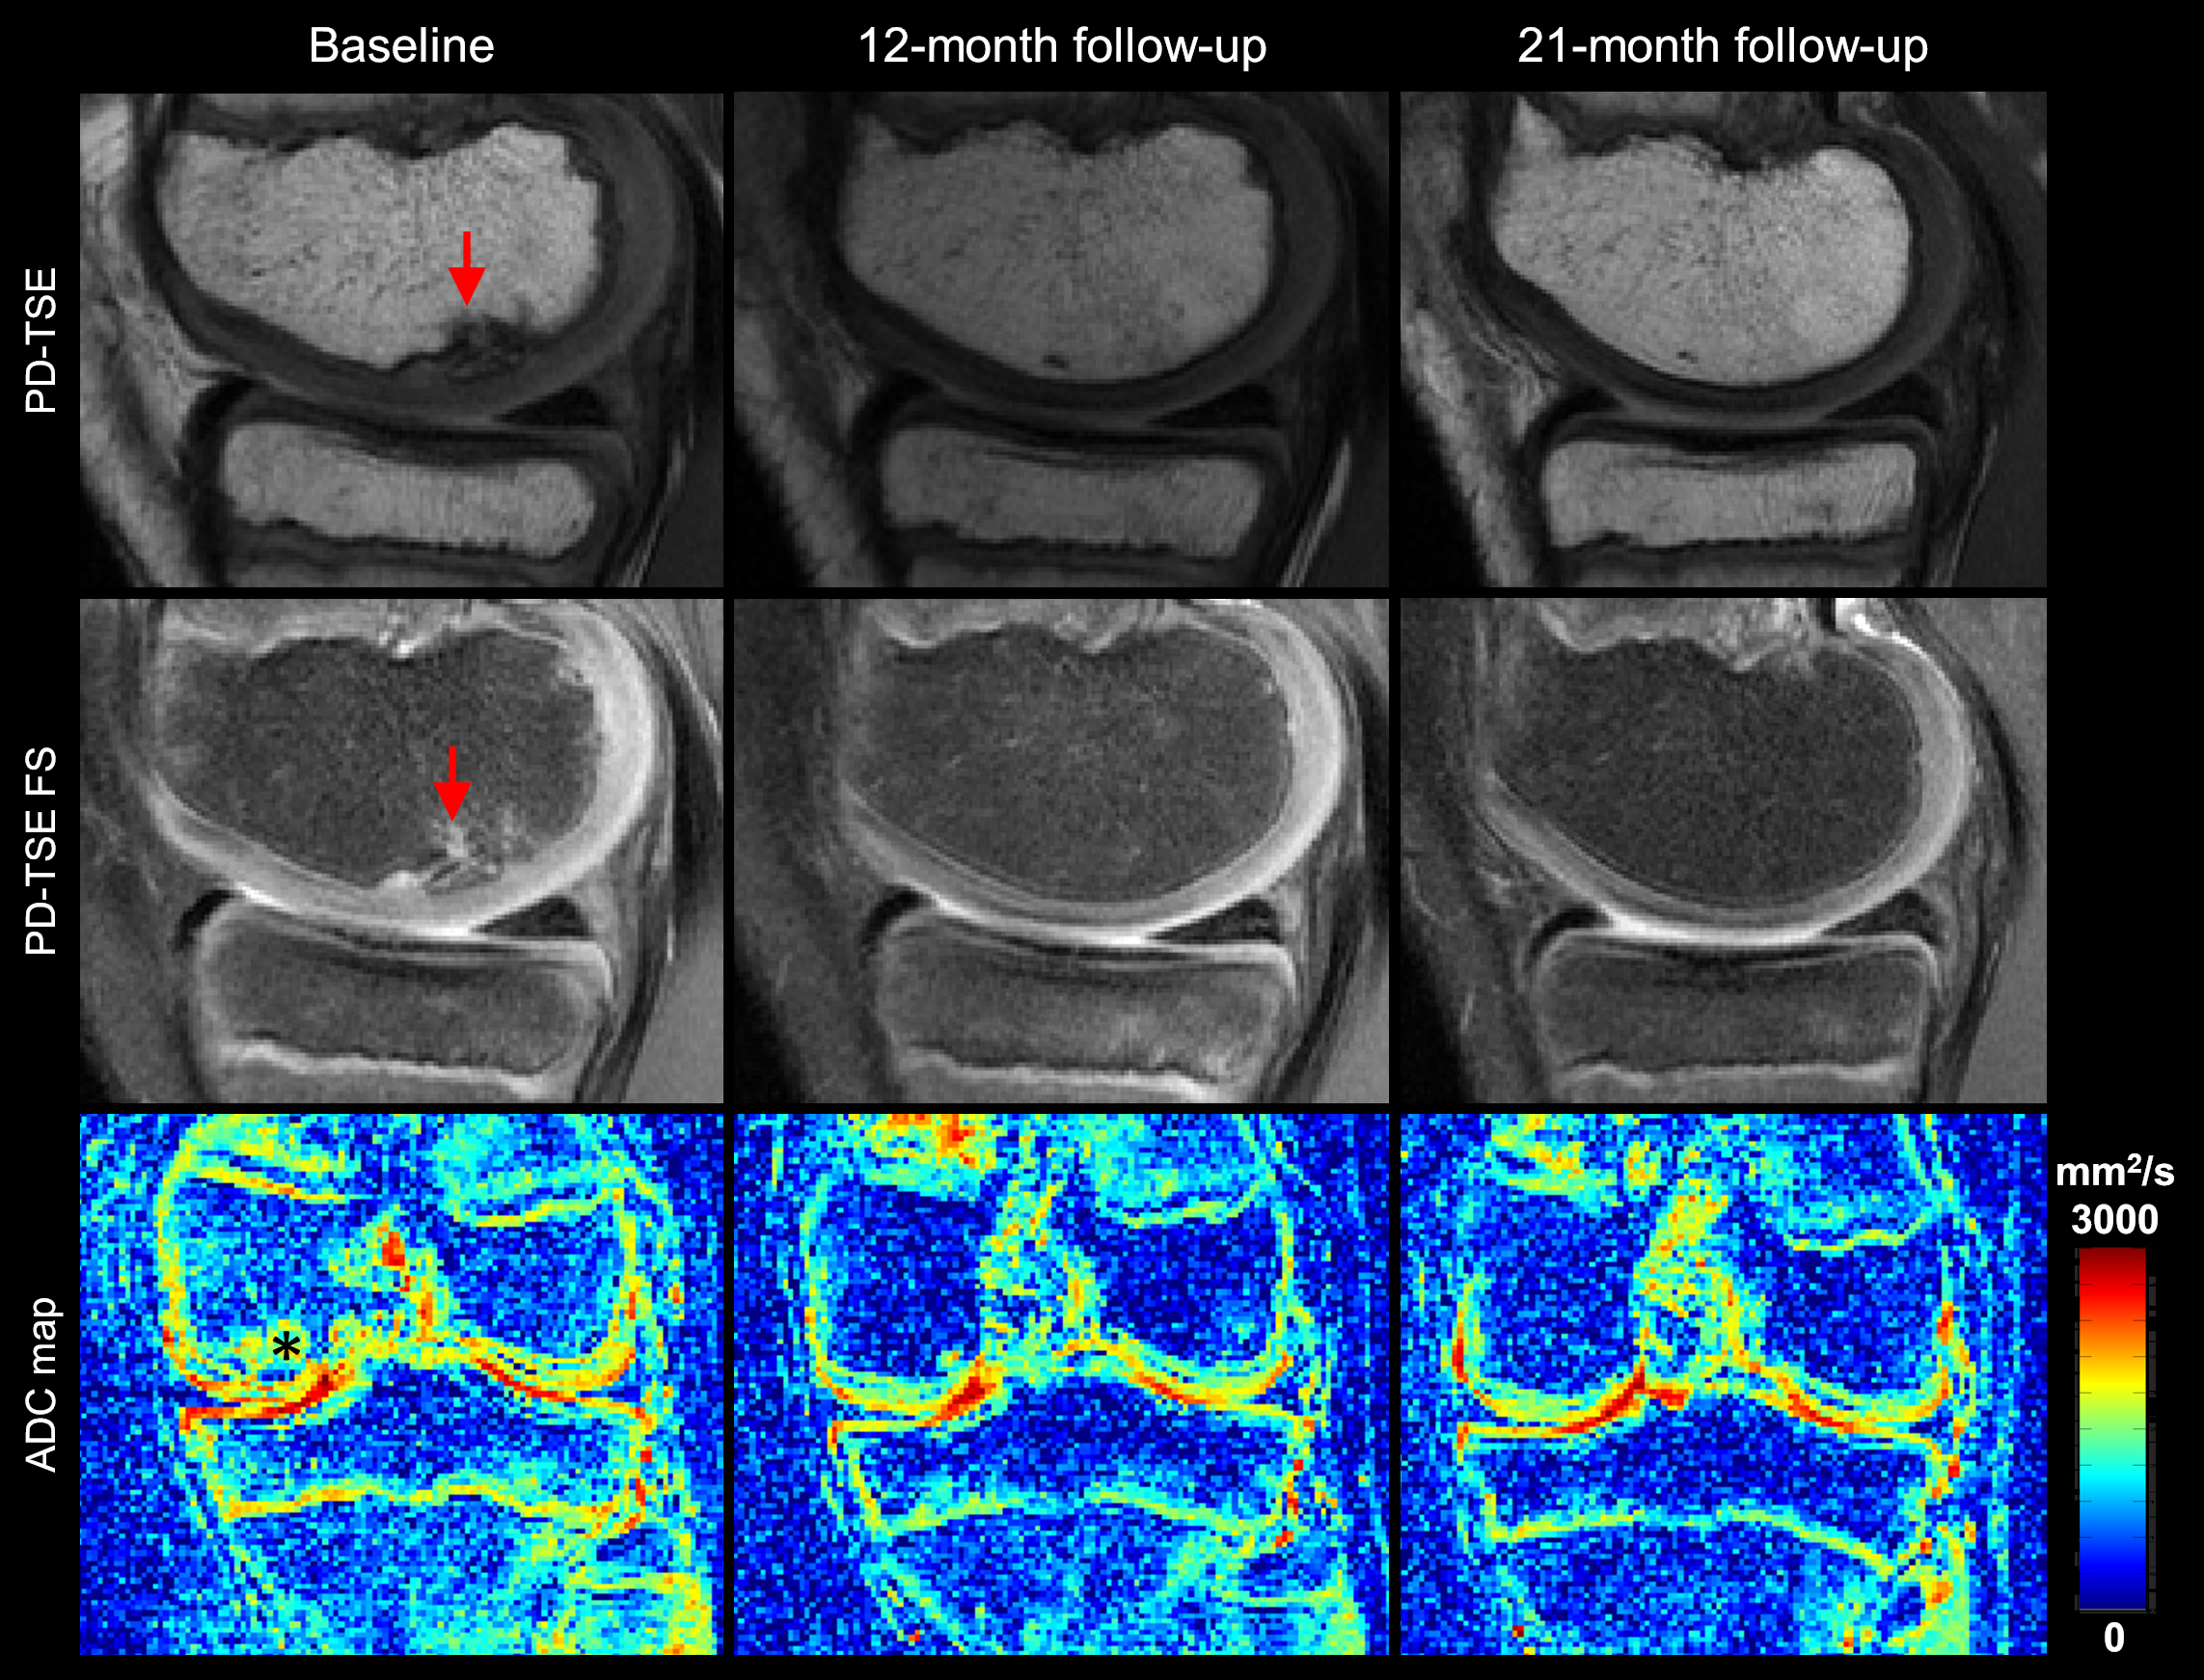
Six of the seven participants (86%) met at least one of the morphological MRI criteria (irregular ossification front, presence of bone marrow edema, disrupted secondary physis and hyperintense signal in the epiphyseal cartilage) defining early OCD lesions. Five out of six participants (83%) with ADC maps had ADC values above the normal threshold at least at one time point during the study. Clinical morphological MRI analysis of the 13 knees (26 medial and lateral epicondyles) found six normal epicondyles and 20 epicondyles with early signs of OCD. Of these 20 epicondyles, eleven epicondyles showed persisted or progressed signs of early OCD (Fig. 2) but the remaining nine epicondyles demonstrated resolution of these findings at the follow-up imaging time points (Fig. 3). One of six epicondyles classified as normal by the morphological MRI criteria showed high ADC values at baseline and six epicondyles without bone marrow edema but irregular ossification front (as determined by the radiologist) were found to have high ADC values (Fig. 4).DISCUSSION
The most important finding of this pilot study is the high prevalence (6 out of 7, 86%) of participants presented with imaging criteria that can be seen in early OCD lesions at least at one time point during the study without developing any clinical symptoms, and 83% of participants (5 out of 6 with ADC maps) had abnormally high diffusion values in the trabecular bone. There is mounting evidence of a genetic contribution to the etiology of OCD2-4. Longitudinal study of this cohort revealed that 55% of the epicondyles with abnormalities indicative of early OCD persisted or progressed during the course of this study on MRI, whereas the remaining 45% showed complete or near-complete resolution. High prevalence of increased diffusivity in this cohort indicate high proton density and depletion of bone marrow fat in the irregular ossification front (confirmed on morphological MRI)5,6, which is an important indicator of early signs of OCD1.CONCLUSION
A high prevalence of MRI abnormalities that can be seen in early stages of OCD in clinically asymptomatic siblings of OCD patients supports the hypothesis that there is a strong genetic predisposition for this disease. Moreover, ADC mapping provided quantitative measures of subtle microstructural alterations in the trabecular bone marrow that augmented morphological MRI findings.Acknowledgements
This study was supported by the NIH, NIAMS grant (R01 AR070020) and NIBIB grant (P41 EB027061).References
[1] Ellermann, J., et al., Radiology 2017; 282(3):798-806.
[2] Chau, M., et al., J Bone Joint Surg Am 2021; 103(12):1132-51.
[3] Stattin, E., et al., Am J Hum Genet 2010; 86(2): 126–137.
[4] Yellin, J., et al., J Pediatr Orthop 2017; 37(1):e32-e36.
[5] Bhojwani, N., et al., Quant Imaging Med Surg 2015; 5(5):740-753.
[6] Sung, J. K., Radiology 2014; 271(2):488-98.
[7] Koutoulidis, V., Radiology 2016; 282(2):484-493.
[8] Ludwig et al. Proc. Intl. Soc. Mag. Reson. Med. 27 (2019):1291.
[9] Jans, L., et al., Eur J Radiol 2012; 81(11):3384-9.
Figures