4941
Study of Aging Muscles using 3D Strain and Strain Rate Projected along Muscle Fiber DTI Eigenvector Directions
Brandon Cunnane1, Vadim Malis2, Usha Sinha1, Ryan Hernandez1, John Hodgson3, and Shantanu Sinha2
1Physics, San Diego State University, San Diego, CA, United States, 2Radiology, UC San Diego, San Diego, CA, United States, 3Inteegrative Biology and Physiology, UC Los Angeles, Los Angles, CA, United States
1Physics, San Diego State University, San Diego, CA, United States, 2Radiology, UC San Diego, San Diego, CA, United States, 3Inteegrative Biology and Physiology, UC Los Angeles, Los Angles, CA, United States
Synopsis
Feasibility is shown of studying aging muscles using rapid, compressed sensing VE-PC technique at relatively high isometric forces to calculate projections of 3D strain and strain rate tensor along fiber eigenvectors calculated from DTI.
Introduction
Strain and Strain rate (SR) imaging based on velocity encoded phase contrast imaging has been established as a viable methodology to study tissue deformations1. These indices are calculated in the magnet frame of reference and then diagonalized to obtain the tensors in the principal basis. However, it is of physiological interest to study the projections of the Strain and SR along the fiber direction and in the fiber cross-section. Further, variation of the deformation indices in the fiber frame of reference with submaximal force output can provide information on stress-strain like relationships. However, such studies have been limited by the long sequence time precluding its use at high %MVCs. We have developed a rapid, compressed-sensing (CS) VE-PC technique to enable acquisitions across a range of %MVCs to extract 3D Strain and SR tensors2. The objective was to study the changes with age and with %MVC in 3D strain and SR tensor projections along the DTI eigenvectors.Methods
11 young (28 ± 7 yrs) and 8 senior (74 ± 6 yrs) subjects were recruited after IRB approval and scanned on a 1.5T GE scanner. Data acquisition and image processing pipeline are summarized in Ref. 1. Gated VE-PC images were obtained during 30%, 40% and 60% MVC (TE: 7.7 ms, TR: 16.4 ms, NEX: 2, FA: 20°, slice thickness 5 mm, sagittal-oblique orientation, FOV: 30 22.5 cm, matrix: 256 192, 17 phases, 3dir velocity encoding, venc: 10 cm/s, 24 repetitions, cycle length 2.9 sec, CS factor 4.3). Three contiguous slices were acquired at each %MVC for a total of nine dynamic acquisitions. The protocol also included a geometrically matched spin echo DTI EPI sequence. The multi-coil CS scheme and reconstruction is outlined in Ref 2. The lower leg rested against a foot-pedal device3 with a strain sensor and anchored within an 8-channel RF coil; real-time visual feedback was provided to the subject. Voxels in the entire volume were tracked to obtain displacements and locations in subsequent temporal frames. 3D Lagrangian strain, L and SR tensors were calculated for the central slice of the three acquired slices. Colormaps of the DTI eigenvectors were compared to the colormaps of the strain/SR eigenvectors; the temporal frame for the latter was identified at the peak of the strain or SR during the compression phase. Strain and strain tensors in the magnet frame were projected to the DTI eigenvectors frame of reference. Each projection, Evv, was determined from:$$E_{vv} = v \cdot Cv$$
where v is the DTI eigenvector (EV1, EV2, EV3) and C is the strain or strain rate tensor. Quantitative analysis was performed for a ROI placed in medial gastrocnemius muscle (7x7). Indices were extracted at the frame corresponding to peak L and SR during the contraction part of the cycle.
Results
Figure 1 shows the colormaps of the DTI eigenvectors superposed on the magnitude image for a young subject; the eigenvector corresponding to the largest eigenvalue is shown in first sub-panel (fiber direction) and color images at 30%, 40%, 60% MVC of the L eigenvectors at the peak (~ frame 12) and of the SR eigenvectors at the peak (~frame 9). L and SR eigenvalues are arranged in ascending order so that LEV1 corresponds to the negative eigenvalue. It can be seen that LEV1 and SREV1 correspond approximately to the fiber direction while the out-plane L or SR component (with little or no deformation) is associated with the secondary DTI eigenvector and the positive L or SR component (radial expansion direction) corresponds to the tertiary DTI eigenvector direction. Figure 2 shows the projection images of L and SR on the DTI eigenvectors (at the contraction peak) superposed on the magnitude images for a young subject. Figure 3 shows temporal plots in an ROI placed in the MG of the L and SR projections on the three DTI EVs for a young and old subject at 30% MVC. It should be noted that L has positive values for the EV3 projection; this arises from a mismatch in the direction of positive and negative directions between diffusion and strain frames. It is negative of the values shown here. Table 1 lists the DTI projections of the strain and strain rate indices (averages in ROIs placed in the MG).Discussion
DTI secondary and tertiary eigenvector directions in skeletal muscle have not been associated with any anatomical organization. This study shows that the secondary and eigenvector DTI directions roughly coincide with L and SR secondary and tertiary eigenvector directions providing a link between structure and function. The L and SR projections on the DTI secondary eigenvector were the smallest; the DTI colormap of the secondary eigenvector (predominantly red) shows that it is in the LR direction which is the out-plane direction for sagittal images. This confirms earlier studies in the principal frame where the smallest deformation was in the out-plane direction. The projection values along EV3 (fiber) were smaller for older subjects compared to young subjects.Conclusion
Compressed sensing VE-PC enables rapid 3D Strain and Strain Rate tensor imaging. Combined with DTI, the projections on the DTI eigenvectors can be determined and is shown to decrease in a study of aging muscles.Acknowledgements
This work was supported by the National Institute on Aging Grant No. R01AG056999.References
[1] Malis V, et al. Magn Reson Med. 2017; 79(2): 912-922.
[2] Malis V, et al. Magn Reson Med. 2020; 84(1): 142-156.
[3] Sinha S, et al. J Magn Reson Imaging. 2012; 36(2): 498–504.
Figures
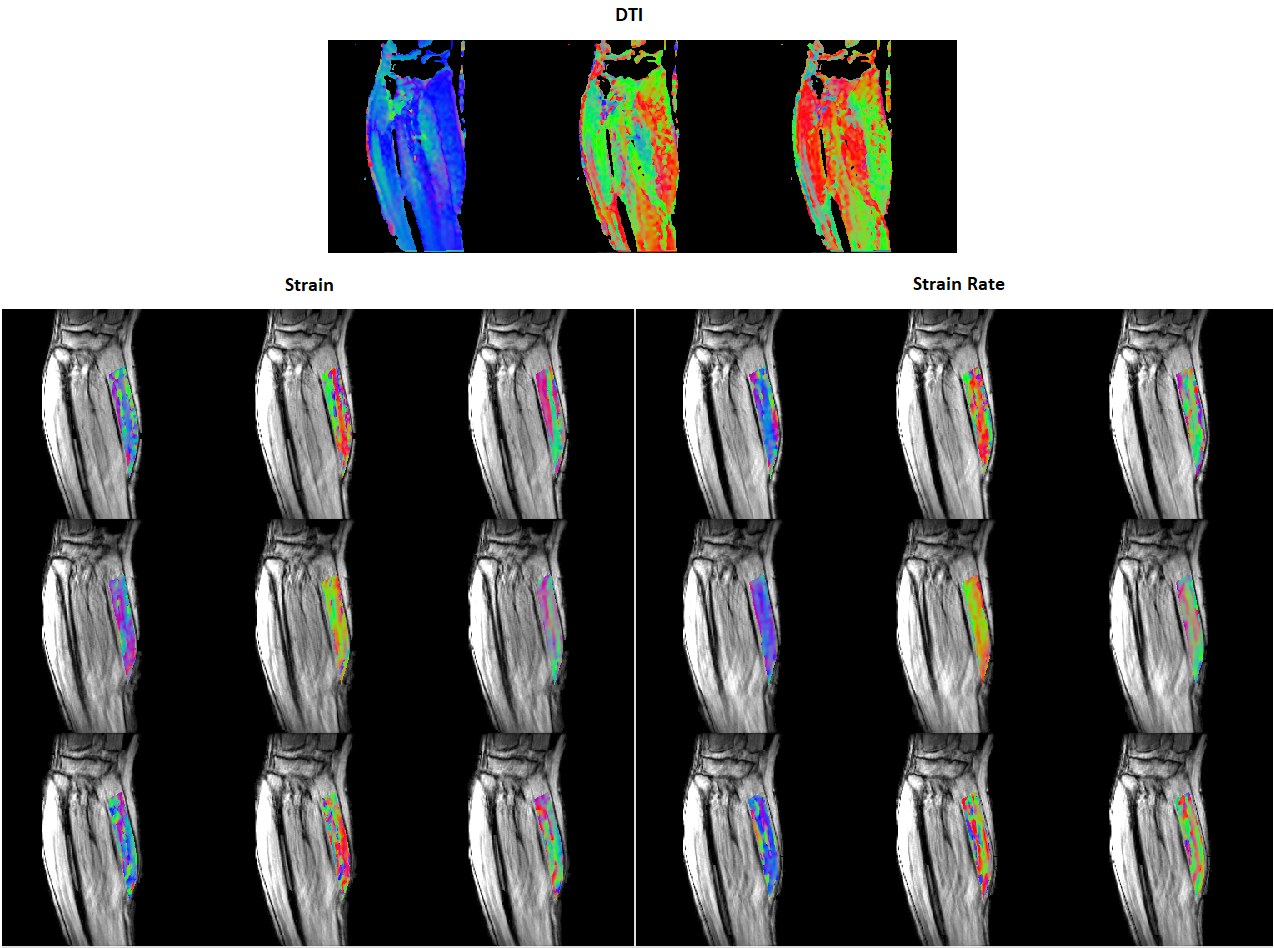
Figure 1. Young subject’s eigenvector colormaps (red:
left to right, green: anterior to posterior, and blue: superior to inferior). Strain
and SR eigenvector colormaps in the MG muscle are superposed on the magnitude
image. From top to bottom, the rows show colormaps for 30%, 40%, and 60% MVC. The
DTI eigenvectors are displayed in descending order so the eigenvector
corresponding to the highest eigenvalue (fiber direction) is shown in the left
most image. The L and SR eigenvectors are displayed in ascending order –
negative strain eigenvalues are the left most colormap.
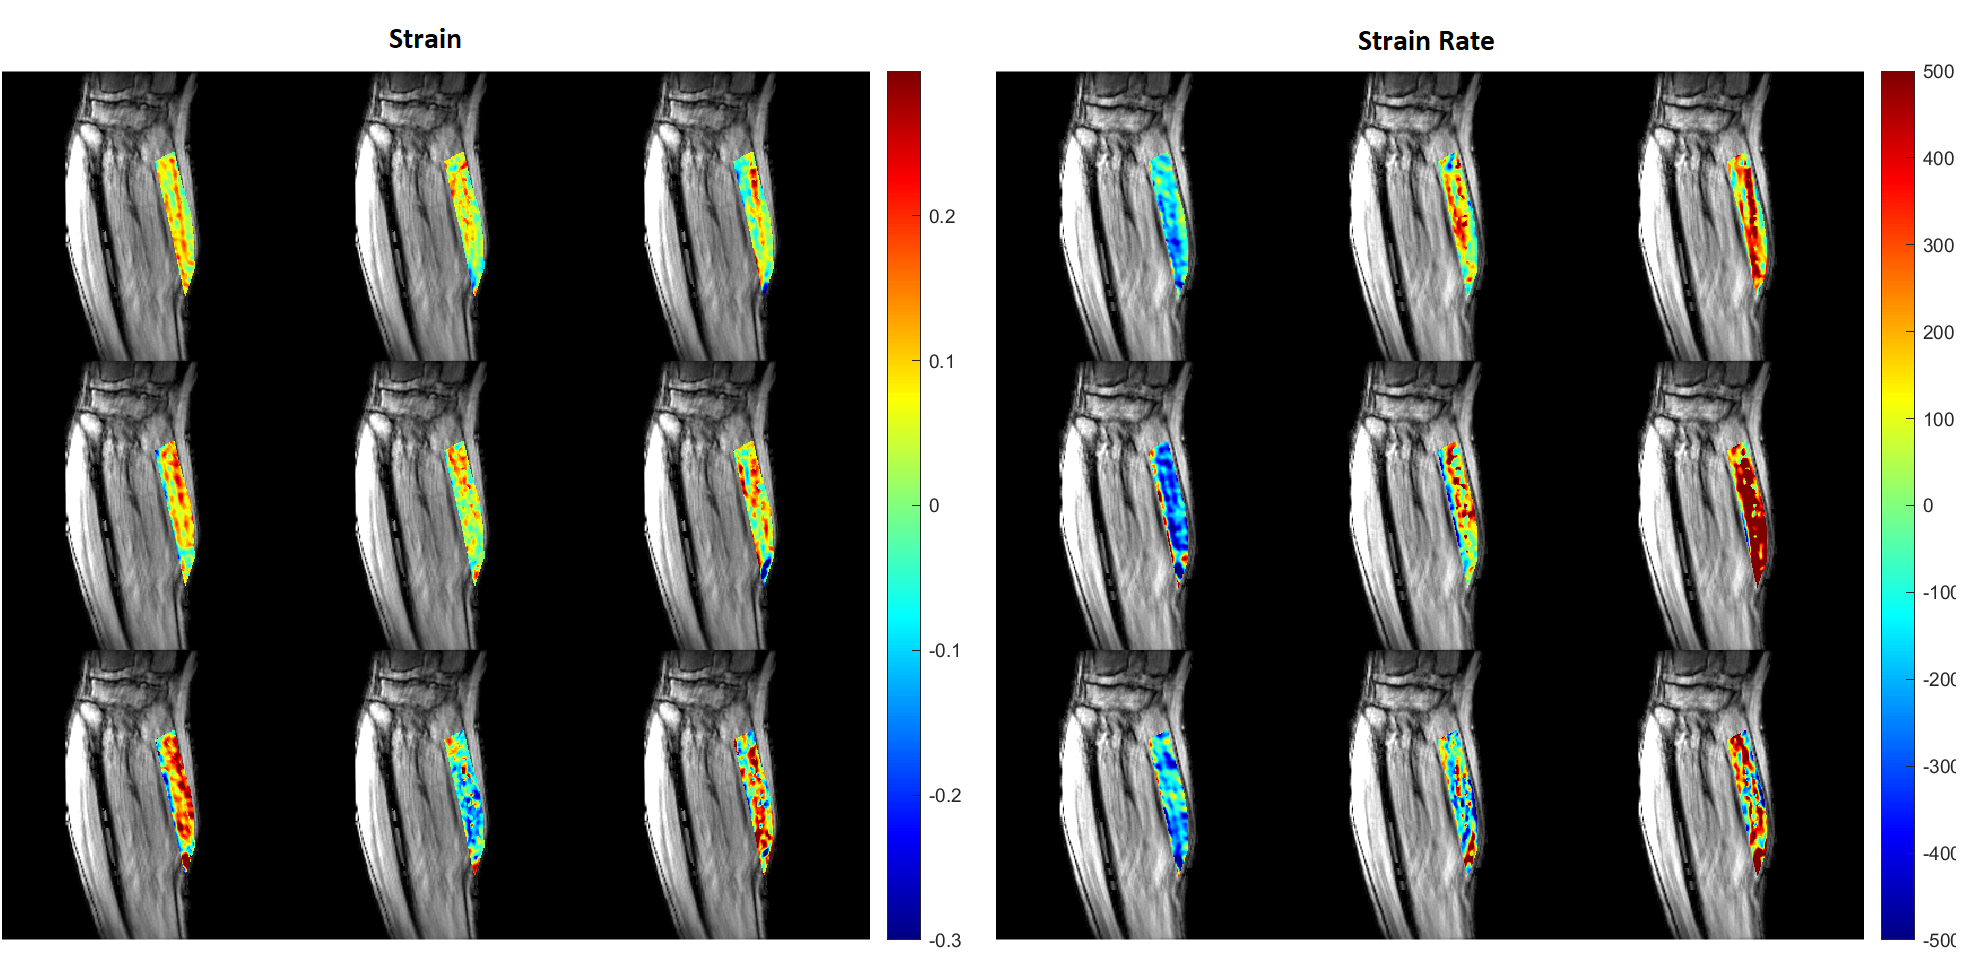
Figure 2. Young subject’s strain (left) and strain
rate [s-1] (right) projected on the DTI eigenvectors (at the
contraction peak) in the MG muscle superposed on the magnitude image. From top
to bottom, the rows show the projection for 30%, 40%, and 60% MVC. The
projections are displayed in order of descending DTI eigenvectors from left to
right (Projection on- Column 1: primary DTI eigenvector, Column 2: secondary
DTI eigenvector, Column 3: tertiary DTI eigenvector).
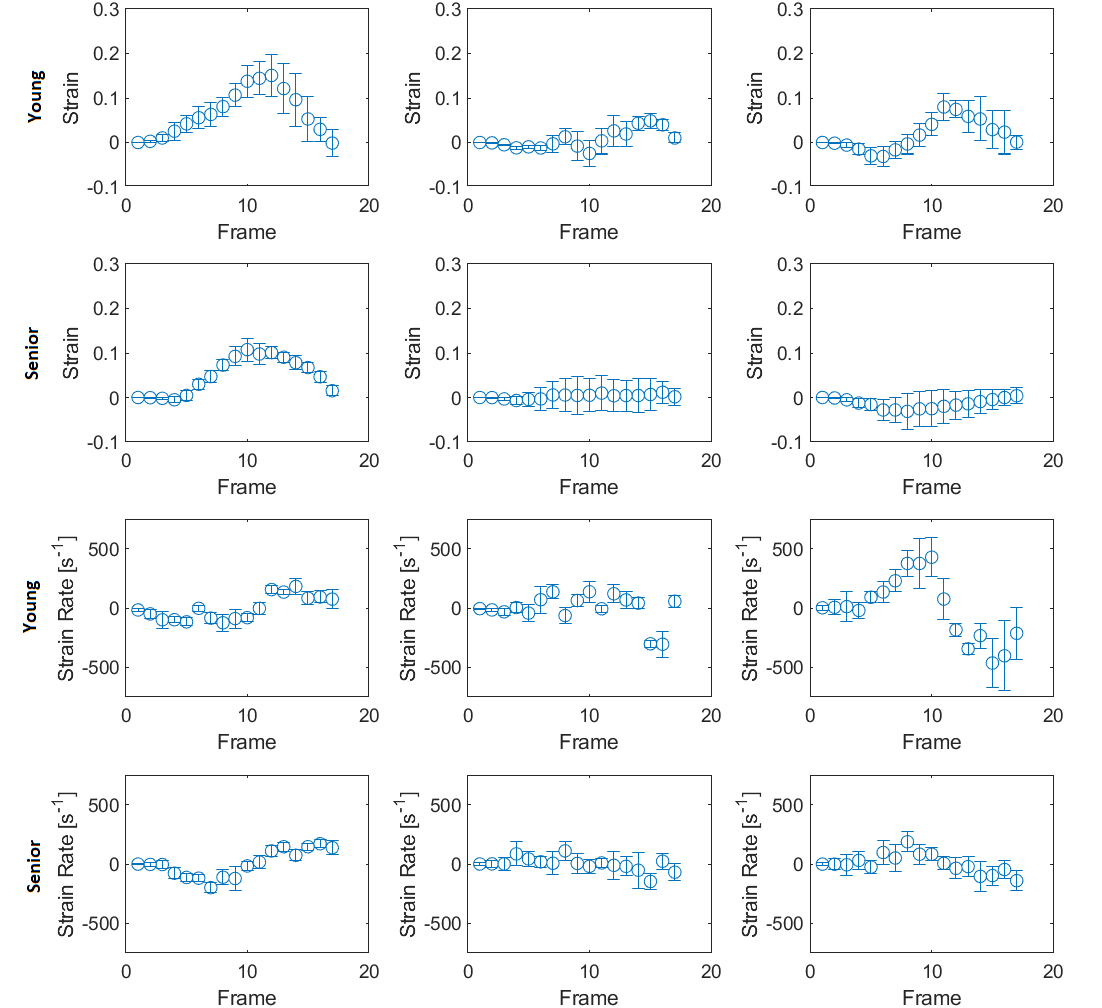
Figure 3. Average strain or strain rate in ROI within
MG muscle vs temporal frame during muscle isometric contraction cycle for young
and senior subject at 30% MVC. The projections are displayed in order of
descending DTI eigenvectors from left to right. Error bars represent standard
deviation.
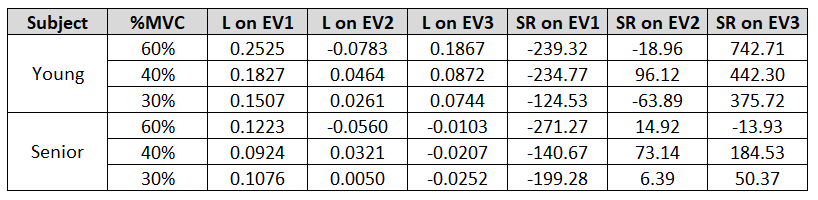
Table 1. Results of strain and strain rate projection
on DTI eigenvectors for young and senior subject.
DOI: https://doi.org/10.58530/2022/4941