4940
Quantitative Ultrashort Echo Time (UTE) imaging of Osteochondral Junction1Department of Radiology, University of California, San Diego, CA, United States, 2Radiology Service, Veterans Affairs, San Diego Healthcare System, San Diego, CA, United States
Synopsis
MRI-based compositional imaging of cartilage has higher sensitivity to detect early changes in osteoarthritis. The osteochondral junction (OCJ) is of particular interest since it has been associated with early changes and progression of cartilage degeneration. However, conventional MRI sequences cannot differentiate with high contrast the OCJ region for quantification. Here we present quantification of T1, T1rho, T2*, and macromolecular fraction (MMF) of deep and superficial layers knee cartilage using 3D ultrashort echo time (UTE) MRI cones sequences and correlate the values from the OCJ with the degree of cartilage degeneration according to the MRI Osteoarthritis Knee Cartilage Score (MOAKS).
Synopsys
MRI-based compositional imaging of cartilage has higher sensitivity to detect early changes in osteoarthritis and can be used as a biomarker for prediction and long-term evaluation of treatment. The osteochondral junction (OCJ) is of particular interest since it has been associated with early changes of cartilage degeneration. However, conventional MRI sequences cannot differentiate with high contrast the OCJ for quantification. We present quantification of T1, T1rho, T2*, and macromolecular fraction (MMF) of deep and superficial layers of ex vivo knee cartilage using 3D ultrashort echo time (UTE) MRI cones sequences and correlate the values from the deep cartilage with the degree of cartilage degeneration according to the MRI Osteoarthritis Knee Cartilage Score (MOAKS).Summary of Main Findings
There was a significant difference in measurements between deep and superficial layers, with lower T1, T1rho, and T2* values, but higher MMF in the OCJ. Also, when considering only the OCJ, there was a significant positive correlation between T1, T1rho, and T2* measurements and the degree of cartilage degeneration, but an inverse correlation between MMF and cartilage degeneration.Introduction
Osteoarthritis (OA) is a common and debilitating joint disorder with no effective drug treatment1. There has been increased interest in imaging biomarkers to aid in earlier diagnosis and treatments due to its high sensitivity2,3.The osteochondral junction (OCJ) plays an important role in the early development of knee OA4. However, conventional MRI sequences are not able to image this region efficiently due to a signal decay that is more rapid than more superficial layers, which limits cartilage assessment to full cartilage evaluation5,6. Ultrashort echo time (UTE) MRI’s ability to image tissues with short transverse relaxations allows it to image and differentiate superficial from deep layers with high contrast7-9.
Recently, quantitative 3D UTE imaging techniques have been developed in our group to assess both short and long T2 tissues in the musculoskeletal system. These techniques include the UTE multi-echo sequence for T2* measurement10, UTE actual flip angle imaging and variable flip angle sequences (UTE-AFI-VFA) for T1 measurement11, the adiabatic T1rho-prepared UTE (UTE-AdiabT1rho) sequence for T1rho measurement12, and the magnetization transfer-prepared UTE (UTE-MT) sequence for macromolecular proton fraction (MMF) measurements13.
Here, for the first time, we evaluated four quantitative UTE imaging biomarkers (T1, T1rho, MMF, and T2*) on ex vivo knee cartilage and correlated them with their respective cartilage MRI Osteoarthritis Knee Scores (MOAKS)14. Our main goal was to assess the differences between the OCJ region and superficial cartilage using quantitative UTE imaging, as well as the correlation between UTE imaging biomarkers and the degree of OA.
Methods
The features of the quantitative UTE imaging sequences are shown in Figure 1. A total of 35 ex vivo knee specimens from 34 donors was scanned on a 3T GE MR750 scanner. The sequence parameters were: A) 3D multi-echo UTE with an echo train of six TEs=0.032, 4.4, 8.8, 13.2, 22, and 35.2ms; TR=100ms; and flip angle (FA)=10˚; B) 3D UTE-AdiabT1rho12: spin lock times (TSLs)=0, 12, 24, 36, 48, 72, and 96ms corresponding to the number of adiabatic full passage pulses=0, 2, 4, 6, 8, 12, and 16; TR=500ms; FA=10°; number of spokes (Nsp) in a TR=21; and interspoke interval τ=6ms; C) 3D UTE-MT13: MT pulse FAs=500°, 1000°, and 1500°; MT pulse frequency offsets=2, 5, 10, 20, and 50kHz; TR=100ms; FA=7˚; Nsp=9; and τ=6ms; D) 3D UTE-AFI11: TR1/TR2=20/100ms and FA=45˚; and E) 3D UTE-VFA: FAs=5, 10, 20, and 30˚ and TR=20ms. The field of view, matrix size, and scan time were 15×15×8cm3, 256×256×40, and 90min.Regions of interest (ROIs) were drawn by an experienced musculoskeletal radiologist in the OCJ region, superficial cartilage, and full cartilage thickness on the anterior, inferior, and posterior regions of the femoral condyles and the tibial plateau according to the MOAKS8. Imaging analysis was performed using MATLAB.
Results and Discussion
Representative images of the four sequences (T1, T1rho, MT, and T2*), ROIs, and fitting curves for the two cartilage layers as well as the full cartilage (i.e., both cartilage layers together) are shown in Figure 2. Figure 3 shows that T1, T1rho, and T2* relaxation times as well as the MMF of OCJ regions were significantly different from those of the superficial and full cartilage (p < .001). While T1, T1rho, and T2* relaxation times increased from deep to superficial cartilage, MMF decreased from the OCJ to superficial cartilage. Moreover, there was a significant positive correlation between T1, T1rho, and T2 relaxation times and the cartilage degeneration, whereas the MMF showed a significant negative correlation (Figure 4). A summary of the UTE imaging biomarkers according to cartilage layer and knee region is presented in Table 1.Our study showed that quantitative UTE imaging can be used to assess the OCJ region of the knee ex vivo and that those biomarkers can reveal differences according to the cartilage layers. There is also a trend towards increased T1, T1rho, and T2* relaxation times and decreased MMF according to the cartilage degeneration as measured by MOAKS. An increase in T1rho/T2* and a decrease in MMF may be associated with changes in these biochemical components as cartilage degeneration progresses. In conclusion quantitative UTE of OCJ has potential for evaluation of knee abnormalities.
Acknowledgements
The authors acknowledge grant support from NIH (R01AR062581, R01AR068987, R01AR075825, R01AR078877, and R21AR075851), VA Clinical Science and Rehabilitation Research and Development Services (Merit Awards I01CX001388 and I01RX002604), and GE Healthcare.
References
References
1. Goldring MB, Berenbaum F. Emerging targets in osteoarthritis therapy. Current opinion in pharmacology. 2015;22:51-63.
2. Emery CA, Whittaker JL, Mahmoudian A, et al. Establishing outcome measures in early knee osteoarthritis. Nature Reviews Rheumatology. 2019;15(7):438-448.
3. Prasad A, Nardo L, Schooler J, Joseph G, Link T. T1ρ and T2 relaxation times predict progression of knee osteoarthritis. Osteoarthritis and cartilage. 2013;21(1):69-76.
4. Hwang J, Bae WC, Shieu W, Lewis CW, Bugbee WD, Sah RL. Increased hydraulic conductance of human articular cartilage and subchondral bone plate with progression of osteoarthritis. Arthritis & Rheumatism: Official Journal of the American College of Rheumatology. 2008;58(12):3831-3842.
5. Gallo MC, Wyatt C, Pedoia V, et al. T1ρ and T2 relaxation times are associated with progression of hip osteoarthritis. Osteoarthritis and cartilage. 2016;24(8):1399-1407.
6. Joseph G, Baum T, Alizai H, et al. Baseline mean and heterogeneity of MR cartilage T2 are associated with morphologic degeneration of cartilage, meniscus, and bone marrow over 3 years–data from the Osteoarthritis Initiative. Osteoarthritis and cartilage. 2012;20(7):727-735.
7. Cai Z, Wei Z, Wu M, et al. Knee osteochondral junction imaging using a fast 3D T1-weighted ultrashort echo time cones sequence at 3T. Magnetic Resonance Imaging. 2020;73:76-83.
8. Lombardi AF, Jang H, Wei Z, et al. High‐contrast osteochondral junction imaging using a 3D dual adiabatic inversion recovery‐prepared ultrashort echo time cones sequence. NMR in Biomedicine. 2021:e4559.
9. Ma YJ, Jerban S, Carl M, et al. Imaging of the region of the osteochondral junction (OCJ) using a 3D adiabatic inversion recovery prepared ultrashort echo time cones (3D IR‐UTE‐cones) sequence at 3 T. NMR in Biomedicine. 2019;32(5):e4080.
10. Williams AA, Titchenal MR, Do BH, Guha A, Chu CR. MRI UTE‐T2* shows high incidence of cartilage subsurface matrix changes 2 years after ACL reconstruction. Journal of Orthopaedic Research®. 2019;37(2):370-377.
11. Ma YJ, Zhao W, Wan L, et al. Whole knee joint T1 values measured in vivo at 3T by combined 3D ultrashort echo time cones actual flip angle and variable flip angle methods. Magnetic resonance in medicine. 2019;81(3):1634-1644.
12. Ma YJ, Carl M, Searleman A, Lu X, Chang EY, Du J. 3D adiabatic T1ρ prepared ultrashort echo time cones sequence for whole knee imaging. Magnetic resonance in medicine. 2018;80(4):1429-1439.
13. Ma YJ, Chang EY, Carl M, Du J. Quantitative magnetization transfer ultrashort echo time imaging using a time‐efficient 3D multispoke Cones sequence. Magnetic resonance in medicine. 2018;79(2):692-700.
14. Hunter DJ, Guermazi A, Lo GH, et al. Evolution of semi-quantitative whole joint assessment of knee OA: MOAKS (MRI Osteoarthritis Knee Score). Osteoarthritis and cartilage. 2011;19(8):990-1002.
Figures

Figure 1. Diagram of the quantitative 3D UTE sequences. A multi-echo UTE sequence is used for T2* measurement (A). A train of AFP pulses (hyperbolic secant shape, duration of 6.048 ms, and bandwidth of 1.643 kHz) is used to lock the spin to generate the T1rho contrast (B). A Fermi pulse with a duration of 8 ms and a bandwidth of 160 Hz is used to saturate the magnetization of the macromolecular proton pool to generate the MT contrast (C). The AFI sequence with interleaved TRs (D) is used to measure and correct B1 inhomogeneity for all quantifications.
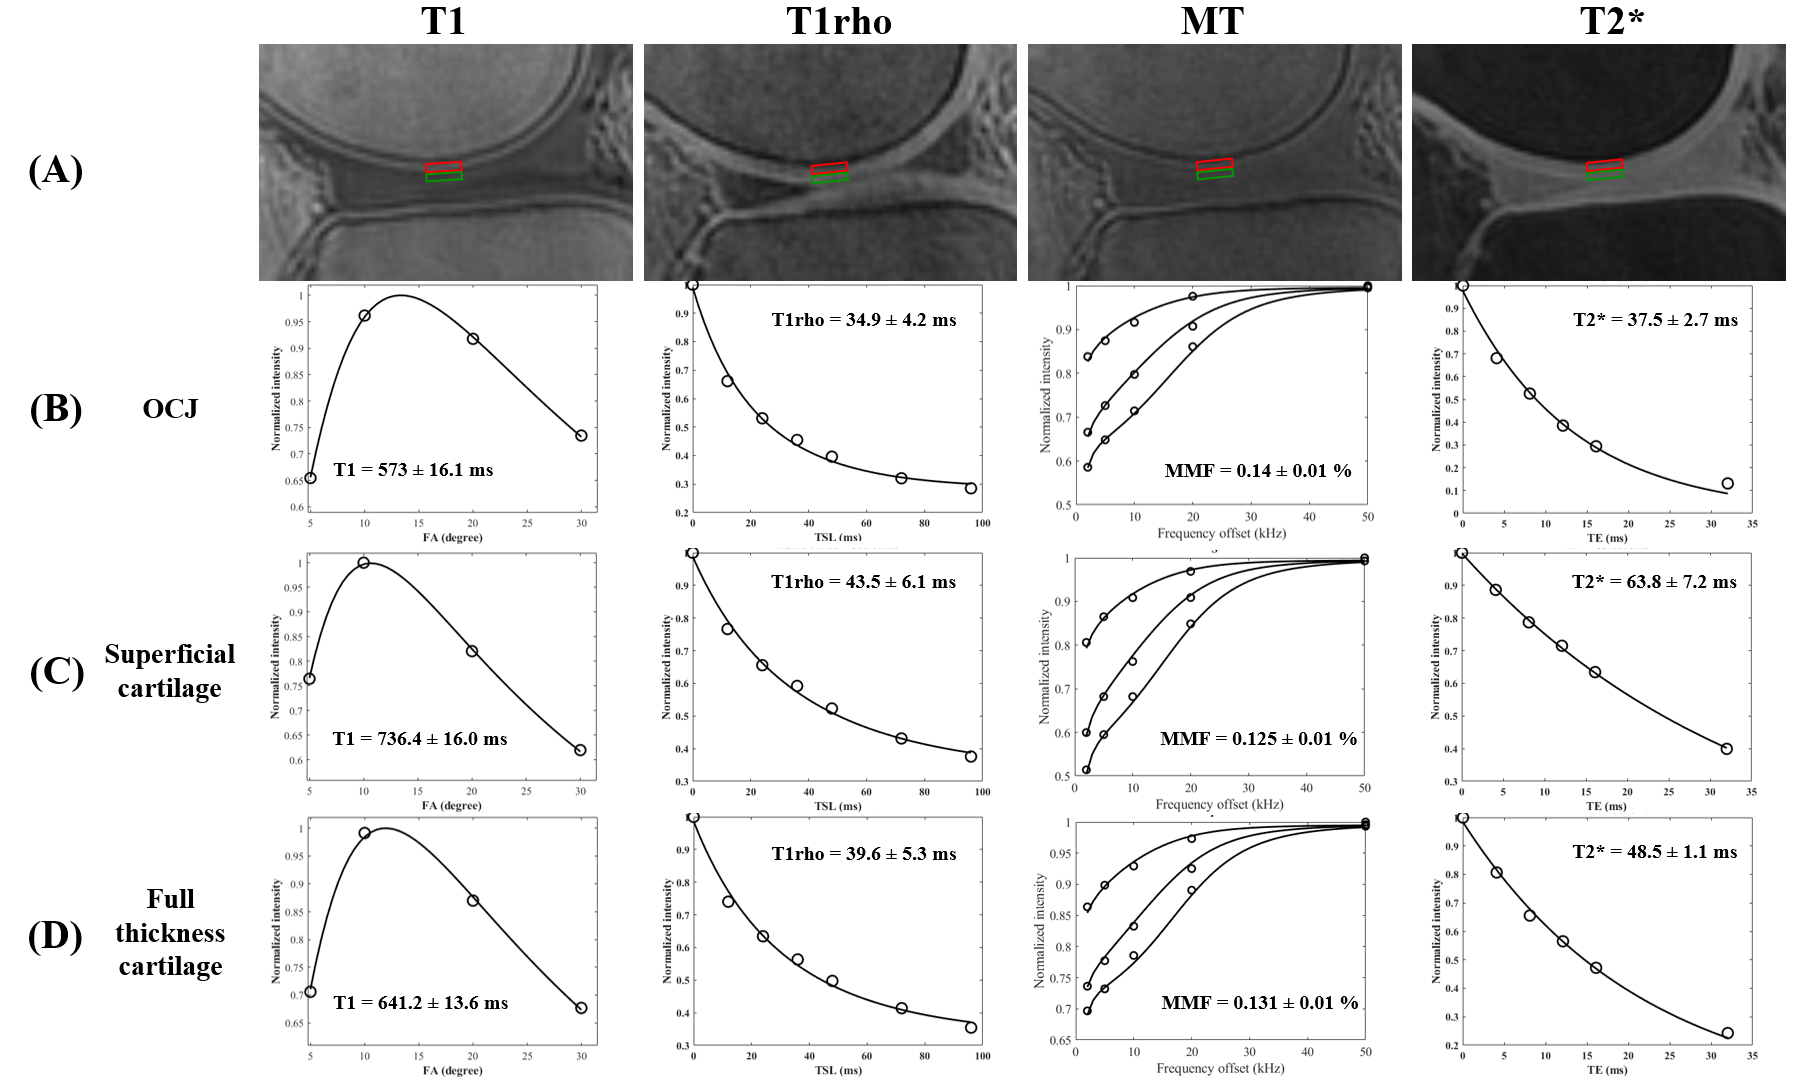
Figure 2. Representative images of the quantitative UTE MRI sequence (A) with ROIs drawn in the OCJ (red), superficial cartilage (grey), and full thickness cartilage (i.e., both red and blue regions together). Panels B, C, and D show the representative fitting curves and corresponding values (i.e., T1, T1rho, MMF, and T2*) from the OCJ, superficial cartilage, and full thickness cartilage, respectively.
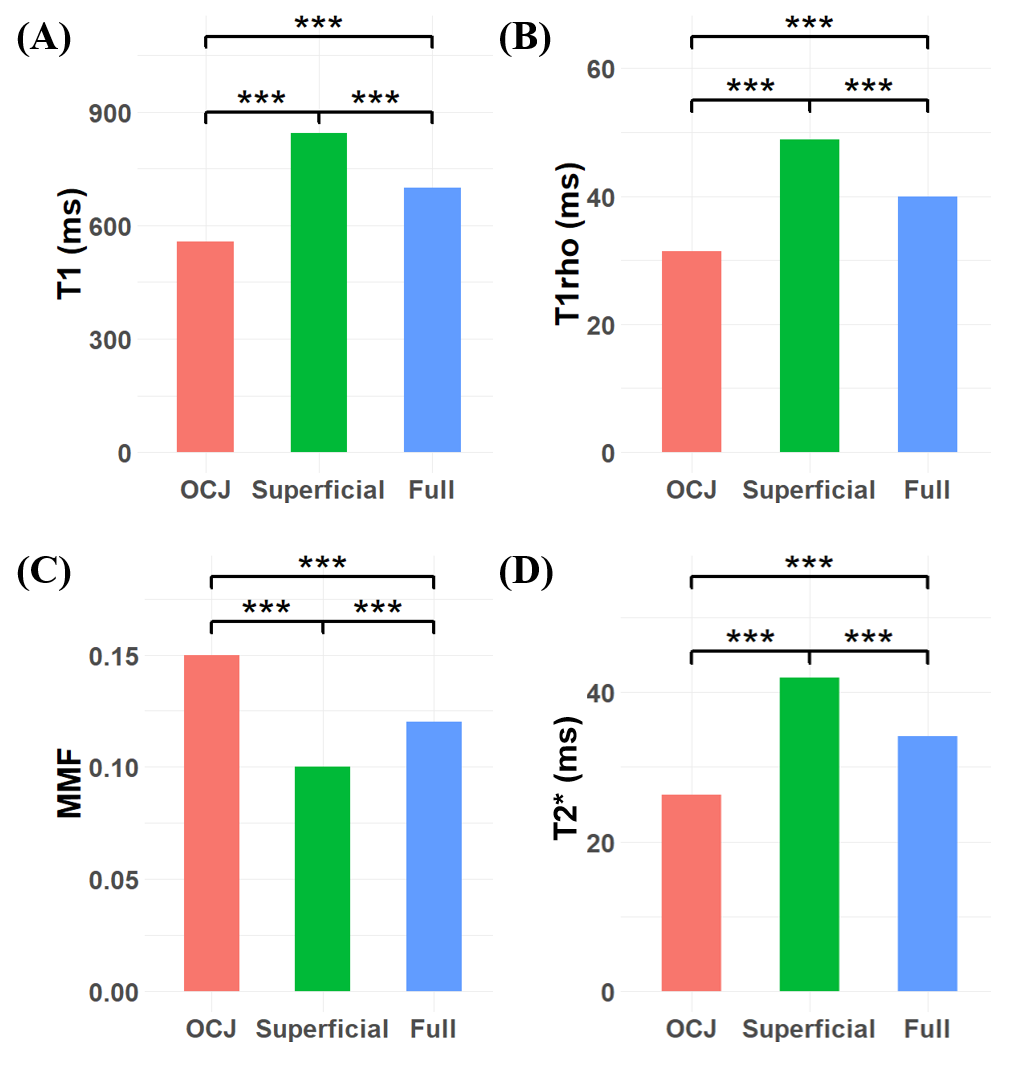
Figure 3. Bar plots of T1 (A), T1rho (B), MMF (C), and T2* (D) of the OCJ, superficial cartilage, and full thickness cartilage. All biomarkers show significant differences between each pair of compared cartilage regions (P < .001).
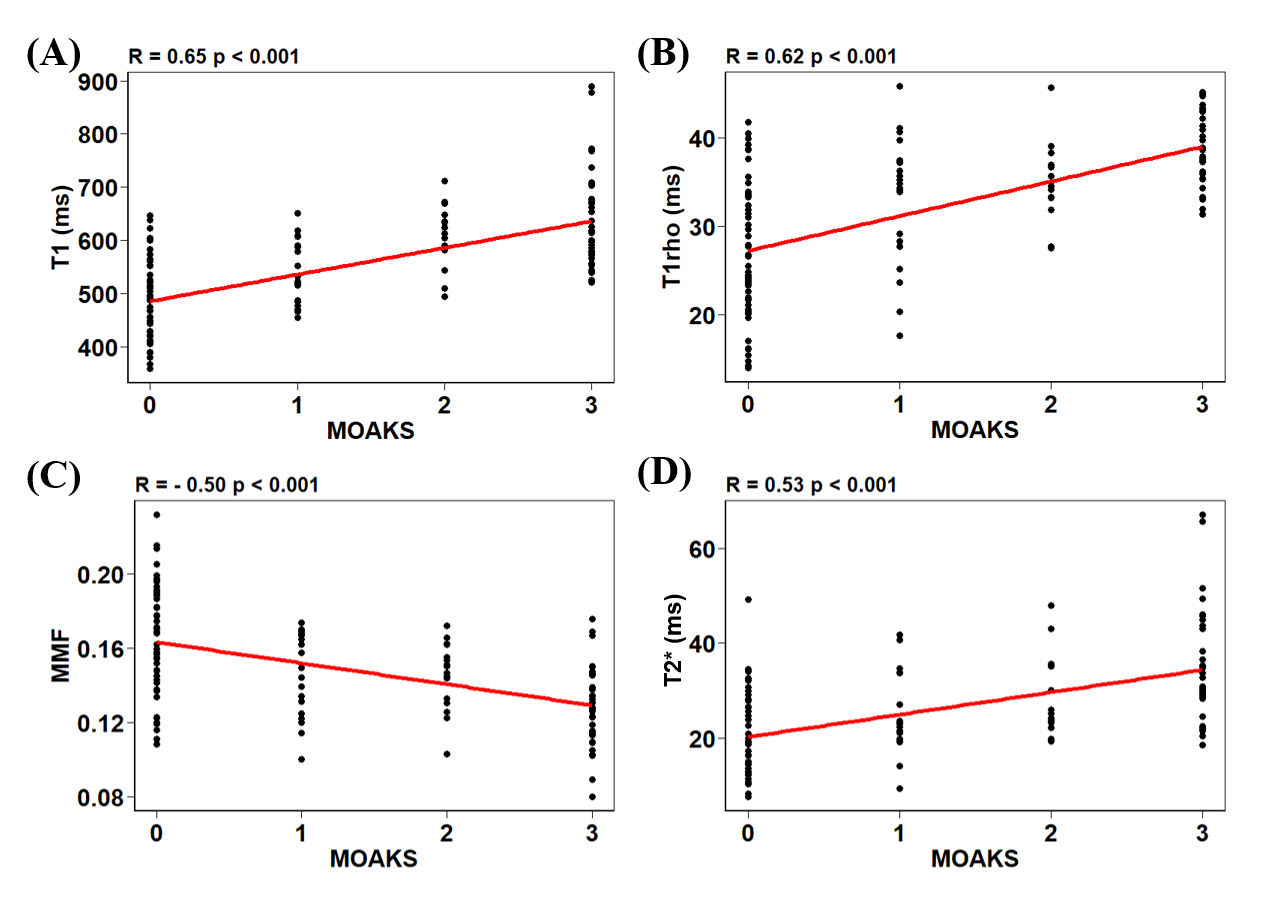
Figure 4. Scatterplots of T1 (A), T1rho (B), MMF (C), and T2* (D) according to the cartilage MOAKS. There is a significant negative correlation between T1, T1rho, and T2* relaxation times and MOAKS, and a significant positive correlation between MMF and MOAKS.
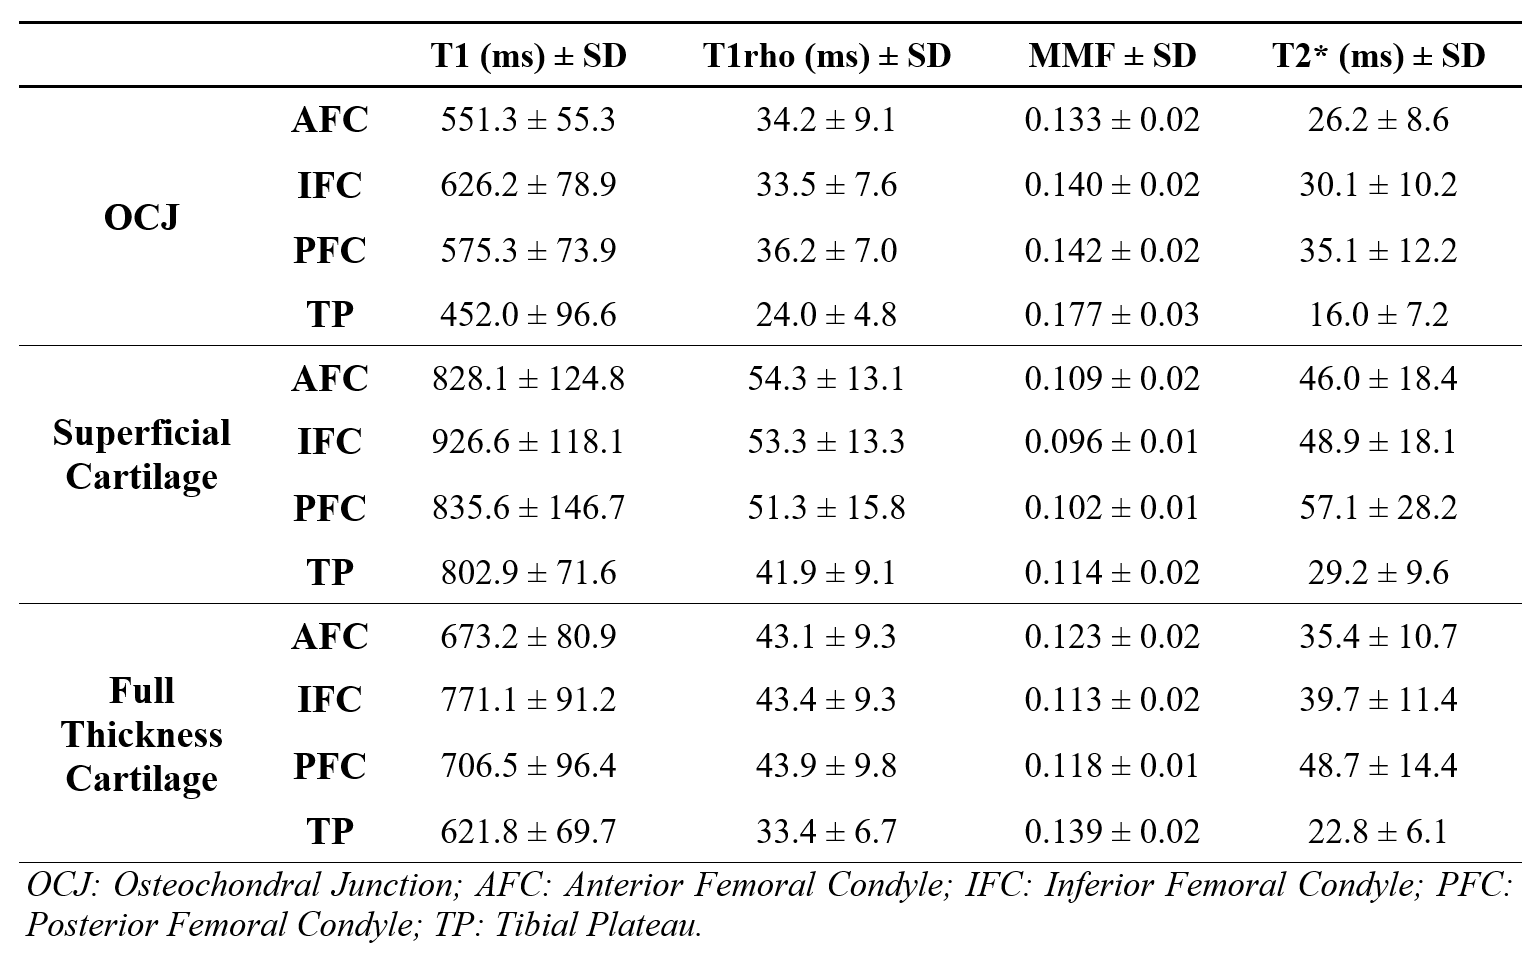
Table 1. Summary of T1, T1rho, MMF, and T2* measurements according to the knee cartilage layer and the region.