4937
Implementation of OxFlow MRI with concurrent EEG for tracking the cerebral metabolic rate of oxygen during extended-duration scans of sleep1University of Pennsylvania, Philadelphia, PA, United States, 2Kyungpook National University, Daegu, Korea, Republic of
Synopsis
OxFlow was used to track the global cerebral metabolic rate of oxygen (CMRO2) during wakefulness and sleep, with concurrent EEG, in eleven healthy subjects scanned continuously for 80 minutes. CMRO2 was derived from phase-contrast measurements of cerebral blood flow (CBF) in the neck with susceptometry-based oximetry measurements of venous oxygenation (SvO2) in the superior sagittal sinus (SSS). Results reveal that there is negligible bias between total CBF (tCBF), obtained by upscaling the value measured in the SSS, and CBF measured at the neck, suggesting that single-slice OxFlow can be implemented to simplify data acquisition and processing without sacrificing accuracy.
INTRODUCTION
The cerebral metabolic rate of oxygen (CMRO2) reports directly on the energy status of the brain, which relies almost exclusively on glucose oxidation to support ATP synthesis. CMRO2 is derived from measurable parameters, exploiting Fick’s Principle, CMRO2=Ca·CBF·(SaO2-SvO2), with Ca being oxygen carrying capacity of blood, CBF cerebral blood flow, and SaO2 and SvO2 representing arterial and venous blood oxygen saturations. Global CMRO2 at rest is remarkably stable, owing primarily to neurovascular coupling (1).Uncoupling between CBF and SvO2 occurs during slow-wave sleep (SWS) in healthy individuals (2,3), helping maintain synaptic homeostasis (4). Madsen et al. reported a 25% decrement in CMRO2 during SWS, but the technique was highly invasive and provided poor temporal resolution (2). Using a non-invasive, cost-effective, and temporally-resolved MRI technique known as OxFlow (3,5-10), Caporale et al. reported similar decrements, ranging 14–32%. Notably, MRI was performed with concurrent electroencephalography (EEG), providing simultaneous affirmation of sleep occurrence, indicated by a marked increase in δ-wave spectral power density (δ-SPD) (3).
This prior work potentially sacrificed CMRO2 accuracy by combining SvO2 and CBF quantification into a single-slice OxFlow experiment. OxFlow incorporates in a single scan (5) susceptibility-based oximetry (SBO) (11) and phase-contrast MRI, to derive, respectively, SvO2 in the superior sagittal sinus (SSS) and CBF in the internal carotid (ICAs) and vertebral arteries (VAs). Earlier OxFlow versions accomplished this by interleaving SBO at the SSS with phase-contrast in the neck arteries (5,6). Later, a calibration scan run prior to OxFlow provided the ratio of blood flow between the two measurement sites (BF-ratio), allowing single-slice measurement at the level of the SSS, which drains the cerebral cortex only, followed by upscaling of the measured blood flow, to approximate total CBF (tCBF) (8).
A fixed upscaling factor is a good approximation for short scans (8), but it has not been known whether the BF-ratio changes during states of reduced consciousness. Here, dual-band OxFlow (10), which simultaneously excites and acquires signals at both the neck and head levels without loss of temporal resolution, was used to measure the BF-ratio over 80 minutes for eleven healthy subjects, four of whom achieved EEG verified SWS. CMRO2 derived using upscaled CBF measured in the SSS was compared to that using tCBF measured in the neck arteries to test the validity of single-slice OxFlow.
METHODS
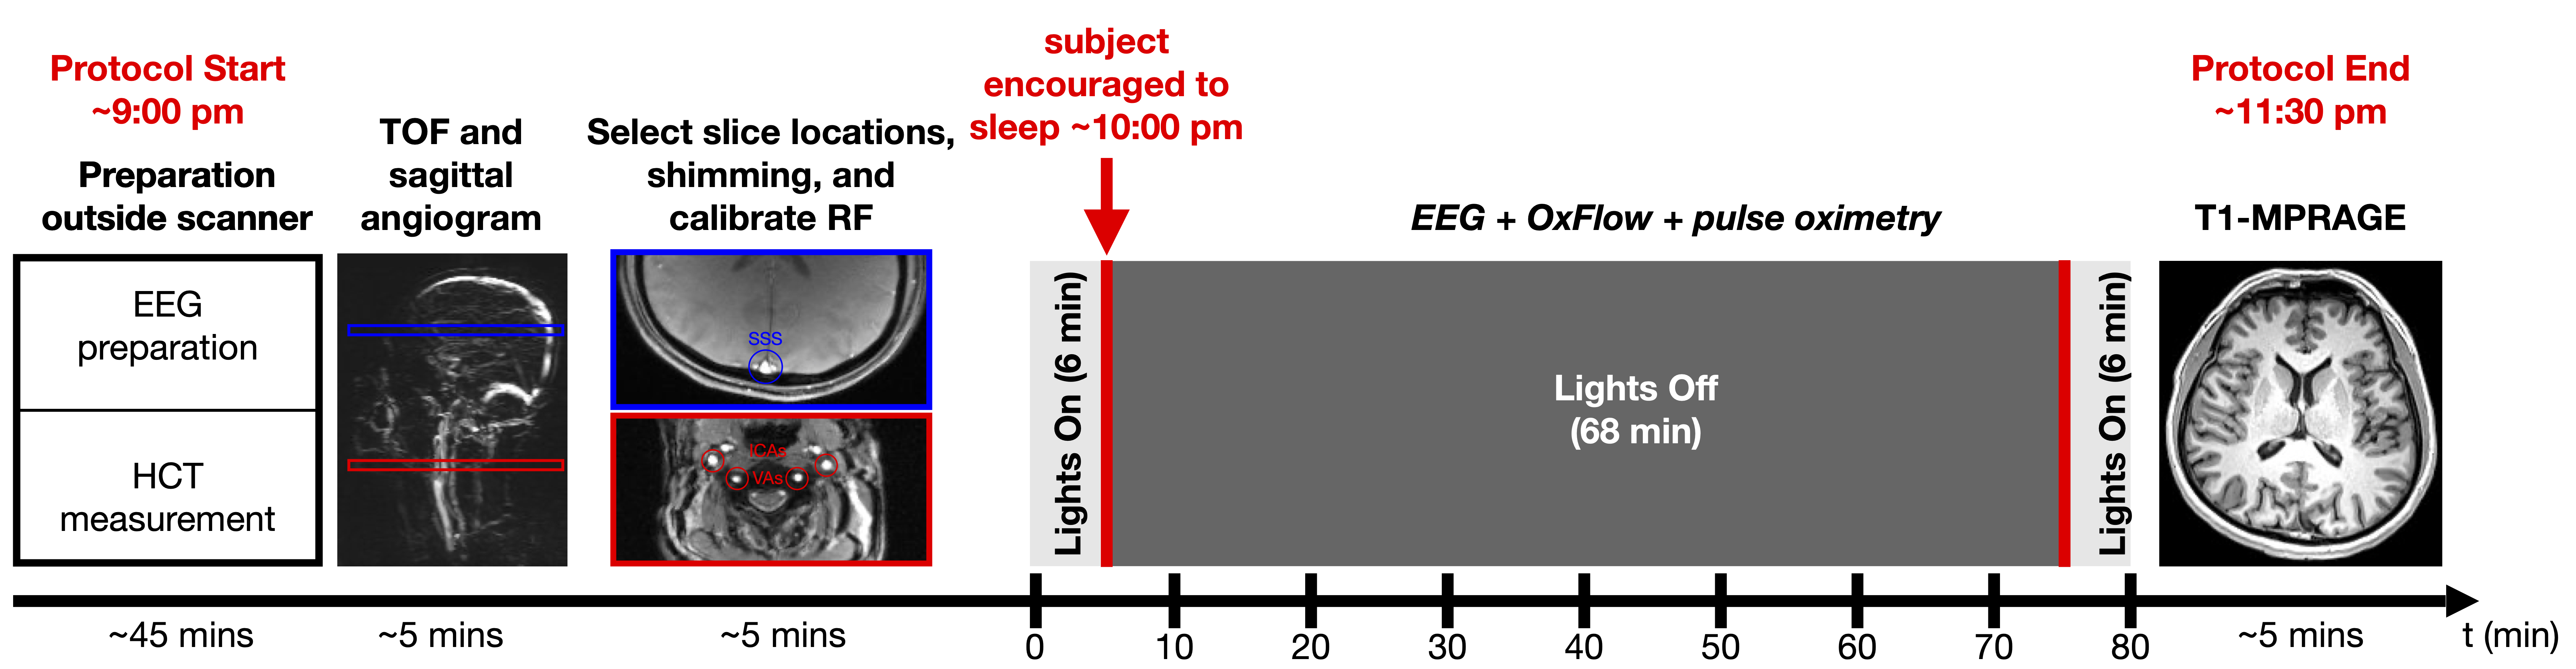
Study protocol & subjectsImaging was performed at 3 T Siemens Prisma using a 64-channel head-neck coil on 11 healthy volunteers reporting normal sleep habits (7 M, 20–40 years). The study protocol is illustrated in Figure 1.
OxFlow
Imaging parameters were as follows: voxel size=1x1x5 mm3, FOV=200x200 mm2, BW=312.5 Hz/pixel, TE1=9.170 ms, ΔTE=6.16 ms, TR=40 ms, flip angle (head/neck)=36/12° or 20/12°, VENC=80 cm/s, acquisition time to quantify global CMRO2=16 s, and number of frames=300. Total CBF was quantified, both directly in the neck arteries and approximated by upscaling the SSS blood flow, based on the BF-ratio obtained from the first 15 measurements. Field maps were used to quantify SvO2 in the SSS after correcting for background field inhomogeneity, as described (12). Image reconstruction (zero-padded matrix size=400x400), processing, and data analysis were performed with MATLAB (The MathWorks, Inc., Natick, MA, USA).
EEG
EEG was recorded continuously during OxFlow acquisition using a 15-channel MR-compatible sleep cap and a 32-channel amplifier (Brain Products GmbH, Gilching, Germany) and processed with Brain Vision Analyzer (Version 2.1, Brain Products, Gilching, Germany), as described (3). After Fourier processing, δ-SPD was extracted for electrodes O1 and O2 (13), and used to ascertain sleep status. δ-SPD is plotted either as absolute values or normalized to the entire EEG power spectrum, depending on which demonstrated stronger correlation with CMRO2.
RESULTS
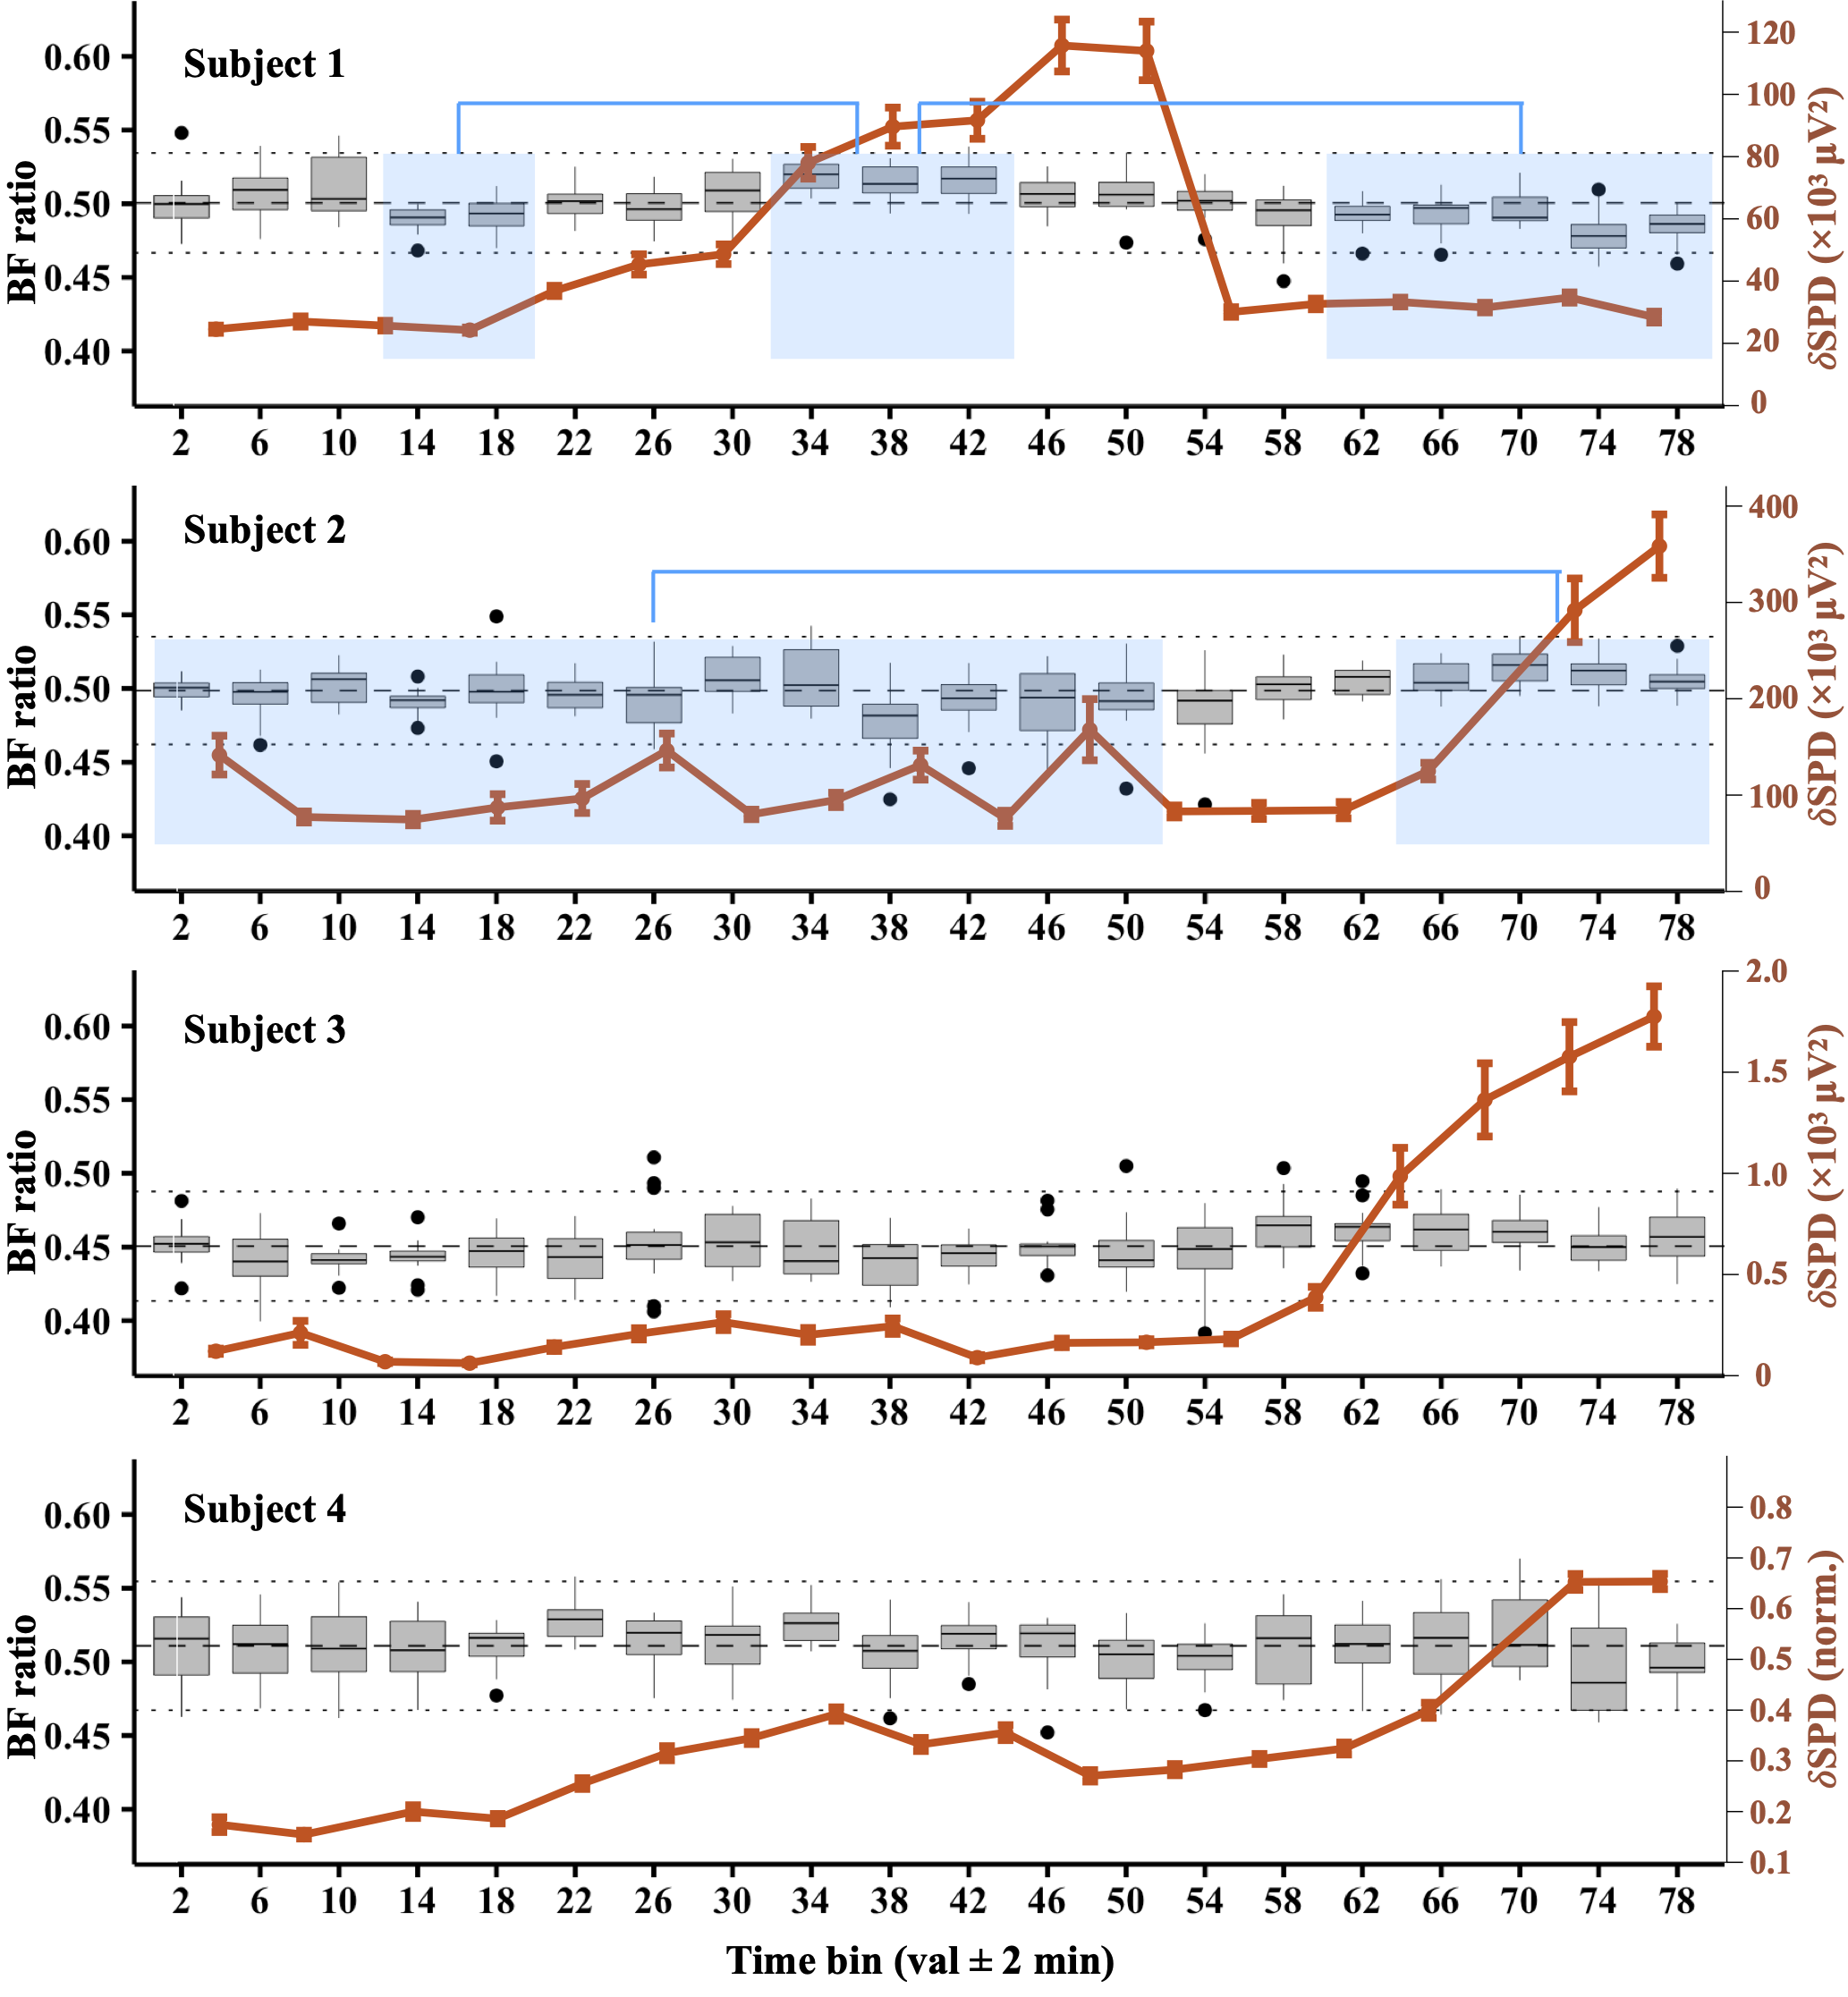
Four subjects achieved SWS, based on significant increases of δ-SPD. Subject 1 achieved SWS within ~30 minutes, then awoke ~30 minutes later. Subjects 2–4 required at least an hour to fall asleep, but did not spontaneously reawaken. Figure 2 shows a box plot time series of the BF-ratio, plotted for every four minutes of data. For subject 1, the BF-ratio showed a statistically significant increase during SWS, relative to the pre- and post-sleep wakefulness (P<0.05). Similarly, subject 2 exhibited a significant increase in BF-ratio during sleep compared to wakefulness (P<0.05). Subjects 3 and 4 showed variations, but no statistically significant differences in BF-ratio. Regardless, the BF-ratio differences (black bars) did not propagate into significant differences in time-averaged CMRO2 for any of the four subjects, shown in Figure 3, indicating that the BF-ratio fluctuations are within the uncertainty of this physiological measurement.DISCUSSION AND CONCLUSION
OxFlow provides time-resolved quantification of global CMRO2 by combining SvO2 measured in the SSS with tCBF measured in neck arteries (5). However, upscaled CBF measured in the SSS can approximate tCBF with high accuracy, thereby simplifying image acquisition, reconstruction, and data analysis, while allowing higher temporal resolution. Prior work demonstrated that the BF-ratio remains constant during short scans (8), but the stability over long scans involving changes in conscious state was not known. The present work indicates that while the BF-ratio fluctuates, differences have negligible effect on CMRO2, therefore allowing future studies of CMRO2 during sleep to be conducted by single-slice measurement at the SSS level.Acknowledgements
Research reported in this publication was supported by the National Center for Advancing Translational Sciences of the National Institutes of Health (NIH) under Award Number UL1TR001878.
Supported in part by the NIH under award number T32EB020087.
The content is solely the responsibility of the authors and does not necessarily represent the official views of the NIH.
Supported in part by the Institute for Translational Medicine and Therapeutics’ (ITMAT) Transdisciplinary Program in Translational Medicine and Therapeutics.
References
1. Girouard H, Iadecola C. Neurovascular coupling in the normal brain and in hypertension, stroke, and Alzheimer disease. Journal of Applied Physiology 2006;100:328–335.
2. Madsen PL, Schmidt Jf Fau - Wildschiødtz G, Wildschiødtz G Fau - Friberg L, Friberg L Fau - Holm S, Holm S Fau - Vorstrup S, Vorstrup S Fau - Lassen NA, Lassen NA. Cerebral O2 metabolism and cerebral blood flow in humans during deep and rapid-eye-movement sleep. Journal of Applied Physiology 1991;70:2597–2601.
3. Caporale AS, Lee H, Lei H, Rao H, Langham MC, Detre JA, Wu PH, Wehrli FW. Cerebral metabolic rate of oxygen during transition from wakefulness to sleep measured with high temporal resolution OxFlow MRI with concurrent EEG. Journal of Cerebral Blood Flow & Metabolism 2021;41(4):780–792.
4. Tononi G, Cirelli C. Sleep function and synaptic homeostasis. Sleep Medicine Reviews 2006;10:49–62.
5. Jain V, Langham MC, Wehrli FW. MRI Estimation of Global Brain Oxygen Consumption Rate. Journal of Cerebral Blood Flow & Metabolism 2010;30(9):1598-1607.
6. Barhoum S, Langham MC, Magland JF, Rodgers ZB, Li C, Rajapakse CS, Wehrli FW. Method for Rapid MRI Quantification of Global Cerebral Metabolic Rate of Oxygen. Journal of Cerebral Blood Flow & Metabolism 2015;35(10):1616-1622.
7. Cao W, Chang YV, Englund EK, Song HK, Barhoum S, Rodgers ZB, Langham MC, Wehrli FW. High-speed whole-brain oximetry by golden-angle radial MRI. Magnetic Resonance in Medicine 2018;79(1):217-223.
8. Rodgers ZB, Jain V, Englund EK, Langham MC, Wehrli FW. High Temporal Resolution MRI Quantification of Global Cerebral Metabolic Rate of Oxygen Consumption in Response to Apneic Challenge. Journal of Cerebral Blood Flow & Metabolism 2013;33(10):1514-1522.
9. Rodgers ZB, Leinwand SE, Keenan BT, Kini LG, Schwab RJ, Wehrli FW. Cerebral metabolic rate of oxygen in obstructive sleep apnea at rest and in response to breath-hold challenge. Journal of Cerebral Blood Flow & Metabolism 2016;36(4):755-767.
10. Lee H, Langham MC, Rodriguez-Soto AE, Wehrli FW. Multiplexed MRI methods for rapid estimation of global cerebral metabolic rate of oxygen consumption. 2017;149:393-403.
11. Fernández-Seara MA, Techawiboonwong A, Detre JA, Wehrli FW. MR susceptometry for measuring global brain oxygen extraction. Magnetic Resonance in Medicine 2006;55:967-973.
12. Langham MC, Magland JF, Floyd TF, Wehrli FW. Retrospective correction for induced magnetic field inhomogeneity in measurements of large-vessel hemoglobin oxygen saturation by MR susceptometry. Magnetic Resonance in Medicine 2009;61:626-633.
13. Susmáková K, Krakovská A. Discrimination ability of individual measures used in sleep stages classification. Artif Intell Med 2008;44(3):261-277.
14. Mugler JP, 3rd, Brookeman JR. Rapid three-dimensional T1-weighted MR imaging with the MP-RAGE sequence. J Magn Reson Imaging 1991;1(5):561-567.
Figures