4922
Test-Retest Reproducibility of Cerebrovascular Dual-venc 4D Flow MRI1Radiology, Northwestern University, Chicago, IL, United States, 2Neurology, Northwestern University, Chicago, IL, United States, 3Institute of Physics, University of Greifswald, Greifswald, Germany
Synopsis
Cerebrovascular dual-venc 4D Flow MRI has utility in evaluating intracranial hemodynamics - benefitting from full circle of Willis (CoW) volumetric coverage, time-resolved, three-directional velocity encoding, and velocity dynamic range. Analysis of hemodynamic measures was completed using a comprehensive, semi-automated vessel identification and segmentation workflow for 10 subjects who underwent two scans within 30 days. Test-retest analysis of cerebrovascular dual-venc 4D Flow MRI and measures of CoW 3D flow dynamics demonstrated excellent repeatability for flow and peak velocity measures and lower reproducibility for pulsatility and resistive indices. Future work may include a larger cohort or more advanced analysis of velocity-derived parameters.
Background
Existing methods for quantifying intracranial hemodynamics include digital subtraction angiography, transcranial Doppler ultrasonography, and 2D phase-contrast MR imaging. These methods are limited by: invasive, qualitative analysis, operator variability and anatomical coverage of insonation windows, and manual placement of 2D planes with one-directional velocity encoding, respectively.Dual-venc 4D Flow MRI has been developed to comprehensively assess hemodynamic metrics by facilitating full volumetric coverage and time resolved, three-directional velocity encoding. This sequence enables measurement of intracranial hemodynamics in the circle of Willis (CoW) with a wider velocity dynamic range than existing MRI methods1,2.
Establishing reproducibility in the dual-venc 4D Flow MRI sequence is critical for evaluating future clinical utility in evaluating cerebrovascular pathologies such as aneurysms, arteriovenous malformations, and intracranial atherosclerotic disease. Flow and velocity measures have been shown to have utility in evaluating these pathologies2-4. Additionally, Pulsatility Index (PI) and Resistive Index (RI) are measures related to arterial wall condition5,6. The aim of this study was to evaluate test-retest reproducibility of dual-venc 4D Flow MRI hemodynamic measures in healthy adult control subjects.
Methods
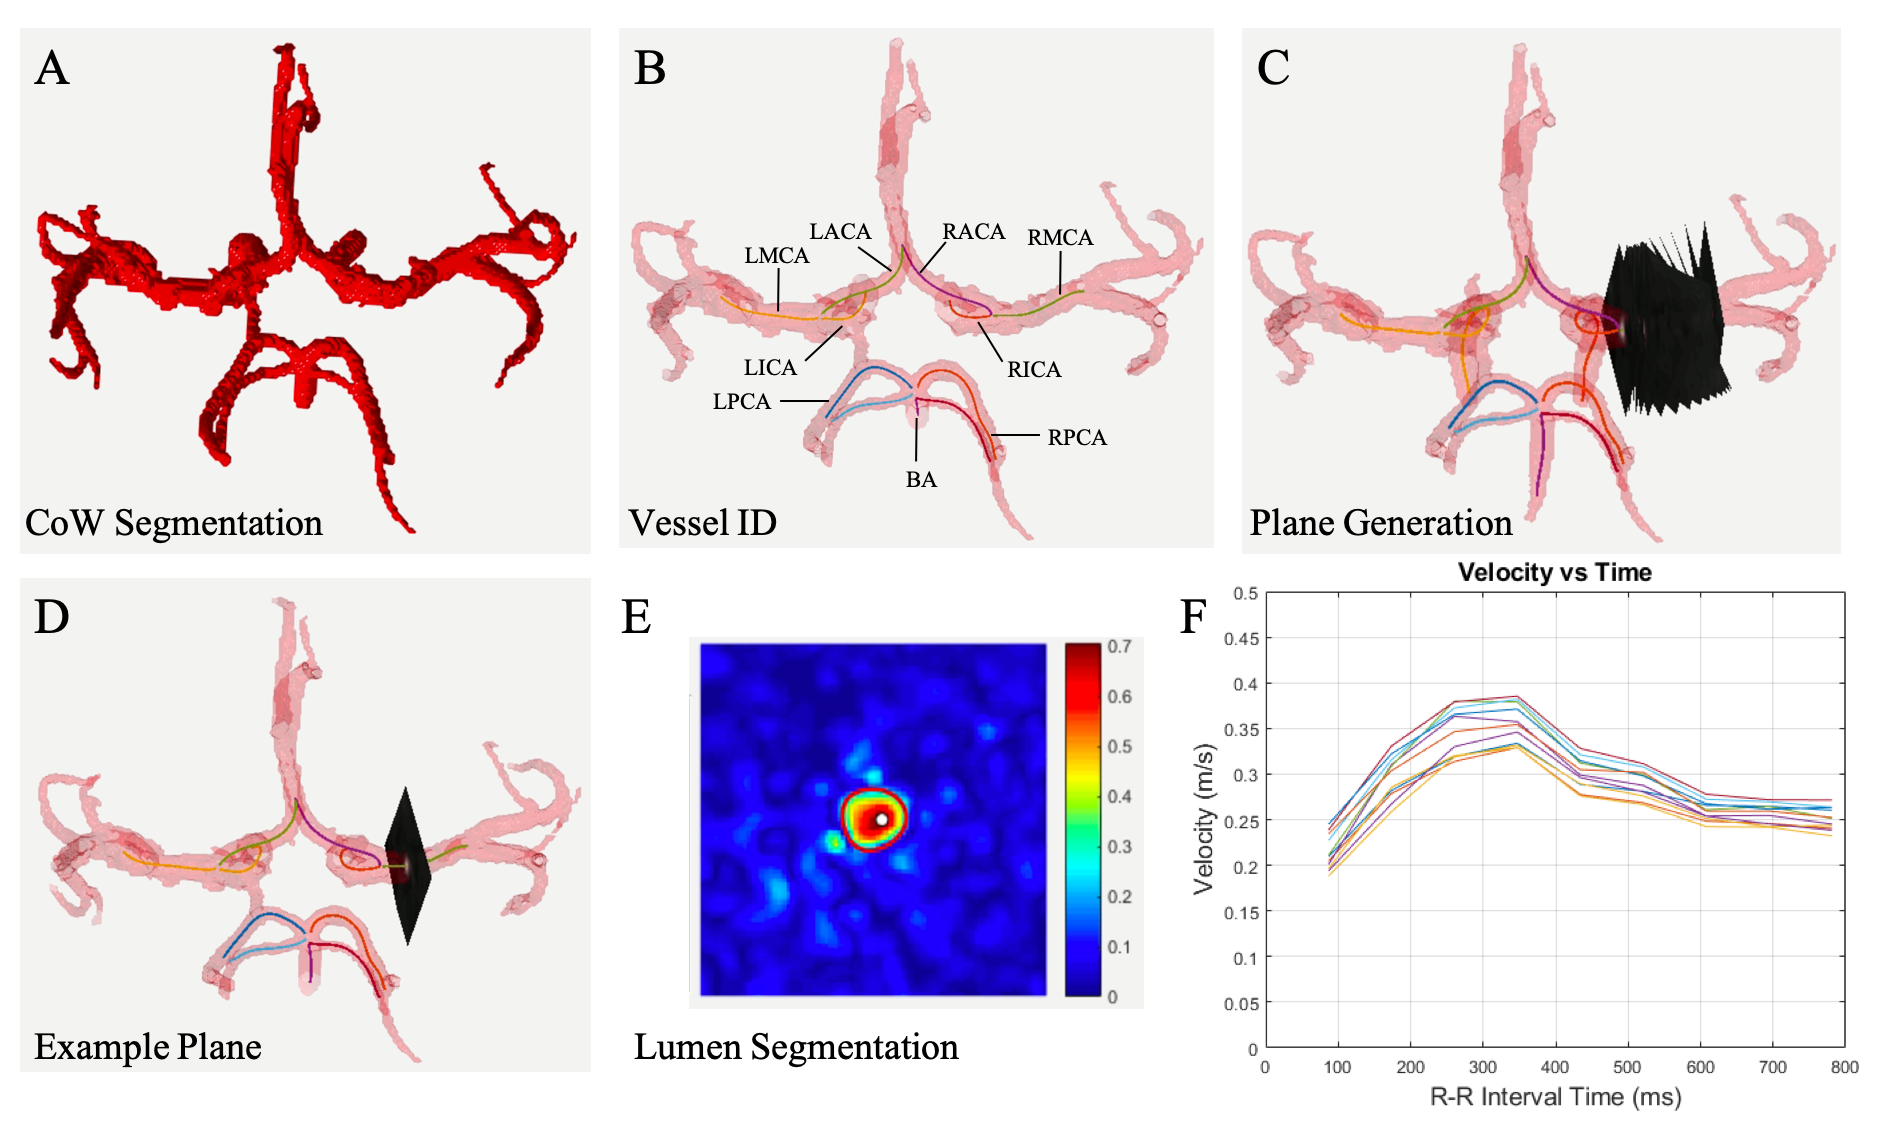
Study Cohort: 14 subjects were prospectively recruited for this IRB approved study. Four were excluded due to incidental findings, data quality, or failure to return. The 10 remaining healthy subjects (26.2 ± 4.9 years, 6 female) included for analysis had no known history of cerebrovascular disease. All subjects underwent two brain MRI exams (3T MAGNETOM Prisma, Siemens, Erlangen, Germany, 2nd scan within 30 days). The protocol included dual-venc 4D Flow MRI (TR = 5.9 ms, TE = 3.3 ms, flip angle=15°, low venc = 80 cm/s, high venc = 160 cm/s, voxel size = 1 mm isotropic, temporal resolution 82.6 ms, k-t PEAK-GRAPPA7 acceleration factor of R = 5).4D Flow MRI data analysis was completed as described in previous work6 including error corrections for Maxwell fields, eddy currents, noise, and velocity anti-aliasing during reconstruction or using an in-house software tool8. This tool generates phase contrast MR Angiography (PCMRA) data from the 4D Flow MRI data using pseudo-complex differences. PCMRAs are used for CoW segmentation (Fig 1A) to systematically extract hemodynamic parameters. Vessels were identified using a centerline approach (Fig 1B), and hemodynamic information was evaluated via analysis planes placed every 1 mm along vessel length (Fig 1C). Vessel lumens were segmented using these planes and a region of interest (ROI) (Fig 1D) to extract flowrate and velocity data for each plane over all timepoints1,6,9,10.
Planes including outliers were removed using a median filter with a sliding window of 3 time points and threshold of 1.5𝜎 from window median. Prospectively acquired velocity-time and flow-time curves were interpolated to complete the RR interval and estimate behavior at diastole.
Intracranial parameters:
For each analysis plane, the interpolated flowrate curves were integrated to calculate total flow (mL / cardiac cycle). Flow per cycle was normalized to incoming intracranial flow using Total Cerebral Blood Flow (TCBF) to account for variations in age, sex, body habitus, blood pressure, and heart rate.
$$TCBF = \sum( Q_{LICA} + Q_{RICA} + Q_{BA})$$
$$Flow = \sum \frac{Flow_{Vessel} \frac{mL}{Cycle}}{TCBF \frac{mL}{Cycle}}$$
PI and RI were calculated at each plane using the difference between peak velocity (PV) and minimum diastolic velocity divided by mean velocity or PV, respectively. The median value of the normalized flow, PV, PI, and RI over all planes represented an individual vessel. Bland-Altman (B-A) analysis and intraclass correlation (ICC) were used to evaluate reproducibility between scans.
Results
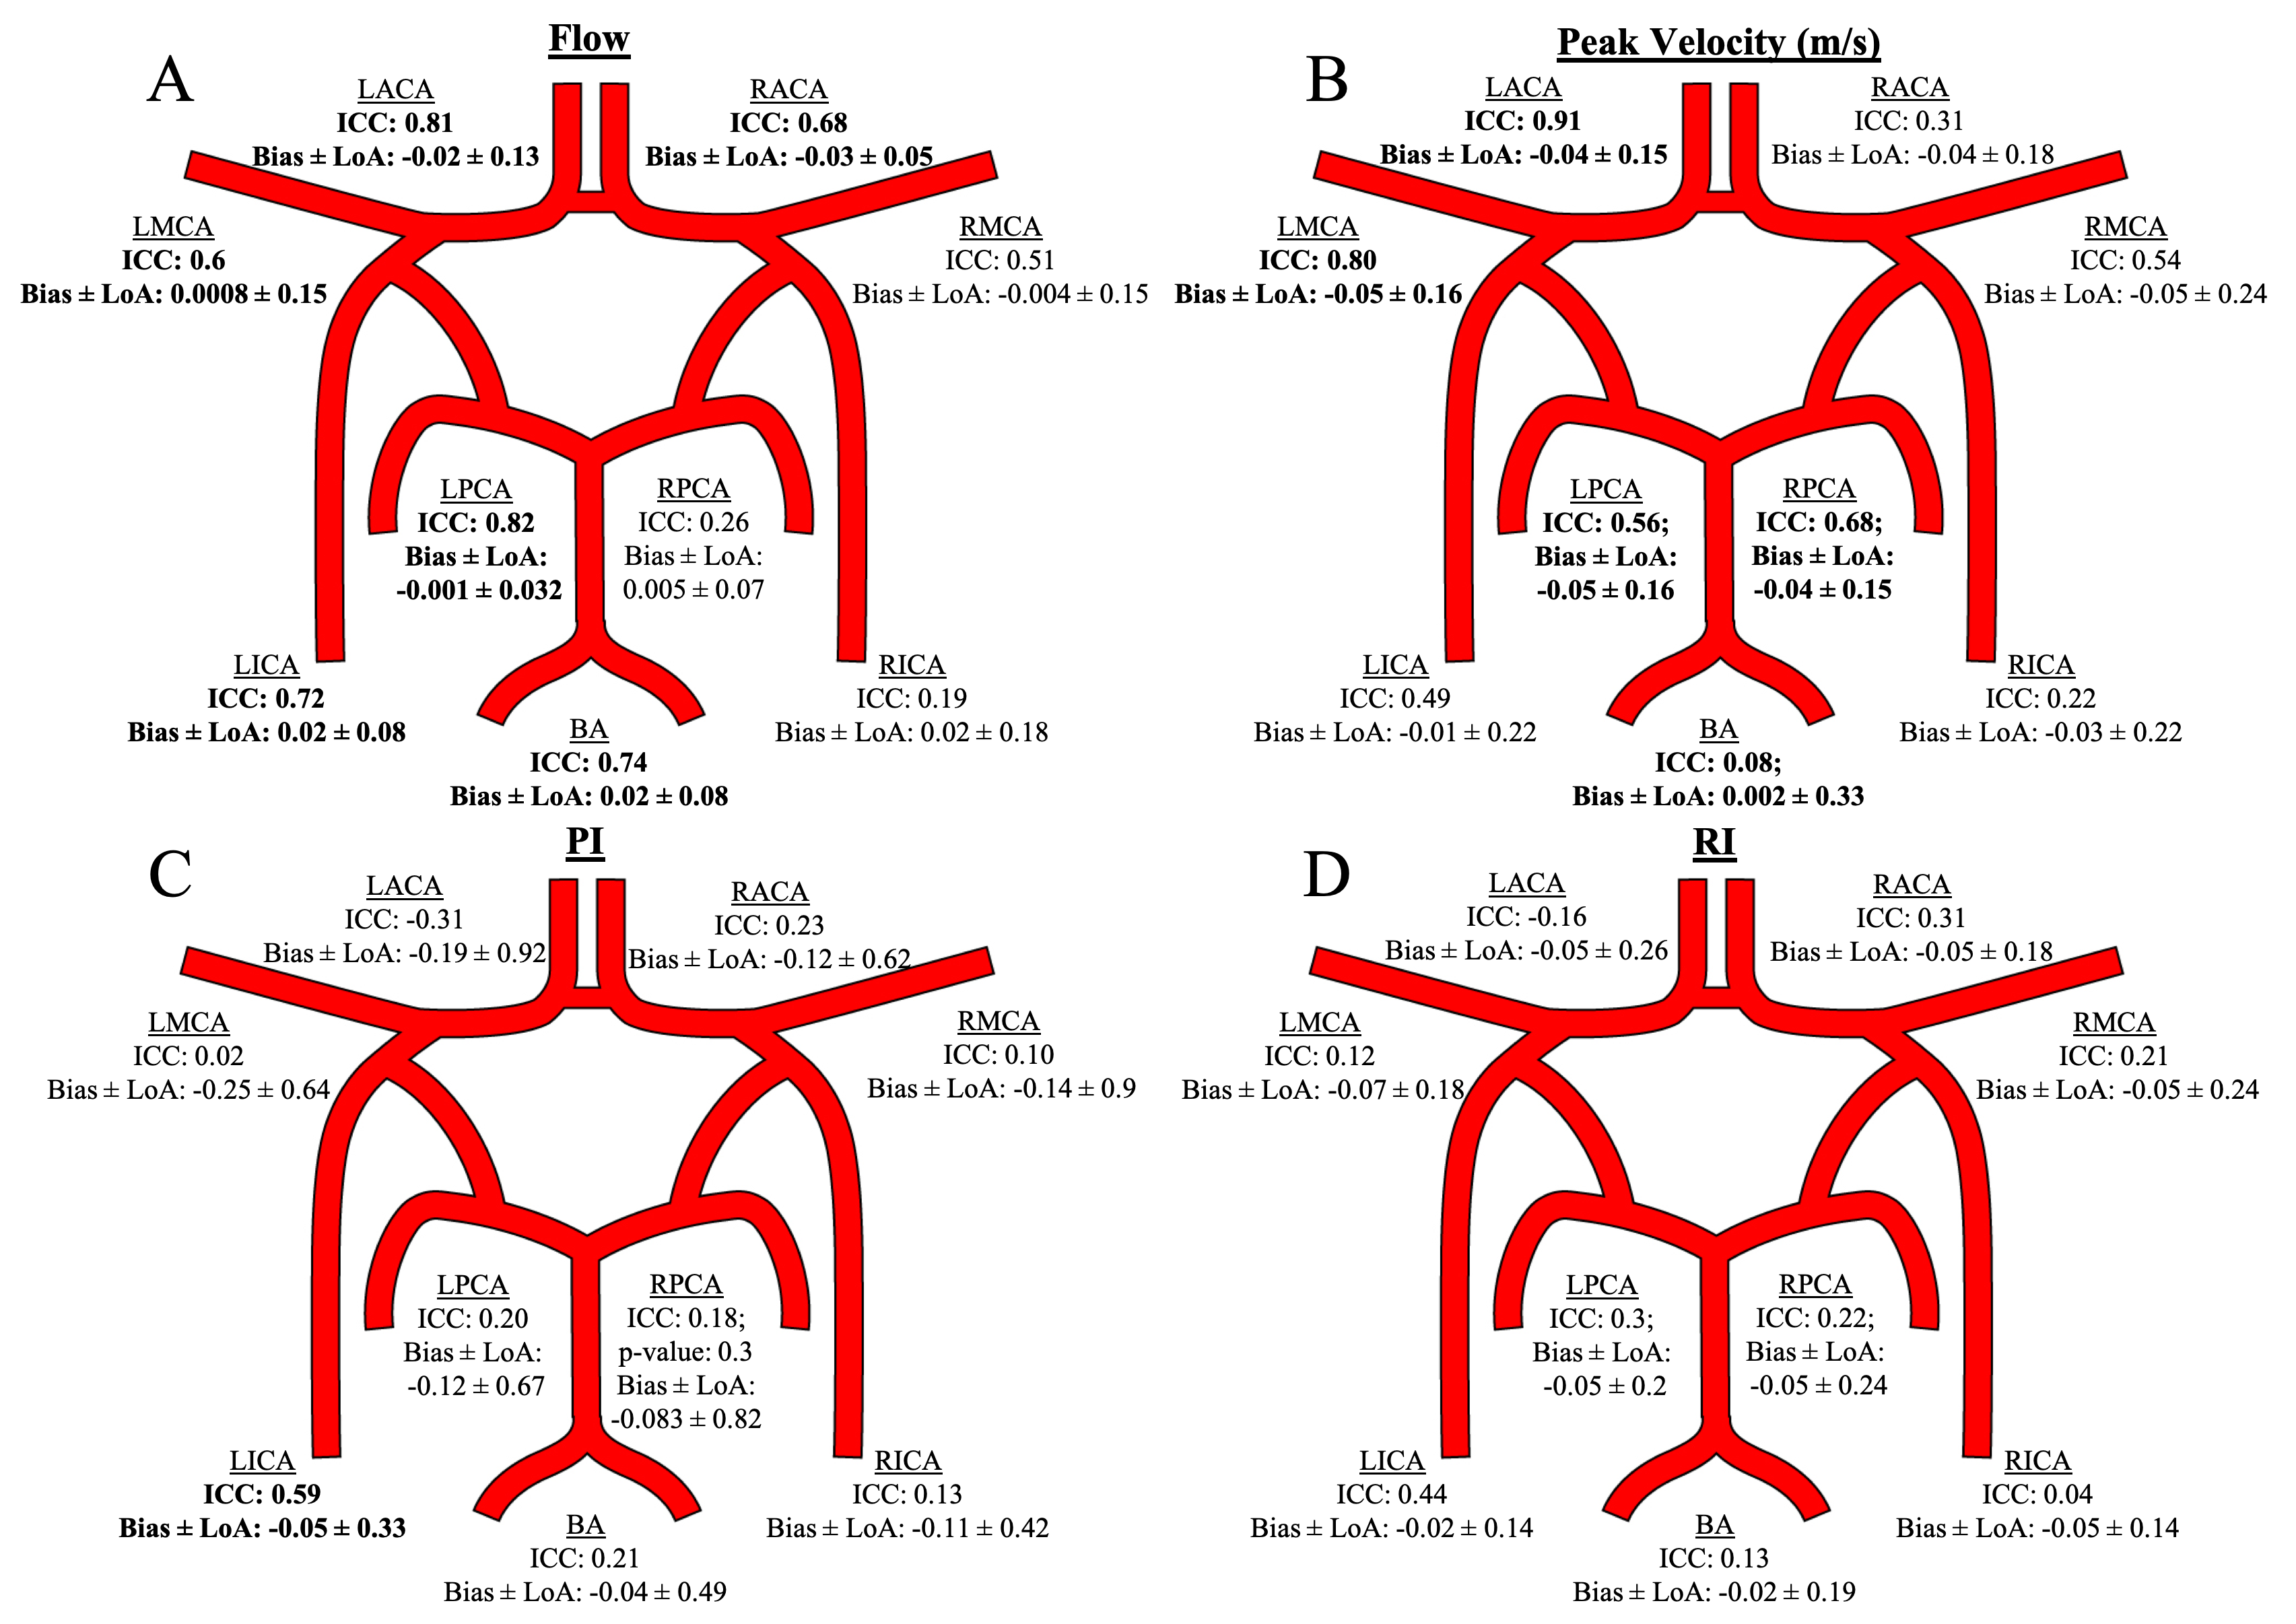
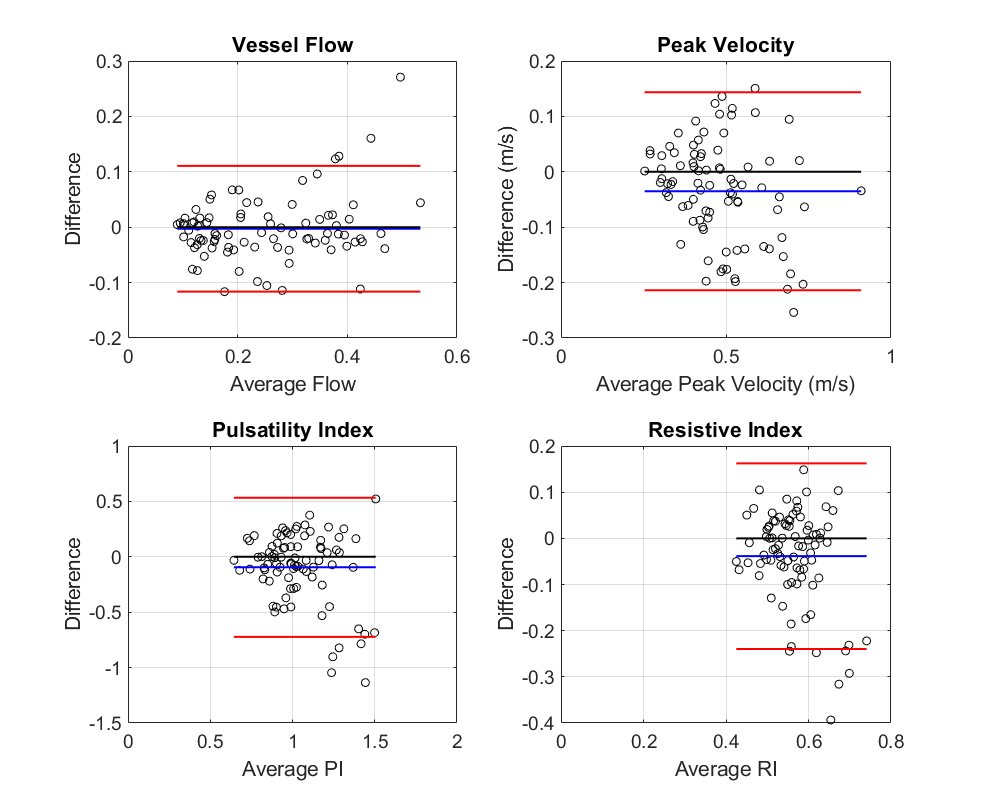
The primary reproducibility analysis involved aggregation of all paired vessels between scans. Flow measure B-A analysis showed bias and +/- limits of agreement (LoA) of -0.0028 +/- 0.11. ICC = 0.89, p < 0.001. The PV measures showed bias and +/- LoA of -0.035 +/- 0.18 m/s. ICC = 0.78, p < 0.001. The PI showed a bias and +/- LoA of -0.18 +/- 0.66. ICC = 0.36, p < 0.001. The RI results showed a bias and +/- LoA of -0.037 +/- 0.20. ICC = 0.21, p = 0.02. One scan in the dataset is a significant outlier with velocity measures 1.5 times greater than the other 19 scans. Upon removal, ICC values change to: 0.88, 0.81, 0.51, and 0.38, respectively. Individual vessels were also tested for reproducibility (Fig 3). The vessel analysis confirms the trend, where flow shows the best repeatability followed by peak velocity, PI, and RI.Conclusions
The flow and PV evaluation using dual-venc 4D Flow MRI showed excellent test-retest agreement due to low biases, LoA, and high ICC (ICC>0.75). PV had greater LoA - possibly due to noise. The vessel analysis showed moderate to excellent reliability for the majority of vessels. These results confirm the future utility of directly acquired hemodynamic data using dual-venc 4D Flow MRI.As anticipated, the calculated PI and RI metrics depending on multiple velocity data points showed greater variance and somewhat lower reproducibility in this small sample and will be investigated further in a larger study. Upon outlier removal, PI shows moderate reproducibility. Vessel analysis showed repeatability for the LICA for PI with good agreement and no vessels for RI. Alternatively, a different method using 4D Flow data, such as an advanced shape analysis, could be used for improving PI and RI estimation.
Acknowledgements
This work was funded by the National Institute of Health (NIH 1R01HL149787, NIH 1R21NS122511).References
1. Aristova M, Vali A, Ansari SA, et al. Standardized Evaluation of Cerebral Arteriovenous Malformations Using Flow Distribution Network Graphs and Dual-venc 4D Flow MRI. J Magn Reson Imaging. 2019;50(6):1718-1730. doi:10.1002/jmri.26784
2. Youn SW, Lee J. From 2D to 4D Phase-Contrast MRI in the Neurovascular System: Will It Be a Quantum Jump or a Fancy Decoration? J Magn Reson Imaging. 2020:1-26. doi:10.1002/jmri.27430
3. Schnell S, Wu C, Ansari SA. Four-dimensional MRI flow examinations in cerebral and extracerebral vessels - Ready for clinical routine? Curr Opin Neurol. 2016;29(4):419-428. doi:10.1097/WCO.0000000000000341
4. Wu C, Schnell S, Vakil P, et al. In vivo assessment of the impact of regional intracranial atherosclerotic lesions on brain arterial 3D hemodynamics. Am J Neuroradiol. 2017;38(3):515-522. doi:10.3174/ajnr.A5051
5. van Tuijl RJ, Ruigrok YM, Velthuis BK, van der Schaaf IC, Rinkel GJE, Zwanenburg JJM. Velocity pulsatility and arterial distensibility along the internal carotid artery. J Am Heart Assoc. 2020;9(16). doi:10.1161/JAHA.120.016883
6. Moore J, Aristova M, Abdalla R, et al. Cerebrovascular dual-venc 4D Flow MRI: Assessment of arterial pulsatility and resistance measures in intracranial atherosclerotic disease. ISMRM 2021.
7. Jung B, Ullmann P, Honal M, Bauer S, Hennig J, Markl M. Parallel MRI with extended and averaged GRAPPA kernels (PEAK-GRAPPA): Optimized spatiotemporal dynamic imaging. J Magn Reson Imaging. 2008;28(5):1226-1232. doi:10.1002/jmri.21561
8. Bock J, Kreher BW, Hennig J, Markl M. Optimized pre-processing of time-resolved 2D and 3D Phase Contrast MRI data. Proc Intl Soc Mag Reson Med. 2007;15:3138.
9. Vali A, Aristova M, Vakil P, et al. Semi-automated analysis of 4D flow MRI to assess the hemodynamic impact of intracranial atherosclerotic disease. Magn Reson Med. 2019;82(2):749-762. doi:10.1002/mrm.27747
10. Schrauben E, Ambarki K, Spaak E, Malm J, Wieben O, Eklund A. Fast 4D flow MRI intracranial segmentation and quantification in tortuous arteries. J Magn Reson Imaging. 2015;42(5):1458-1464. doi:10.1002/jmri.24900
Figures