4911
Open source MATLAB code for the generation of digital reference objects for DCE-MRI analysis software validation1Radiology, University of Cambridge, Cambridge, United Kingdom
Synopsis
Extending work by the QIBA initiative and others, a method is presented here for the generation of configurable digital reference objects (DROs) for the validation of dynamic-contrast enhanced (DCE-) MRI analysis software packages. Five commonly used kinetic models are supported and two software analysis packages were independently tested, one open source and one commercial. A sample set of DROs yielded excellent concordance with ‘ground-truth’ when analyzed with each package, indicating the software’s correctness and providing a benchmark for testing newly written software. Our MATLAB code is provided on an open-source basis to help researchers evaluate and test DCE-MRI analysis software.
Introduction
The analysis of dynamic contrast-enhanced MR imaging (DCE-MRI) data using kinetic modelling techniques involves much complexity, variability, and lack of standardization. This has held back translation of DCE-MRI from a research technique into successful application in the clinic. In particular, the performance of DCE-MRI analysis software can be responsible for differences in output kinetic model parameters of up to 74 % (within subject coefficient of variation) when presented with identical input data 1. The availability of suitable input reference data is paramount to the testing and validation of such software packages. To this end, the QIBA initiative has made available a set of digital reference objects (DROs) which simulate in silico DCE-MRI input data with known kinetic model parameter output 2. The work presented here is separate from QIBA but extends the functionality of the QIBA QC phantoms to kinetic models not previously considered, and offers an open source code-base for the construction of bespoke DROs.Methods
Code was developed in MATLAB (Natick, MA) with the following characteristics.An input domain of kinetic model index values is specified in a comma-separated variable (CSV) spreadsheet format along with parameters specifying the layout and composition of the resulting DRO. The AIF to be used in the DRO generation is specified as ‘blood-concentration’, time-value pairs in a CSV file. For each voxel in the DRO, the kinetic model under investigation is applied in the ‘forwards direction’ using the associated known kinetic model indices and the given AIF. A contrast-agent concentration-time curve (CACT) is output from this process, one for each voxel in the tissue to be simulated. The CACTs are then converted into MR signal-time curves by reverse application of the standard relaxivity and SPGR equations as implemented by Schabel & Parker 3. A synthetic 4-D dynamic DICOM image set is exported with grey-level evolution in time at each voxel as specified by the signal-time curve. A synthetic native T1 map is also generated for the tissue volume along with a set of synthetic variable flip-angle images that can be used for generation of this T1 map image. Finally, a synthetic associated B1 map, used in calculating the voxel flip-angles for the dynamic series and T1 maps, is also written as DICOM output.
Currently supported kinetic models include the Tofts 4,5, extended Tofts (eTM) 6, tissue uptake 8, Patlak 7, and two-compartment exchange models 8 (as implemented by Barnes et al 9). The modular structure of our software allows easy further customisation to other kinetic models that can be expressed in the form of a residue function.
Sample DROs were generated for these five kinetic models, using the AIF specified in the original QIBA v4 eTM DRO 2, and were tested in two software analysis packages, the open-source ROCKETSHIP 9 and, where applicable, MIStar (Apollo MIT, Melbourne, Australia). The resulting output in the form of kinetic model parameter maps was checked for concordance with maps constructed from the known input values.
Results
We make available our MATLAB source code under a GNU General Public License at the following URL [https://github.com/agcam/dce-dro-matlab], acknowledging use of kinetic model implementation details from the ROCKETSHIP code-base 9.The essential features of a sample generated DRO are shown in Fig. 1. Concordance plots (against ‘ground truth’ values) for kinetic model results generated by ROCKETSHIP and MIStar are shown for a selection of models in Fig. 2. A table summarising the concordance correlation coefficient values 10 (CCC, with associated confidence intervals) for the DROs generated and tested is displayed in Fig. 3.
Discussion
The measured CCC values for all model parameters analysed in both packages were all greater than 98% indicating excellent agreement with ‘ground truth’. This not only indicates the correctness of both analysis packages but also provides a benchmark for the further testing of other analysis software. In the cases of non-agreement with ground-truth (most evident in the 4-parameter 2CXM model), further investigation showed that the finding of a local minimum in optimisation in the analysis package was the cause of failure in the voxels tested.There is an element of circularity to the DRO generation algorithm in that the kinetic models used in their construction are also used in the DCE-MRI analysis packages themselves. In particular, our implementation of the kinetic model algorithms code followed closely the ROCKETSHIP implementation and, as such, might be expected to yield good validation results when analysed by ROCKETSHIP. This circularity argument is not relevant in the case of the commercial MIStar software where exact details of the kinetic model implementation are ‘black-box’ and hence unknown.
Conclusion
We have presented here a partially validated tool for quality control and evaluation of DCE-MRI kinetic model software analysis packages. Our code to generate DROs is developed in a widely known format (MATLAB) and is easily generalizable and customizable. We have made our code available on an open source basis to assist researchers with quality control and standardization of DCE-MRI analysis software.Acknowledgements
We thank Qing Yang at Apollo MIT (Melbourne, Australia) for help with MIStar. This work was supported by Cancer Research UK, the National Institute for Health Research (NIHR) Cambridge Biomedical Research Centre, and Cambridge University Hospitals NHS Foundation Trust.
References
1. Heye, T., et al., Reproducibility of dynamic contrast-enhanced MR imaging. Part I. Perfusion characteristics in the female pelvis by using multiple computer-aided diagnosis perfusion analysis solutions. Radiology, 2013. 266(3): p. 801-11.
2. QIBA digital reference objects: Barboriak Lab., Duke University. [cited 2021 17 Sep]; Available from: https://sites.duke.edu/dblab/qibacontent/.
3. Schabel, M.C. and D.L. Parker, Uncertainty and bias in contrast concentration measurements using spoiled gradient echo pulse sequences. Phys Med Biol, 2008. 53(9): p. 2345-73.
4. Tofts, P.S. and A.G. Kermode, Measurement of the blood-brain barrier permeability and leakage space using dynamic MR imaging. 1. Fundamental concepts. Magn Reson Med, 1991. 17(2): p. 357-67.
5. Tofts, P.S., Modeling tracer kinetics in dynamic Gd-DTPA MR imaging. J Magn Reson Imaging, 1997. 7(1): p. 91-101.
6. Tofts, P.S., et al., Estimating kinetic parameters from dynamic contrast-enhanced T(1)-weighted MRI of a diffusable tracer: standardized quantities and symbols. J Magn Reson Imaging, 1999. 10(3): p. 223-32.
7. Patlak, C.S. and R.G. Blasberg, Graphical evaluation of blood-to-brain transfer constants from multiple-time uptake data. Generalizations. J Cereb Blood Flow Metab, 1985. 5(4): p. 584-90.
8. Sourbron, S., et al., Quantification of cerebral blood flow, cerebral blood volume, and blood-brain-barrier leakage with DCE-MRI. Magn Reson Med, 2009. 62(1): p. 205-17.
9. Barnes, S.R., et al., ROCKETSHIP: a flexible and modular software tool for the planning, processing and analysis of dynamic MRI studies. BMC Med Imaging, 2015. 15: p. 19.
10. Lin, L.I., A concordance correlation coefficient to evaluate reproducibility. Biometrics, 1989. 45(1): p. 255-68.
Figures

Figure 1. a. Input kinetic model parameter values are entered via a comma-separated variable (CSV) spreadsheet along with B1 and T1 map values for each DRO voxel block; input parameter maps are output in DICOM format. b. T1 (and R1) maps are generated along with multiple flip angle images that can be used to generate the T1 maps; if required, B1 maps are also output. c. the AIF is input from a CSV spreadsheet. d. signal intensity time curves are calculated for the model in question; finally, a digital reference object is output consisting of a 4-D DICOM image set evolving in the time domain.
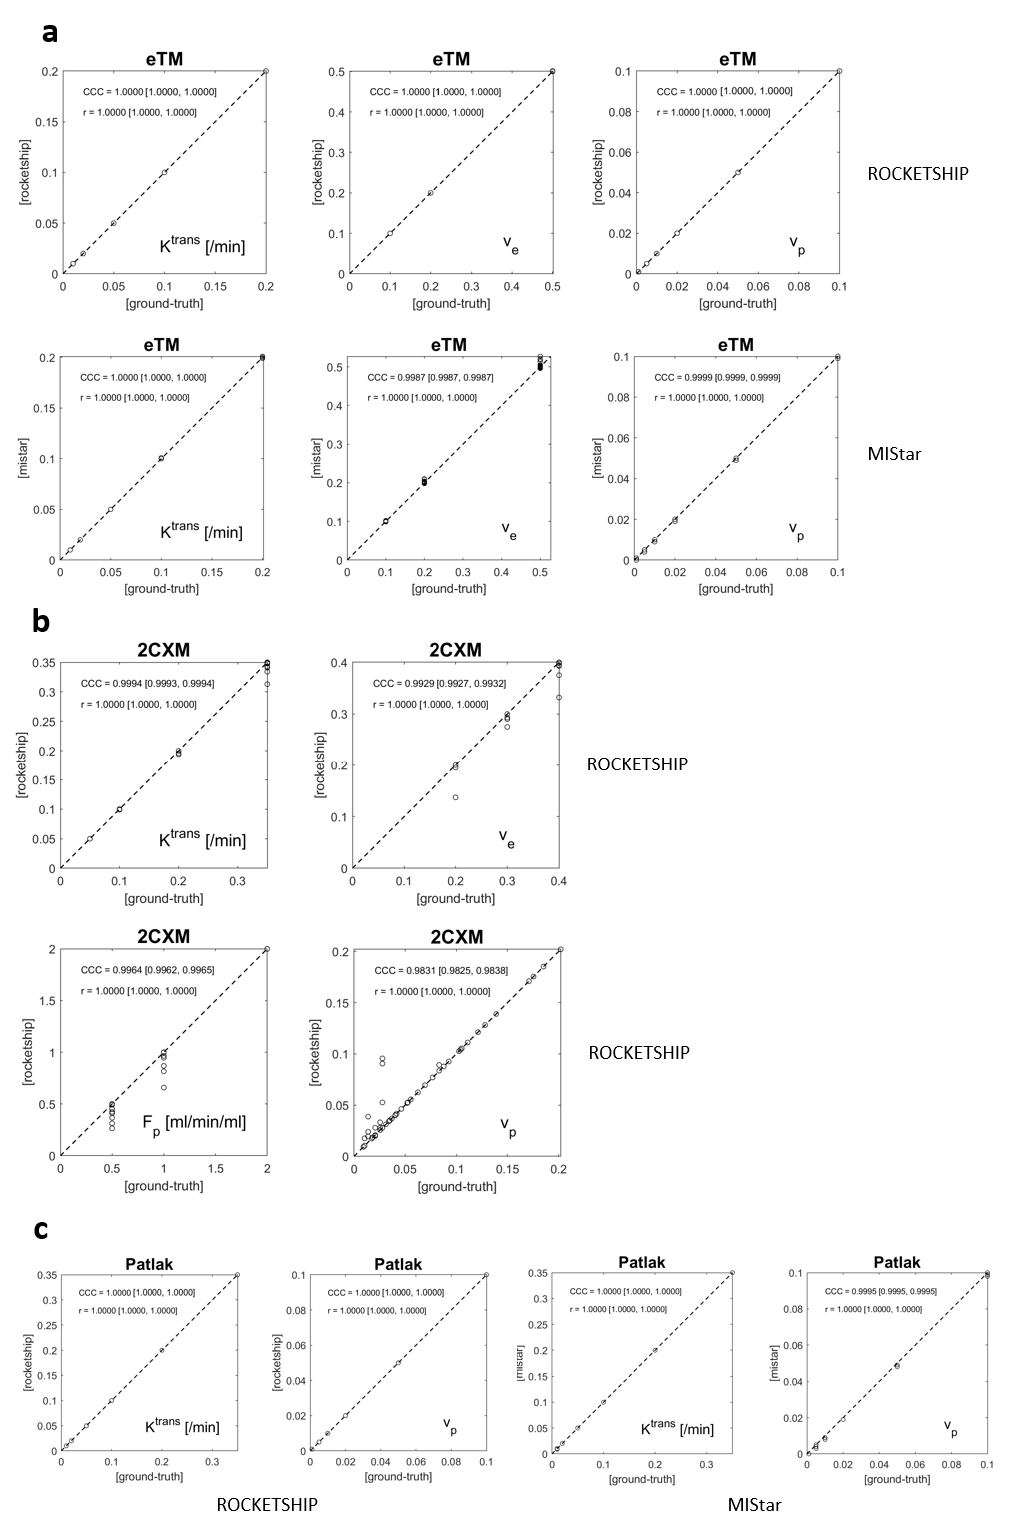
Figure 2. Concordance plots against ‘ground truth’ for kinetic parameter values for three selected models and two analysis packages (ROCKETSHIP and MIStar). a. Extended Tofts model (eTM); b. two-compartment exchange model (2CXM); c. Patlak model. (‘CCC’ is Lin’s concordance correlation coefficient [with 95% confidence interval]; r is Pearson’s correlation coefficient [with 95% confidence interval].)
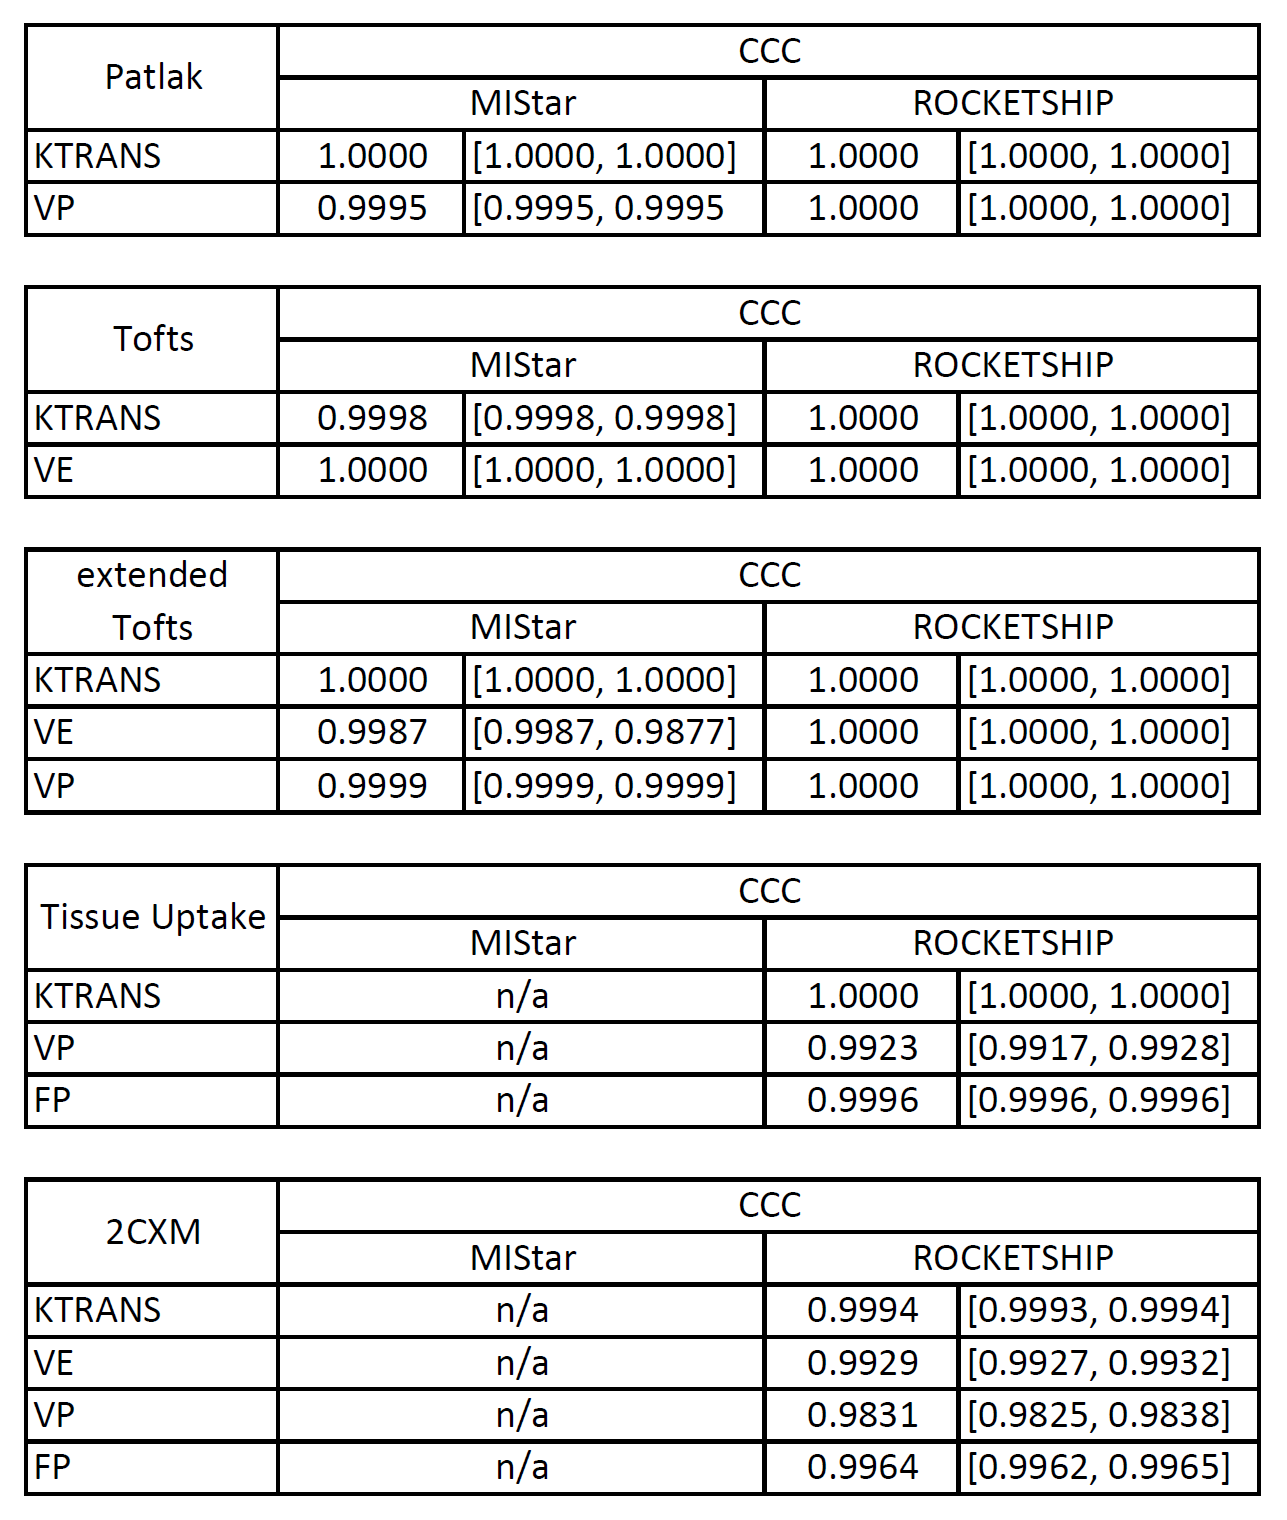
Figure 3. Table of Lin’s concordance correlation coefficient values for comparisons of kinetic model parameters yielded by two software packages (ROCKETSHIP and MIStar) with ‘ground-truth’ values from generated DRO input. Five commonly used kinetic models were tested (Patlak 7, Tofts 4,5, extended Tofts 6, Tissue Uptake 8 and two-compartment exchange 8).