4910
Deep learning DCE-MRI parameter estimation: Application in pancreatic cancer1Radiology and Nuclear Medicine, Amsterdam UMC, Amsterdam, Netherlands, 2Centre for Big Data Research in Health, Sydney, Australia, 3Radiology, The Royal Marsden NHS Foundation Trust and The Institute for Cancer Research, London, United Kingdom, 4Medical Oncology, Amsterdam UMC, Amsterdam, Netherlands, 5Radiation Oncology, Amsterdam UMC, Amsterdam, Netherlands
Synopsis
Quantitative physiological perfusion parameters can be obtained from dynamic contrast-enhanced (DCE)-MRI. Conventionally, fitting is done with the non-linear least squares (NLLS) approach. However, the NLLS-fit suffers from long processing times and results in noisy parameter maps. In this work, we implemented a physics-informed gated recurrent unit (GRU) network with attention layers for estimating physiological parameters using the extended Tofts model. In simulations, we show it outperforms NLLS with more accurate and precise parameter maps. We show our method produced substantially less noisy parameter maps than NLLS in a fraction of the time in pancreatic cancer patients.
Introduction
Dynamic contrast-enhanced (DCE)-MRI is a promising technique for quantifying tissue perfusion [1]. Conventionally, tracer-kinetic (TK) modelling is done with non-linear least squares (NLLS) fitting [2-6]. However, the NLLS-fit has long processing times and results in noisy parameter maps.Recently, deep neural networks have been explored to quickly estimate the physiological parameters from DCE-MRI [7-10]. However, these networks focussed on acceleration but not on outperforming NLLS, and were only applied to brain DCE. Moreover, most approaches were specific to a fixed acquisition length and unsuited for long-range temporal dependencies.
Hence, we developed a novel network that utilizes a gated recurrent unit (GRU) [11] combined with attention layers to predict physiological parameters from DCE-MRI. We validated it in simulations and applied it to DCE data from pancreatic ductal adenocarcinoma (PDAC). The GRU network handles input with different acquisition lengths and the attention layers allow handling long-range temporal dependencies.
Methods
We investigated two types of networks for estimating the extended Tofts TK parameters from DCE data: temporal and spatiotemporal. The temporal networks predict the physiological parameters based on the concentration time curve per voxel while the spatiotemporal networks use convolutions to include spatial information. Our temporal networks were a Fully Connected Network (FCN; 4 layers, width: [320,160,80,40]), a Long Short-Term Memory [12] (LSTM) and the GRU (Figure 1). Our spatiotemporal network was a CNN, as introduced before [9].We used an unsupervised physics-informed loss function that was the mean-squared-difference between the input data and forward extended Tofts modelling of the returned TK-parameters. Training parameters were: batch size 256/8 (temporal/spatial-temporal), ADAM optimizer [13], 50 epochs, an adaptive learning rate that started at 1e-3 and was multiplied by 0.1 every time validation loss was not improved for 3 consecutive epochs.
Simulations
We constructed a synthetic dataset of 500,000 concentration curves with added noise (Signal-to-Noise Ratio [SNR] ranging from 5-100). Concentration curves were simulated using the extended tofts model with random values for extravascular extracellular space ($$$v_e$$$) [0-0.7], plasma volume fraction ($$$v_p$$$) [0-0.05] and rate constant for efflux of gadolinium ($$$k_{ep}$$$) [0-2]. Data acquisition was simulated for 160 dynamics at 1.75s per frame. The precision was quantified by the standard deviation of the errors and the accuracy was quantified by the absolute mean errors between the predicted and ground truth parameters. In additional simulations, we varied the acquisition length from 80-160 time points to assess whether the GRU could handle different lengths.
In vivo
The best performing temporal network and the CNN were evaluated in 31 patients with PDAC [14-15], of which 16 received repeated baseline (test-retest) scans and 15 received a scan before and after chemo-radiotherapy. We used a 3D T1-weighted spoiled ultrafast gradient echo sequence with: FOV=400x400x75mm3, resolution=2.5mm3, TR/TE=3.2/2.0s, FA=20°, Sense=3.6/1.5, frame-rate=1.75s and 100 dynamic scans. We used the root-mean-square error (RMSE) and structure similarity index measure (SSIM) to assess the performance of the networks. Repeatability was determined with a Bland-Altman analysis of the test-retest dataset. Then, the treated patients were added to determine the potency to detect significant changes in individual patients receiving treatment.
Results
SimulationsAll networks showed higher precision and accuracy compared to the NLLS-fit for SNR values up to 40 (Figure 2), particularly for $$$v_e$$$.
The GRU outperformed the FCN when different acquisition lengths were used (Figure 2).
Considering the flexibility to acquisition length and the smaller systematic errors in the $$$k_{ep}$$$ and $$$v_p$$$ parameter, the GRU was selected for in vivo evaluation.
In vivo
The CNN and GRU both showed less noisy parameter maps than the NLLS-fit in vivo (Figure 3), especially for $$$v_e$$$.
There was little difference between the networks on SSIM and RMSE (Figure 4), where GRU had a marginally higher SSIM and lower RMSE than NLLS-fit, suggesting it more accurately describes the data. All networks were substantially faster than NLLS-fit.
The GRU had similar repeatability as the NLLS-fit (Figure 5). The test-retest precision of the $$$k_{ep}$$$ and $$$v_e$$$ parameters from the CNN were better (tighter 95% confidence interval), while the variation in patients receiving treatment remains similar, suggesting CNN was best at picking up treatment effects.
Discussion
We successfully implemented several neural networks for predicting pharmacokinetic parameters from DCE data. These networks are superior to the conventional NLLS-fit. With simulations, we showed that our suggested networks are more accurate and precise for typical SNR. Our networks perform good in vivo, with less noisy parameter maps and similar (GRU) to better (CNN) repeatability. Finally, our networks are substantially faster than conventional approaches.Results suggest that the addition of spatial information allows the CNN to outperform the GRU in vivo. However, we see an increased $$$v_p$$$ in the liver for the CNN in Figure 3. Without simulations, it is hard to determine whether this is a systematic error of the CNN or alternative methods. Furthermore, our GRU is able to perform well on data from any acquisition length, whereas the CNN is limited to a fixed length. Therefore, we suggest using the GRU until the CNN is further improved and validated.
Conclusion
Our networks for analyzing DCE output more accurate and precise parameter estimates than conventional NLLS fitting in a fraction of the time. This opens the way for clinical DCE.Acknowledgements
The KWF Dutch Cancer Society supported this work under Grants No. KWF-UVA 2017-10873 and KWF-UVA 2013.5932References
Sourbron, S., Buckley, D., 2013. Classic models for dynamic contrast-enhanced mri. NMR in Biomedicine 26.
Ahearn, T., Staff, R., Redpath, T., Semple, S., 2005. The use of the levenberg-marquardt curve-fitting algorithm in pharmacokinetic modelling of dce-mri data. Physics in medicine and biology 50 9, N85-92.
Buckley, D., 2002. Uncertainty in the analysis of tracer kinetics using dynamic contrast-enhanced t1-weighted mri. Magnetic Resonance in Medicine 47.
Guo, Y., Lingala, S.G., Bliesener, Y., Lebel, R.M., Zhu, Y., Nayak, K., 2018.Joint arterial input function and tracer kinetic parameter estimation from undersampled dynamic contrast-enhanced mri using a model consistency constraint. Magnetic Resonance in Medicine 79.
Henderson, E., Sykes, J., Drost, D., Weinmann, H.J., Rutt, B., Lee, T.Y., 2000.Simultaneous mri measurement of blood flow, blood volume, and capillary permeability in mammary tumors using two different contrast agents. Journal of Magnetic Resonance Imaging 12.
Murase, K., 2004. Efficient method for calculating kinetic parameters using t1-weighted dynamic contrast-enhanced magnetic resonance imaging. Magnetic Resonance in Medicine 51.
Bliesener, Y., Acharya, J., Nayak, K., 2020. Efficient dce-mri parameter and uncertainty estimation using a neural network. IEEE Transactions on MedicalImaging 39, 1712–1723.
Kettelkamp, J., Lingala, S.G., 2020. Arterial input function and tracer kinetic model-driven network for rapid inference of kinetic maps in dynamic contrast-enhanced mri (aif-tk-net). 2020 IEEE 17th International Sympo-sium on Biomedical Imaging (ISBI) , 1450–1453.
Ulas, C., Das, D., Thrippleton, M., Hern ́andez, M.V.V., Armitage, P., Makin,S.D., Wardlaw, J., Menze, B., 2019. Convolutional neural networks for direct inference of pharmacokinetic parameters: Application to stroke dy-namic contrast-enhanced mri. Frontiers in Neurology 9.
Zou, J., Balter, J., Cao, Y., 2020. Estimation of pharmacokinetic parameters from dce-mri by extracting long and short time-dependent features using an lstm network. Medical physics .
Cho, K., Merrienboer, B.V., Bahdanau, D., Bengio, Y., 2014a. On the properties of neural machine translation: Encoder-decoder approaches. ArXiv abs/1409.1259.
Hochreiter, S., Schmidhuber, J., 1997. Long short-term memory. Neural Computation 9, 1735–1780.
Kingma, D.P., Ba, J., 2015. Adam: A method for stochastic optimization.CoRR abs/1412.6980
Klaassen, R., Gurney-Champion, O., Wilmink, J., Besselink, M., Engelbrecht,M., Stoker, J., Nederveen, A., van Laarhoven, H.V., 2018. Repeatability And correlations of dynamic contrast enhanced and t2* mri in patients with advanced pancreatic ductal adenocarcinoma. Magnetic resonance imaging 50, 1–9.
Klaassen, R., Steins, A., Gurney-Champion, O.J., Bijlsma, M.F., tienhoven,G.V., Engelbrecht, M.R.W., van Eijck, C.H.J., Suker, M., Wilmink, J.W.,Besselink, M.G., Busch, O.R.C., de Boer, O.J., van de Vijver, M.J., Hooijer, G.K.J., Verheij, J., Stoker, J., Nederveen, A.J., van Laarhoven, H.W.,2020. Pathological validation and prognostic potential of quantitative mri in the characterization of pancreas cancer: preliminary experience. Molecular Oncology 14, 2176 – 2189.
Figures
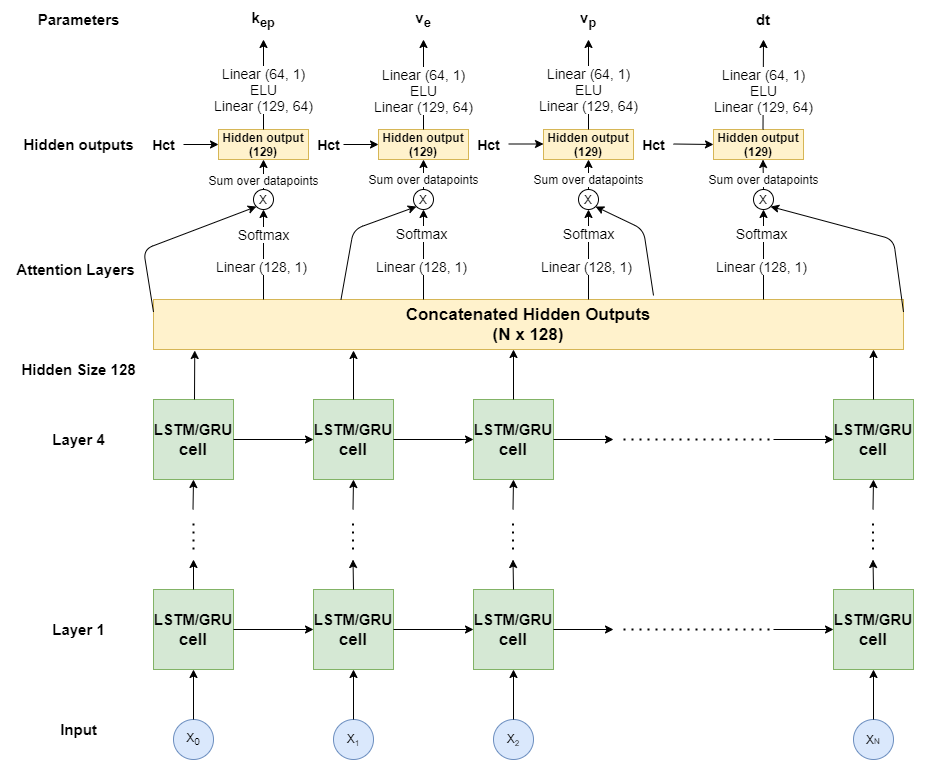
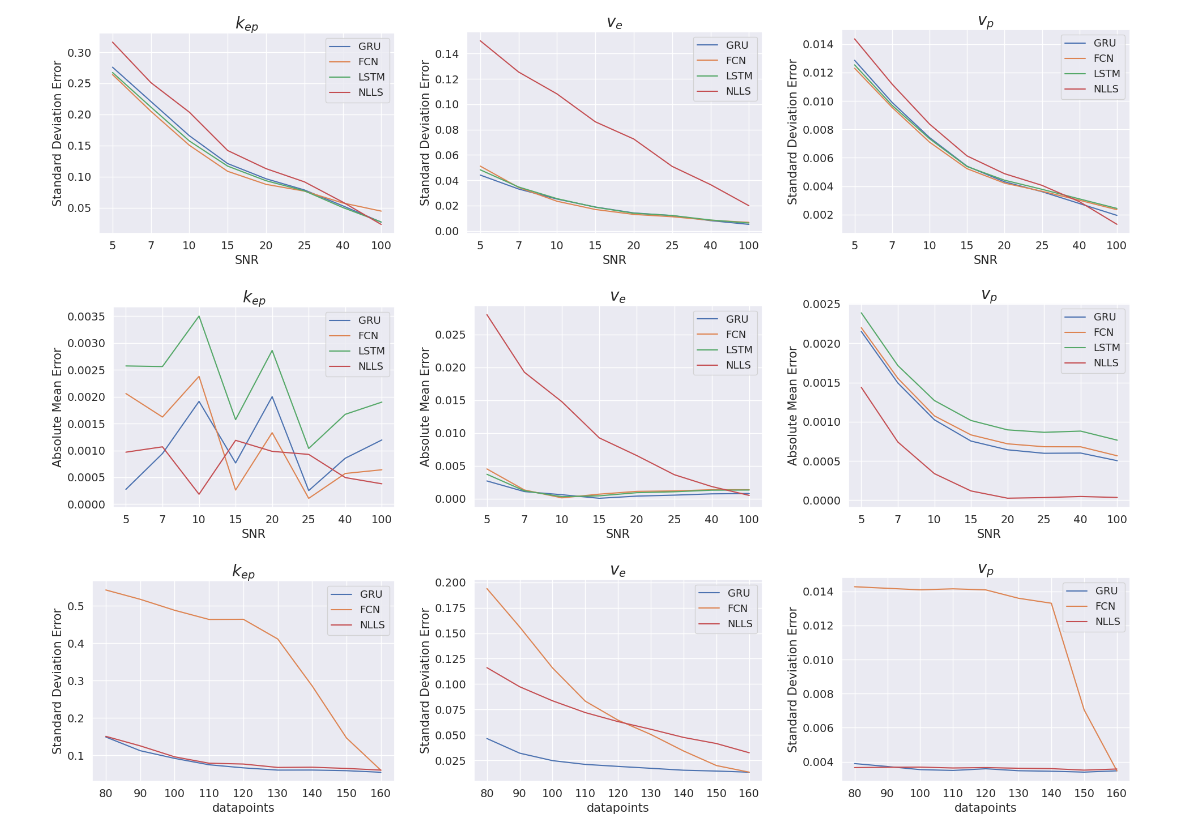
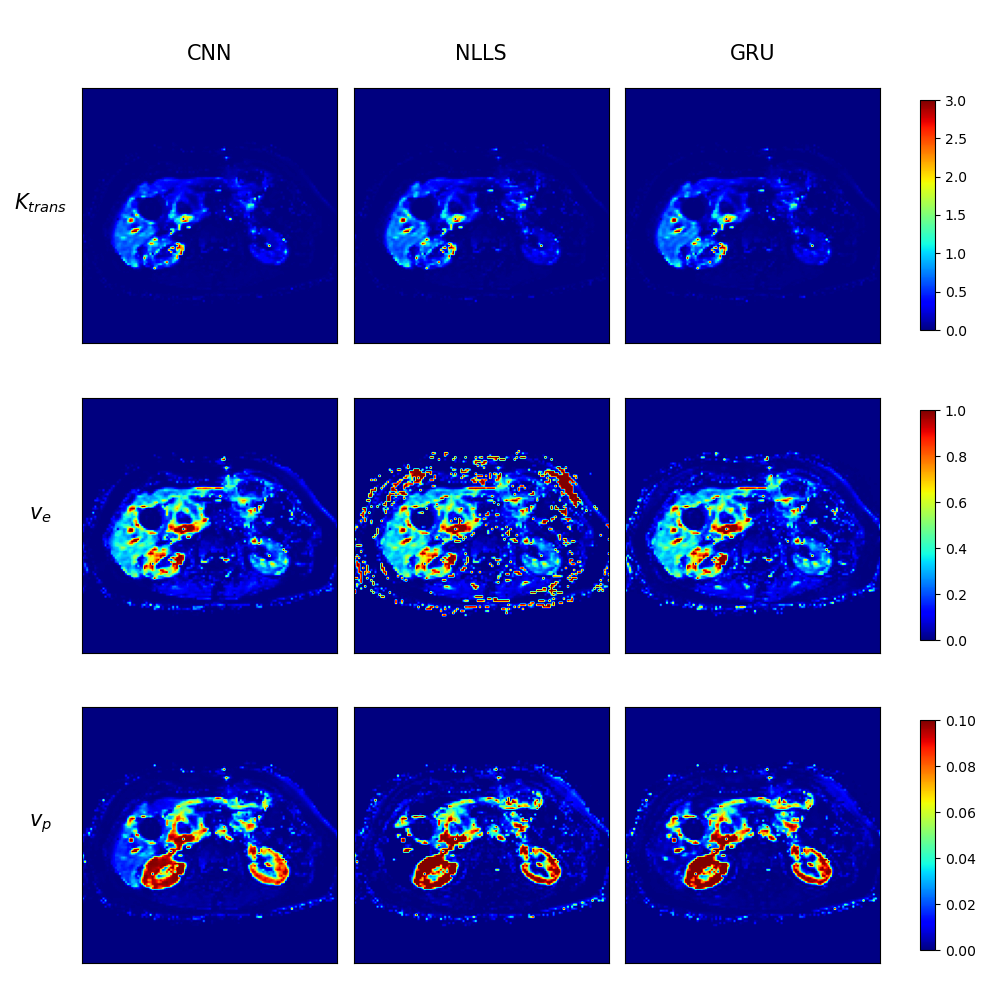
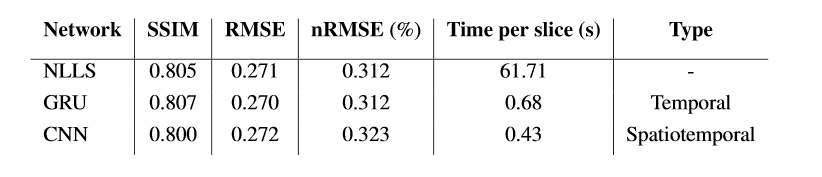
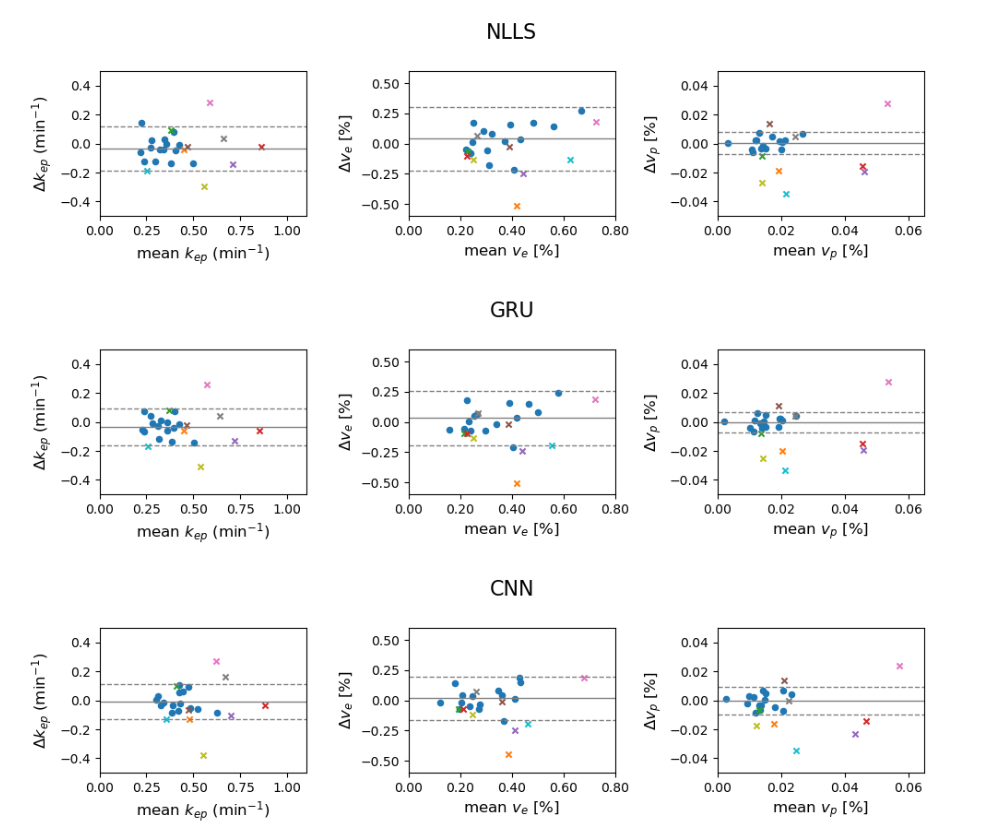
Figure 5: Bland-Altman plots of the neural network approaches to fitting of the physiological parameters of DCE-MRI concentration curves. The mean and difference is shown between the intersession repeatability patients (blue dots) and the mean and difference between pre- and post-treatment patients who received chemoradiation therapy (colored crosses).