4907
Comparison of Velocity Selective ASL and PCASLwith Phase-Contrast MRI for Measuring
CO2-induced Cerebrovascular Reactivity
1The Russell H. Morgan Department of Radiology and Radiological Science, Johns Hopkins University, Baltimore, MD, United States, 2F.M. Kirby Research Center for Functional Brain Imaging, Kennedy Krieger Institute, Baltimore, MD, United States
Synopsis
Saturation based velocity-selective ASL (VSASL) was recently investigated for acetazolamide challenge and notably lower cerebrovascular reactivity (CVR) was observed when comparing to PET results. Here we compared the performance of velocity-selective inversion (VSI) prepared ASL and pseudo-continuous ASL in response to the hypercapnia challenge for CO2-induced CVR quantification with phase-contrast MRI as a global reference. VSI-ASL could underestimate the regional CVR when the trailing edge of the labeled bolus arrive before the PLD as the CBF during hypercapnia would be underestimated. In contrast, PCASL could overestimate CVR in areas with long ATT as the baseline CBF would be underestimated.
Introduction
Cerebrovascular reactivity (CVR) is an important matric for examining cerebrovascular diseases. Velocity-selective ASL (VSASL) 1 was developed to minimize the sensitivity to the prolonged arterial transit time (ATT). Velocity-selective-saturation based VSASL was recently investigated for acetazolamide challenge and notably lower CVR was observed when comparing to PET results 2. Velocity-selective inversion (VSI) prepared VSASL has been demonstrated with improved SNR for baseline cerebral blood flow (CBF) mapping 3,4 and its feasibility for CVR measurement has not been examined. Here we compared the performance of VSI-ASL and pseudo-continuous ASL (PCASL) in response to the hypercapnia challenge for CO2-induced CVR quantification with phase-contrast (PC) MRI as a global reference. For VSI-ASL, post labeling delay (PLD) was varied to evaluate its impact on CVR estimation.Methods
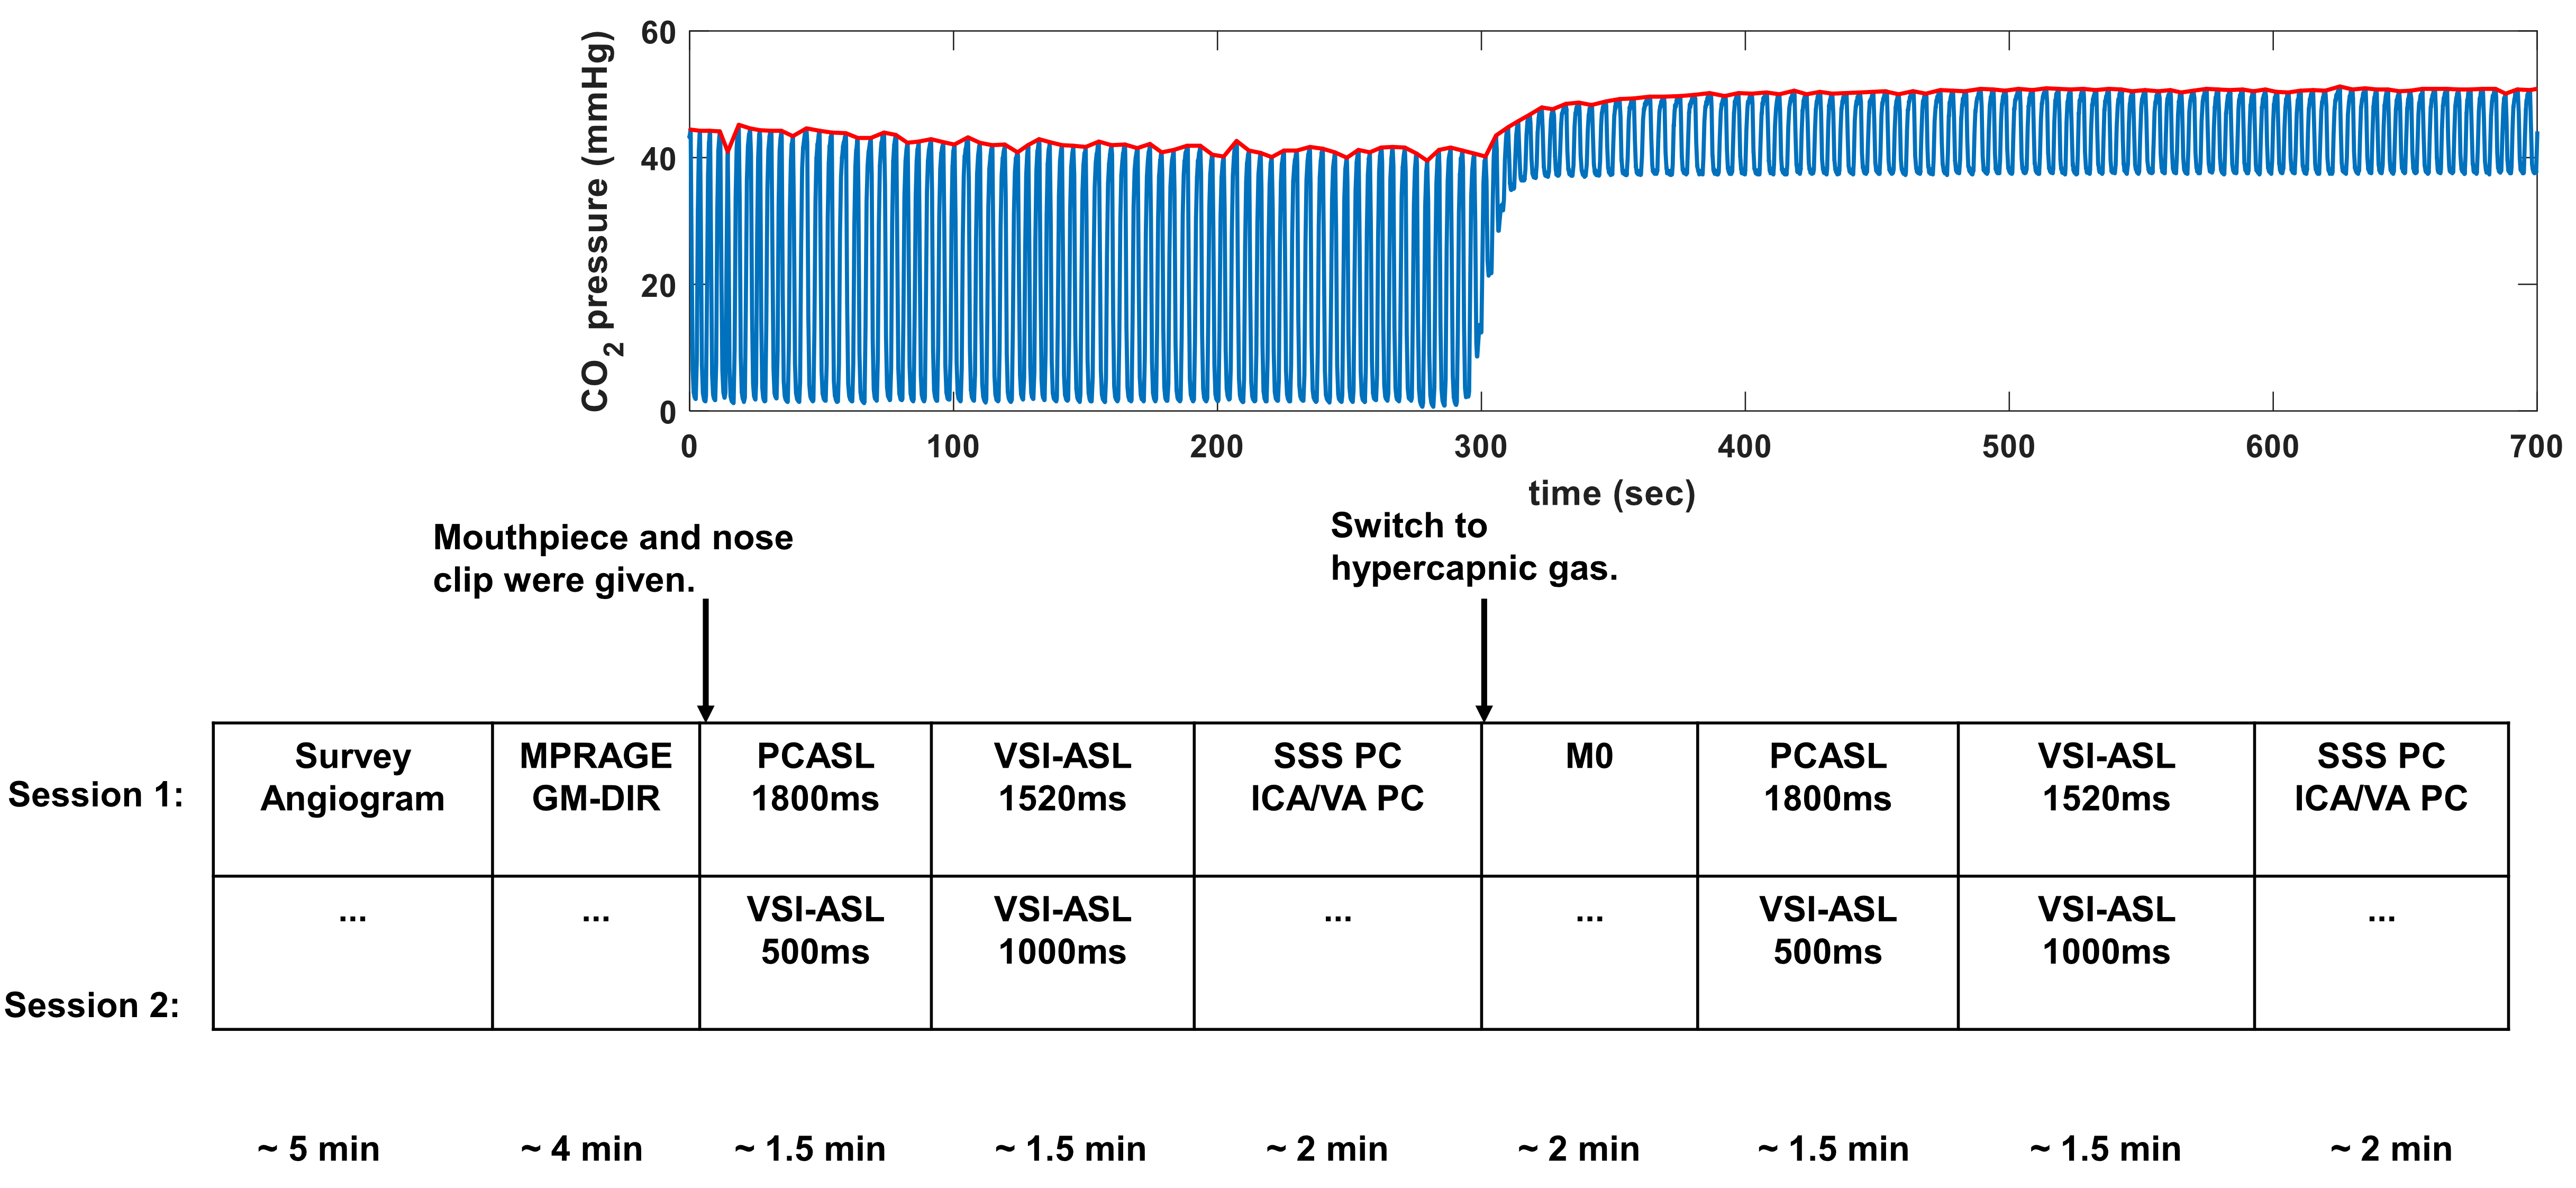
CVR experiments were conducted on a 3T Philips Ingenia scanner using a 32-channel head-only coil for signal reception. Eight healthy volunteers (39±15yrs, 3M/5F) providing written informed consent were enrolled in two separate sessions five months apart: PCASL1800 (labeling duration=1800ms, PLD=1800ms) and VSI-ASL1520 (PLD=1520ms) in session 1; VSI-ASL1000 (PLD=1000ms), and VSI-ASL500 (PLD=500ms) in session 2. Study design is illustrated in Figure 1, where the duration of hypercapnia challenge was about 7min. Subjects breathed through a mouthpiece with a sampling tube to measure end tidal CO2 (Et-CO2). More details of gas delivery setup were described previously 5.All ASL scans were acquired using 3D GRASE readout with following parameters: FOV=218x218x120mm3, acquired resolution=3.4x3.6x5mm3, TR/TE=3791/14ms, SENSE=2, TSE/EPI factor=12/15, 3 dynamic scans. Scan duration=1min53sec/1min38sec/1min23sec for VSI-ASL1520/VSI-ASL1000/VSI-ASL500 respectively. The cutoff velocity of VSI-ASL scans was 2cm/s. The scan duration of PCASL was 1.5min. The proton-density weighted M0 scan was performed with TR of 10sec with scan duration of 1.2min. PC MRI was acquired at four arteries, internal carotid arteries (ICA), vertebral arteries (VA), and superior sagittal sinus (SS), with scan duration of 20s for each vessel.
ASL images were motion corrected and smoothed by FWHM of 4mm. Perfusion weighted signal (PWS) were analyzed as (control-label)/M0. CVR map in unit of %/mmHg was calculated by the percentage of perfusion (in ASL) or flux (in PC MRI) increase from room air to hypercapnia normalized by individual Et-CO2 changes during each scan. Regional CVR were averaged from the ROIs delineated from MPRAGE using SPM 12 and MRICloud (https://braingps.mricloud.org/). ROIs including global tissue, global gray matter (GM), global white matter (WM), and GM in frontal and occipital lobes. The regional coefficient of variation (CoV) between CVRs derived by each ASL method and PC MRI based global CVR were calculated to evaluate the consistency between different perfusion MRI techniques.
Results and Discussion
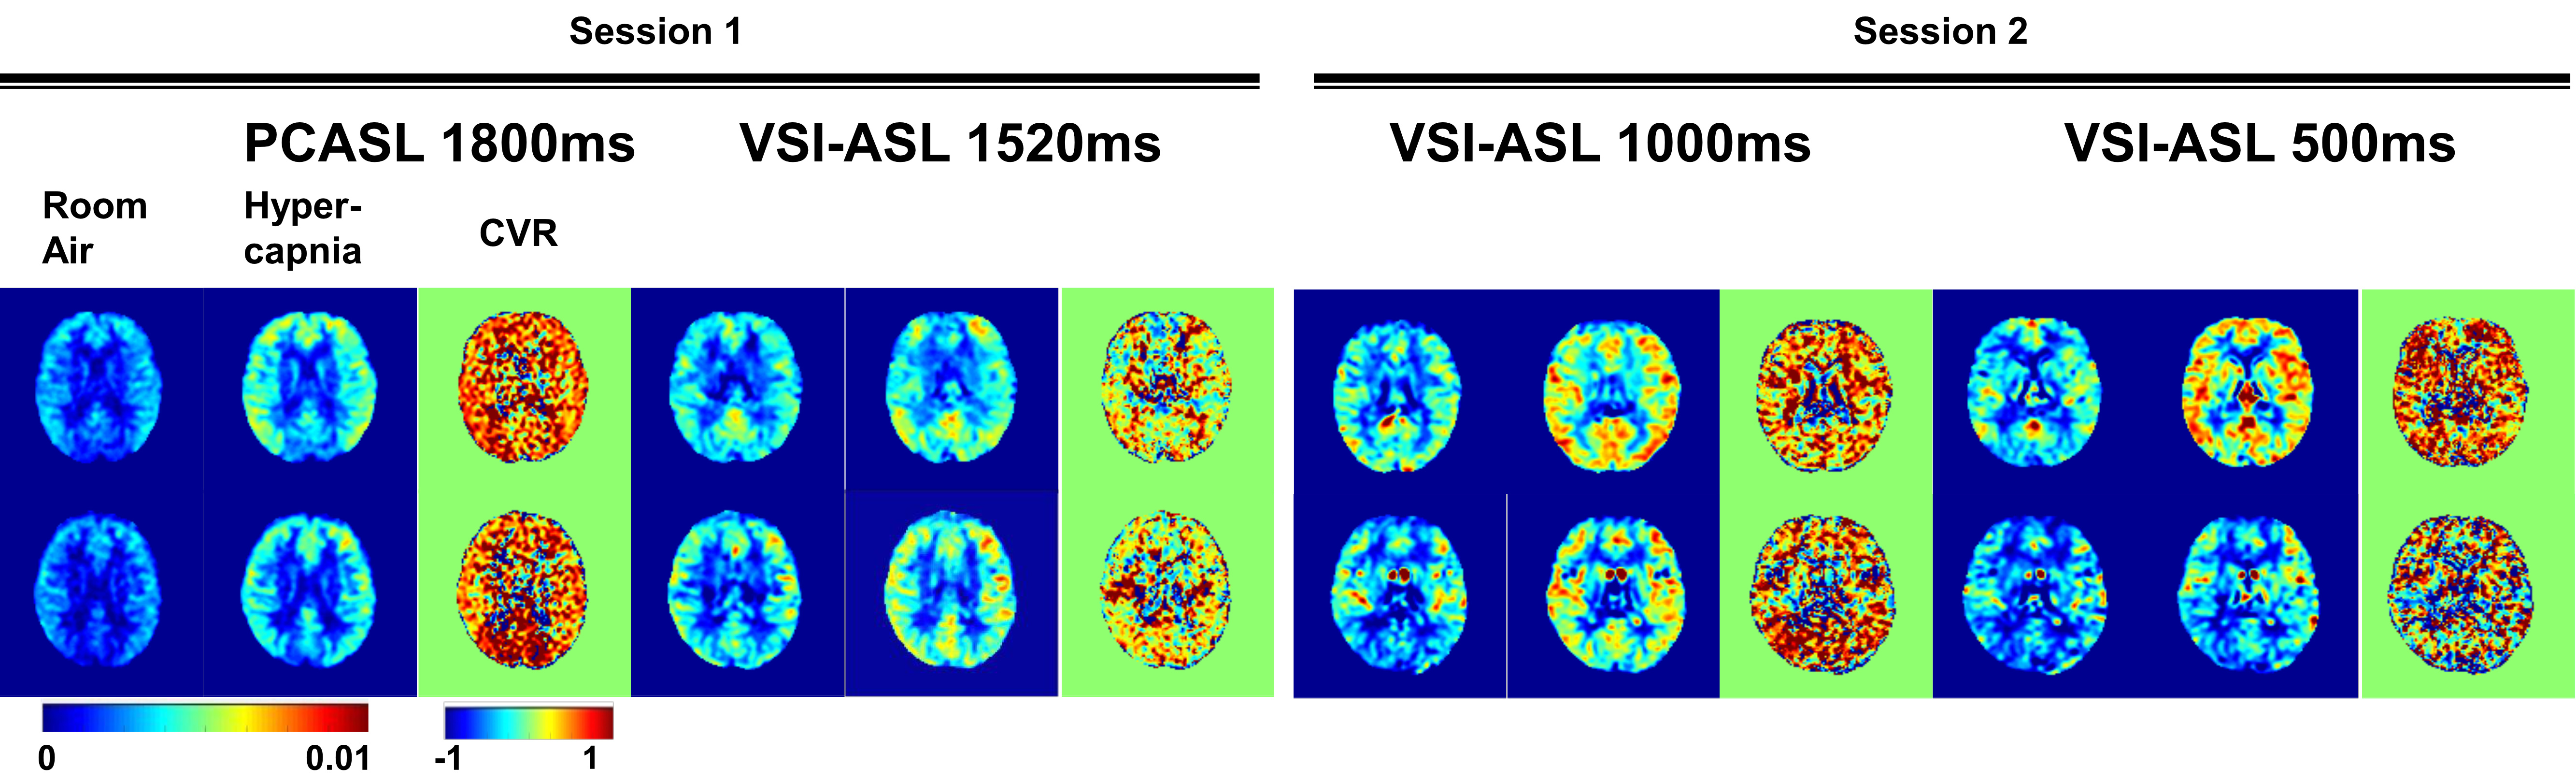
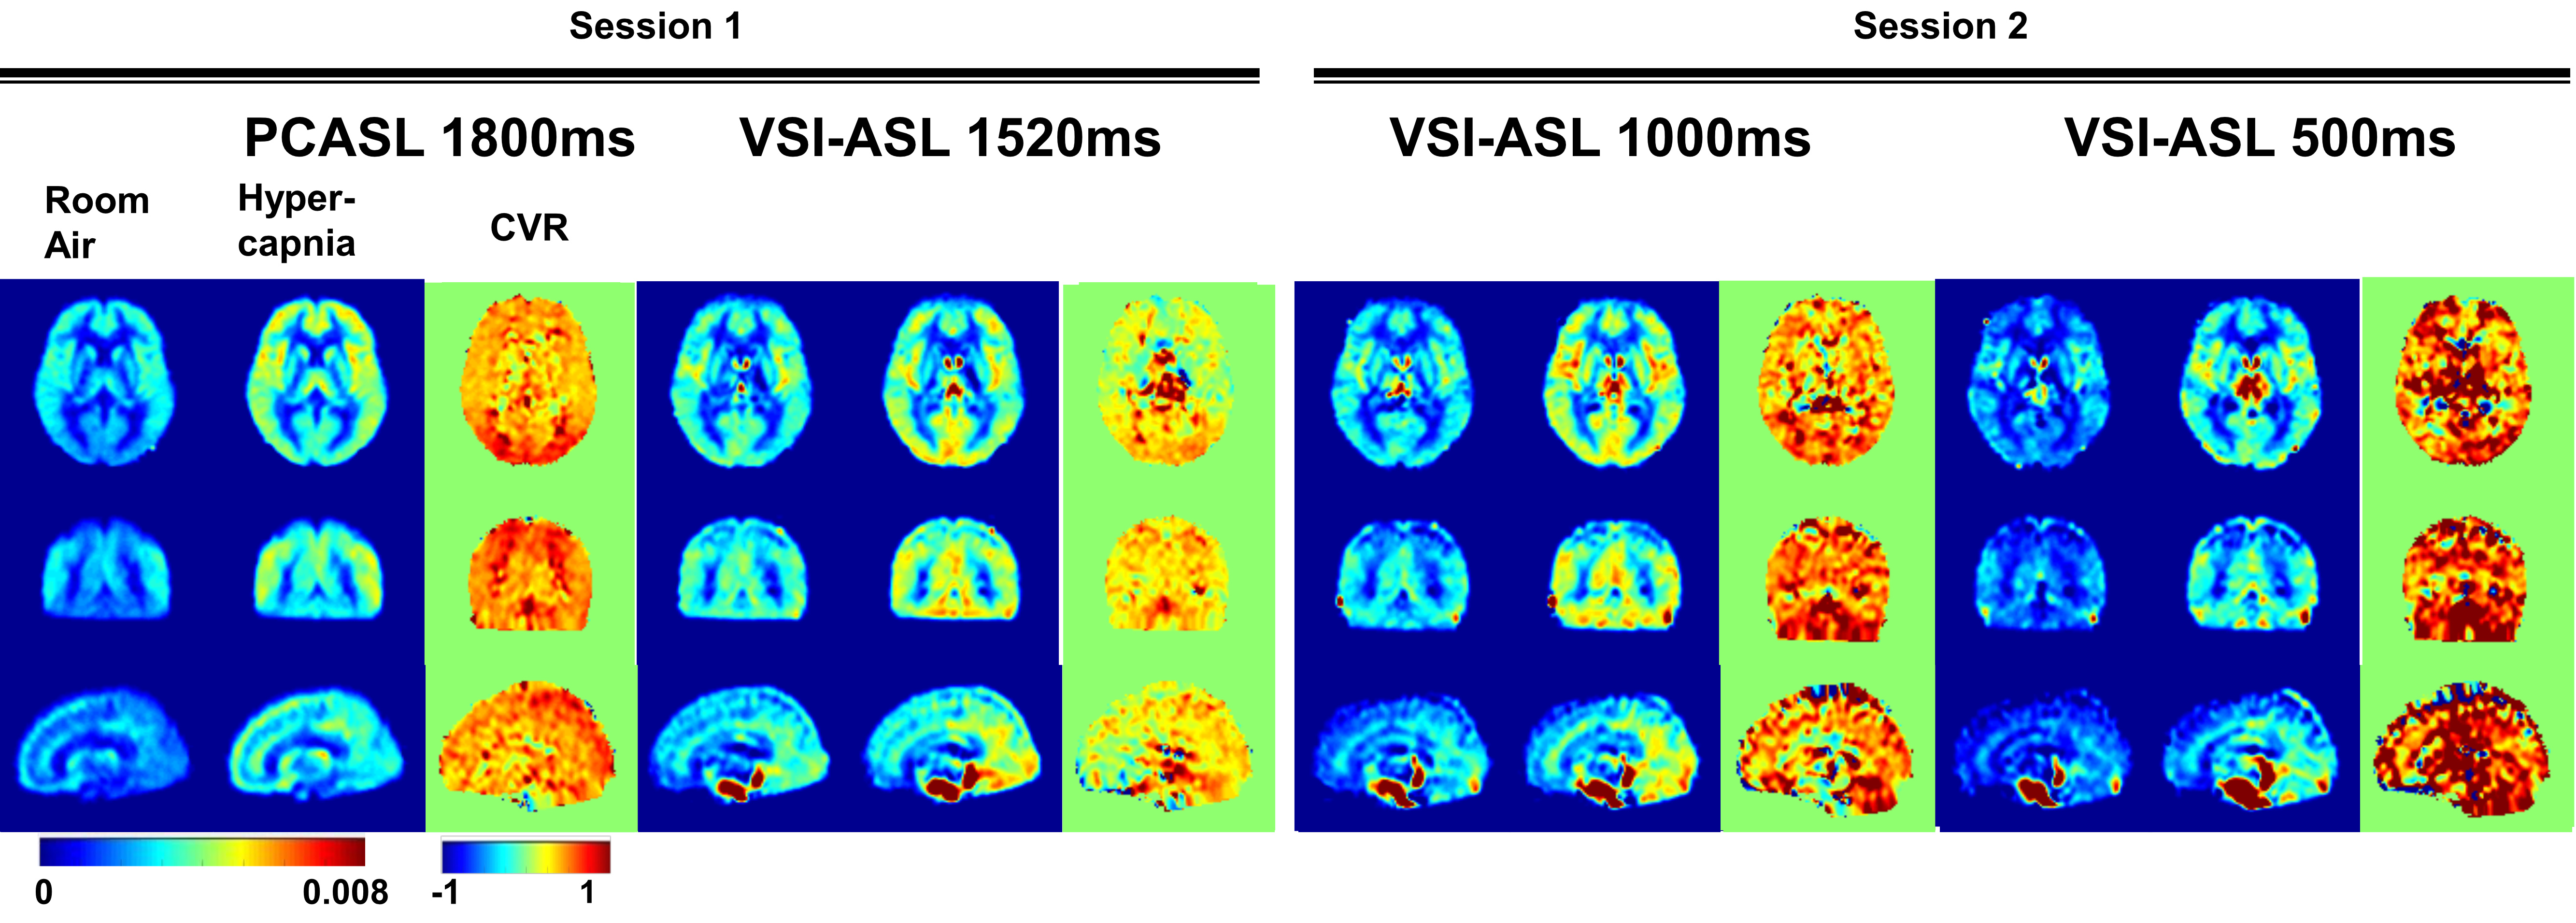
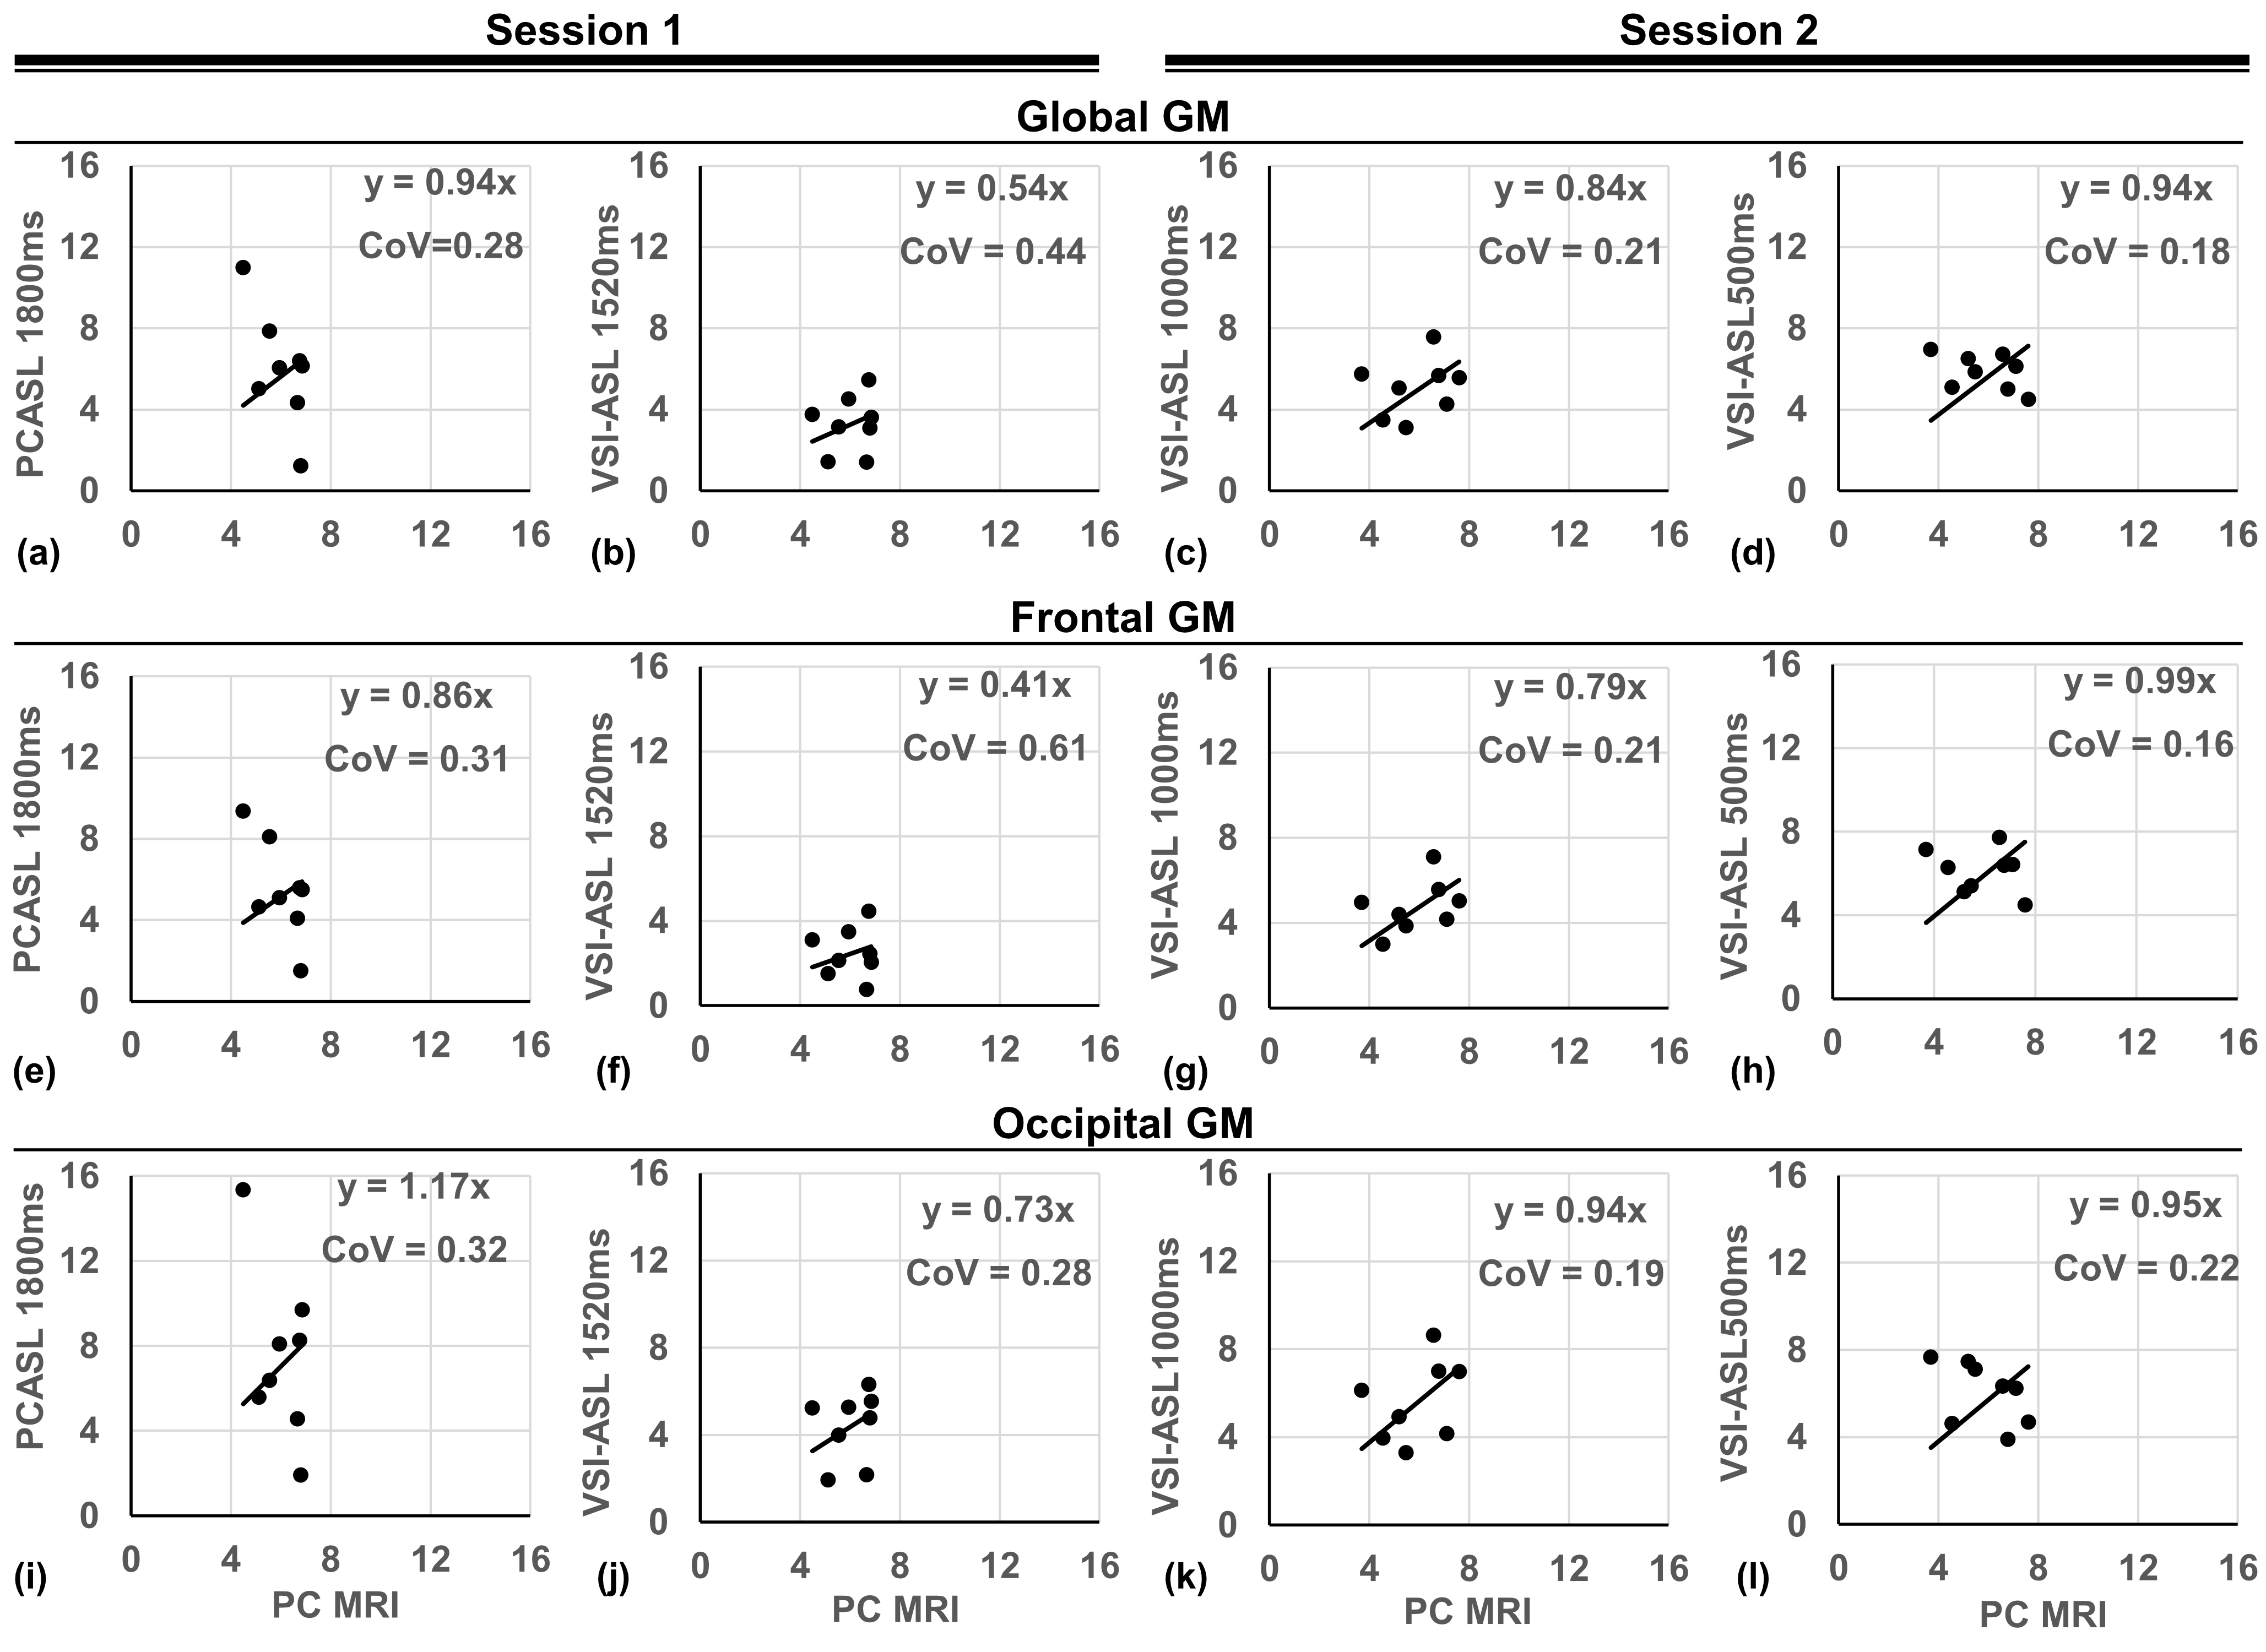
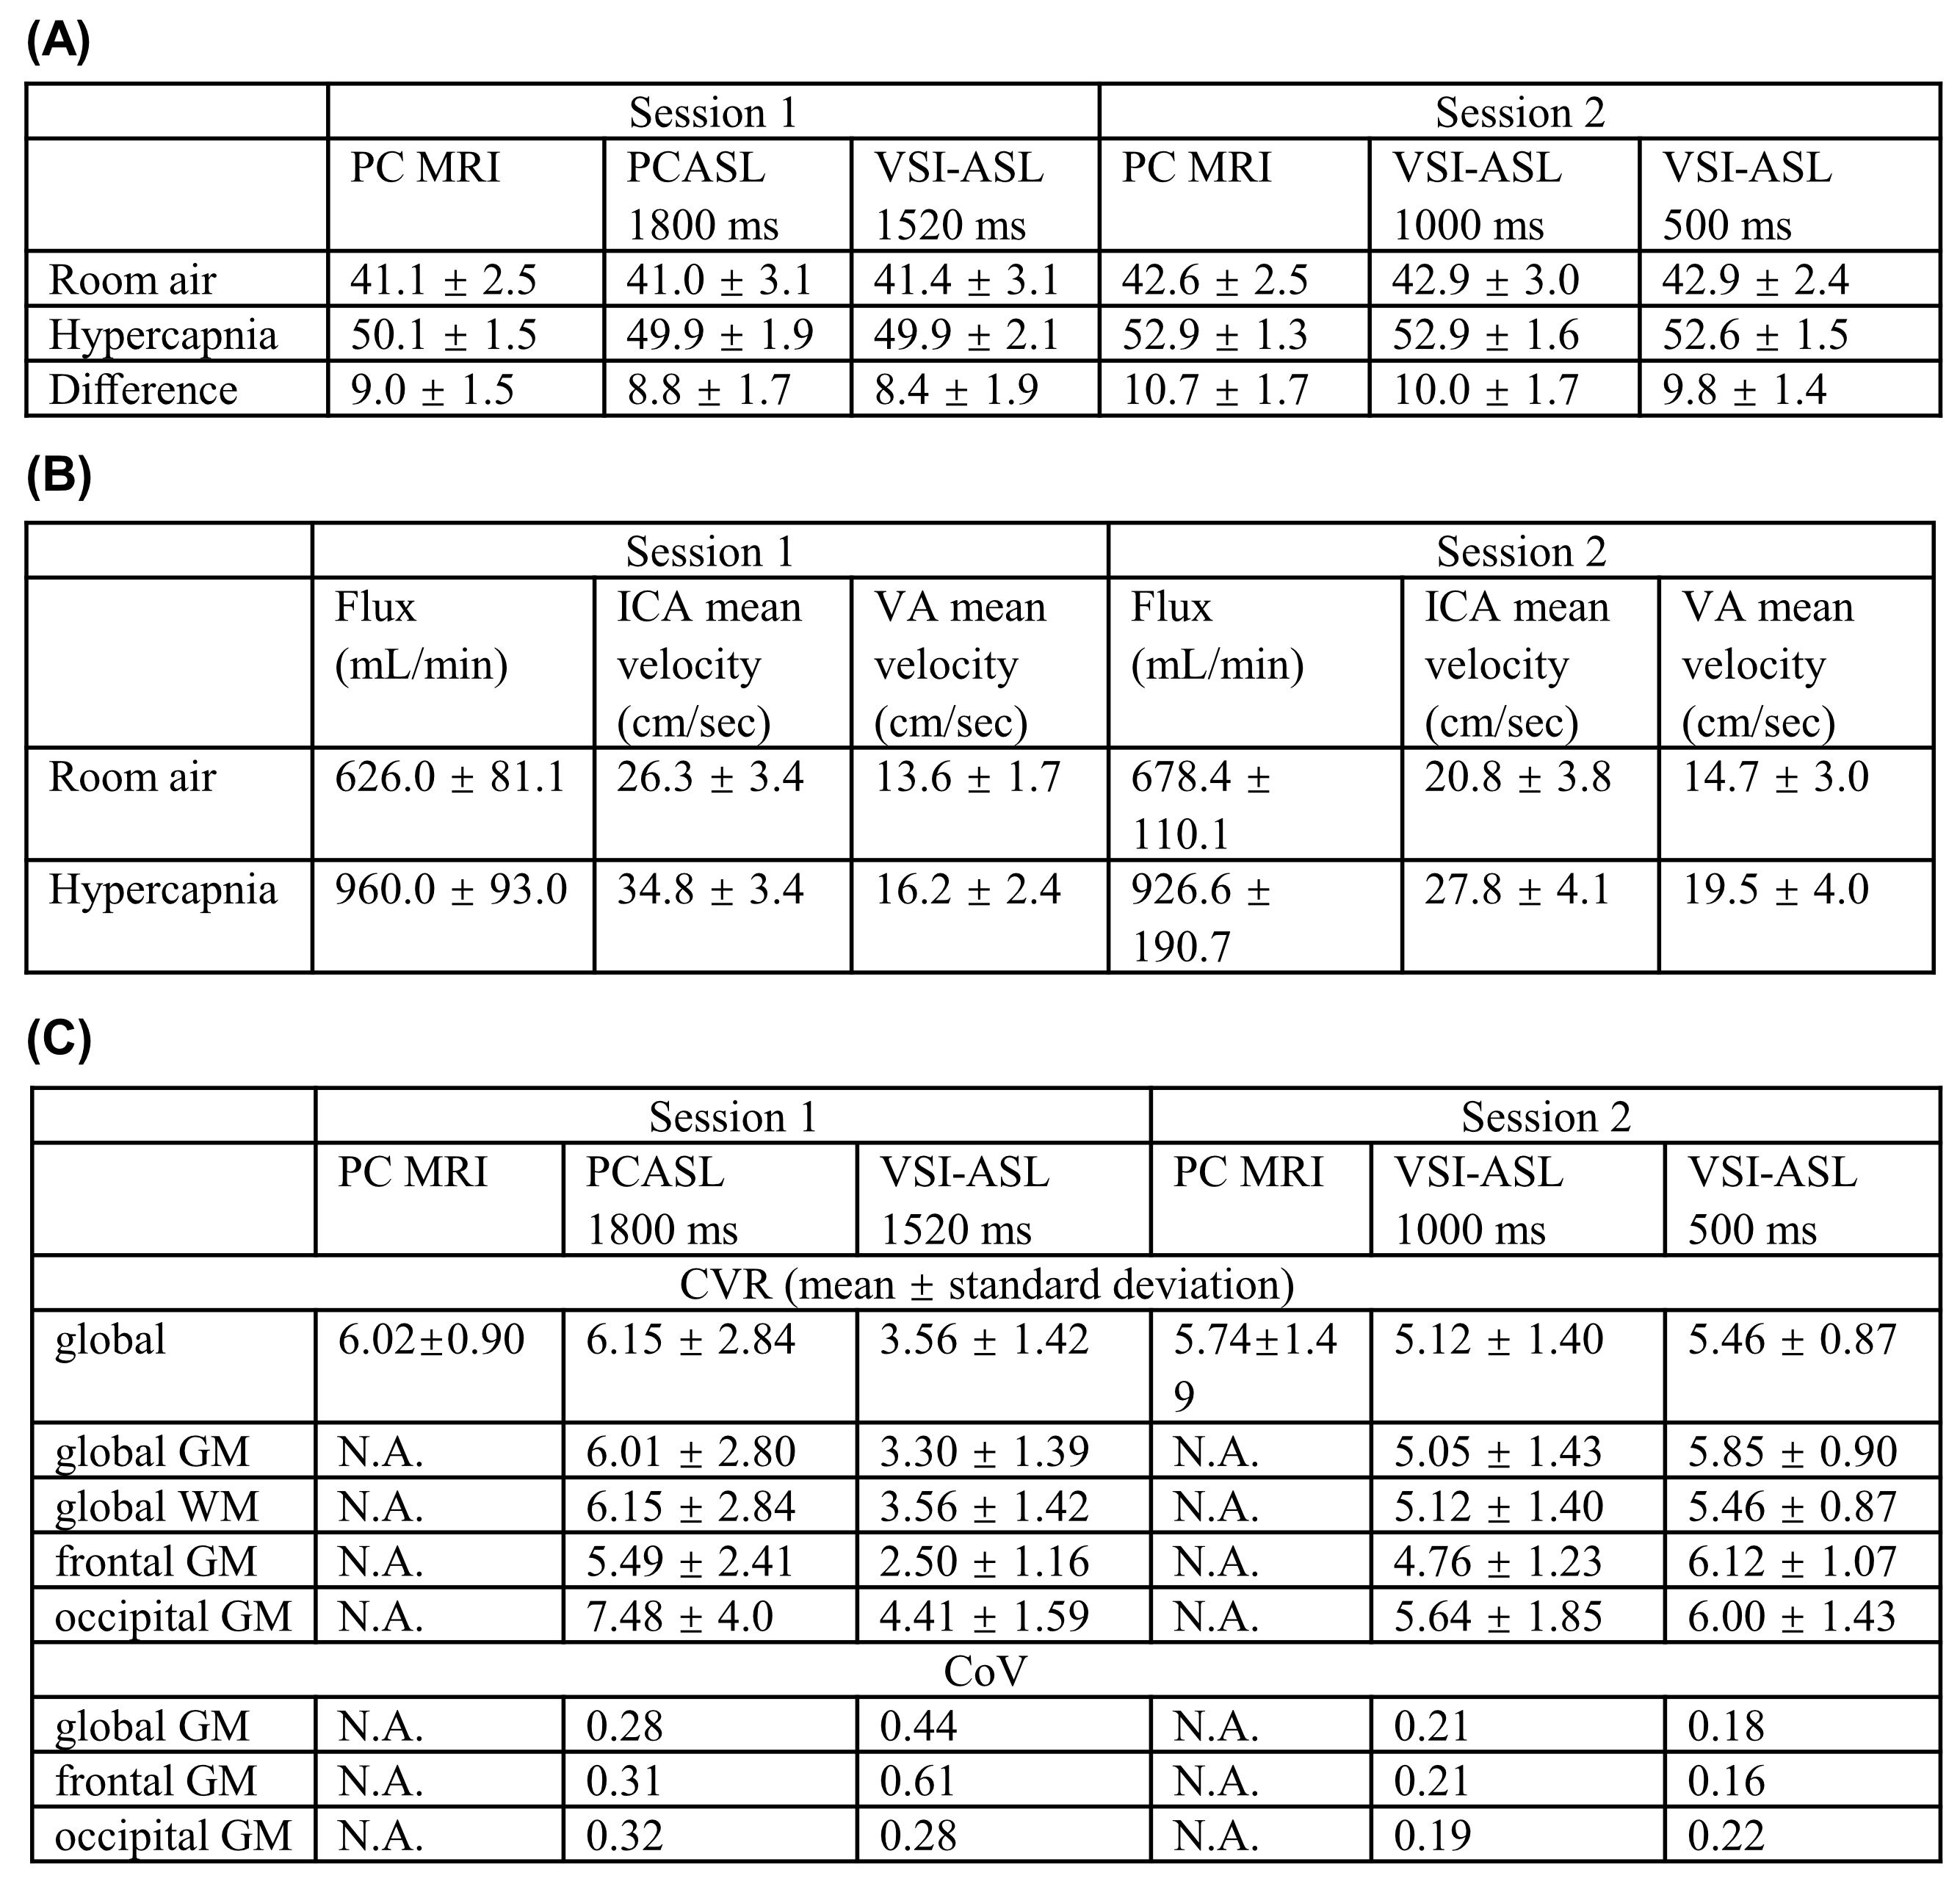
PWS of the four ASL sequences at room air and hypercapnia as well as the CVR maps at the first and second sessions of two representative subjects are shown in Figure 2. The corresponding group-averaged PWS and CVR maps of the whole brain in three orthogonal orientations are shown in Figure 3. The scatter plots of CVRs of global GM, frontal lobe GM, and occipital lobe GM derived from four ASL sequences against PC MRI based global CVR for eight individuals are arrayed in Figure 4. Table 1 lists the group-averaged values of EtCO2, the velocities of ICAs and VAs measured by PC MRI and the global flux at room air and hypercapnia, and the CVR for each perfusion method at different ROIs.When compared with PC MRI in each session, VSI-ASL1520 produced significantly lower global CVR values (3.56%/mmHg vs. 6.02%/mmHg, p=0.02), while VSI-ASL1000 and VSI-ASL500 yielded much more consistent results (5.12%/mmHg, 5.46%/mmHg, vs. 5.74%/mmHg). The reduced CVR values of VSI-ASLwere more pronounced in ICA territories (i.e. frontal lobe) but moderate in VA territories (i.e. occipital lobe). The CoV between VSASL-derived regional CVR and PC MRI based global CVR was found higher at frontal GM than occipital GM in VSI-ASL1520 (0.61 vs. 0.28), and more comparable at these two regions in VSI-ASL1000 and VSI-ASL500 (0.21 vs. 0.19, 0.16 vs. 0.22), respectively. PCASL1800 was only found with higher CVR in occipital lobe (7.48%/mmHg vs. 6.02%/mmHg, p=0.11) and the CoV between PCASL-derived regional CVR and PC MRI based global CVR was moderate, 0.28-0.32 (Table 1C). Neither PCASL nor VSASL showed GM/WM contrast in CVR maps.
As ICAs had almost two times higher velocity than VAs and both vessels ran 19-34% faster during hypercapnia (Table 1B), the ATT of the trailing edge of the VS-labeled bolus to ICA territories (i.e. frontal lobe) would be about half to the VA territories (i.e. occipital lobe), and would be further reduced to 16-25% shorter during hypercapnia. For VSASL, if the ATT of the trailing edge gets shorter than PLD, it would lead to underestimated CBF. This may explain the lower CVR in VSI-ASL1520 more severely at frontal lobe and only moderately at occipital lobe. Conversely, for PCASL, the underestimation of perfusion at occipital lobe with ATT longer than PLD at room air yielded higher CVR.
Conclusion
VSI-ASL could underestimate the regional CVR when the trailing edge of the labeled bolus arrive before the PLD as the CBF during hypercapnia would be underestimated, similar to the issue of pulsed ASL 6; while PCASL could overestimate CVR in areas with long ATT as the baseline CBF would be underestimated.Acknowledgements
No acknowledgement found.References
1. Wong EC, Cronin M, Wu WC, Inglis B, Frank LR, Liu TT. Velocity-selective arterial spin labeling. Magn Reson Med 2006;55(6):1334-1341.
2. Zhao MY, Fan AP, Chen DYT, Sokolska MJ, Guo J, Ishii Y, Shin DD, Khalighi MM, Holley D, Halbert K, Otte A, Williams B, Rostami T, Park JH, Shen B, Zaharchuk G. Cerebrovascular reactivity measurements using simultaneous O15-water PET and ASL MRI: Impacts of arterial transit time, labeling efficiency, and hematocrit & nbsp;. Neuroimage 2021;233.
3. Qin Q, van Zijl PC. Velocity-selective-inversion prepared arterial spin labeling. Magn Reson Med 2016;76(4):1136-1148.
4. Liu D, Xu F, Li W, van Zijl PC, Lin DD, Qin Q. Improved velocity-selective-inversion arterial spin labeling for cerebral blood flow mapping with 3D acquisition. Magn Reson Med 2020;84:2512-2522.
5. Taneja K, Liu P, Xu C, Turner M, Zhao Y, Abdelkarim D, Thomas BP, Rypma B, Lu H. Quantitative Cerebrovascular Reactivity in Normal Aging: Comparison Between Phase-Contrast and Arterial Spin Labeling MRI. Front Neurol 2020;11:758.
6. Tancredi FB, Gauthier CJ, Madjar C, Bolar DS, Fisher JA, Wang DJ, Hoge RD. Comparison of pulsed and pseudocontinuous arterial spin-labeling for measuring CO2 -induced cerebrovascular reactivity. J Magn Reson Imaging 2012;36(2):312-321.
Figures