4906
Normalization for Relative Cerebrovascular Reactivity in Multifocal Vascular Disease Patients Using Calibrated Perfusion and Temporal Shift1Department of Radiology, Weill Cornell Medicine, New York, NY, United States, 2Department of Radiology, New York University Langone Health, New York, NY, United States, 3Department of Neurology, New York University Langone Health, New York, NY, United States, 4Department of Radiology and Imaging Sciences, Emory University, Atlanta, GA, United States
Synopsis
Cerebrovascular reactivity (CVR) is a widely used estimation of hemodynamic stress and ischemic stroke risk but its semi-quantitative nature relegates it primarily to estimations of relative change by comparison to putatively normal territories. Diagnostic and prognostic utility is thus attenuated in commonly encountered patients with bihemispheric disease, thus we have tested approaches for identification of candidate healthy voxels accompanying perfusion imaging or inline calibration of BOLD temporal shift, optimized in a cohort of subjects with strictly unilateral macrovascular disease. Excellent agreement with normative CVR values was observed, suggesting its applicability in patients with multi-focal or ambiguous vascular disease patterns.
Introduction
Cerebrovascular reactivity (CVR) measured from acetazolamide-augmented blood oxygenation level-dependent response (ACZ-BOLD) is an intriguing strategy for the characterization of hemodynamic stress in chronic cerebrovascular steno-occlusive disease (SOD) 1. Like other such approaches, however, its fundamentally semi-quantitative nature restricts its utility beyond cases with unilateral disease, in which the contralateral hemisphere is most often used for the estimation of relative change in hemodynamic variables. The cerebellum presents as an alternative reference for some techniques, however, degradation of MRI in the posterior fossa and challenges to achieve whole brain coverage for some exams preclude its consistent use. We report a strategy for identifying candidate healthy voxels throughout the brain, calibrated against normal hemispheres of subjects with angiographically-confirmed, strictly unilateral cerebrovascular SOD, and conceived for its use in situations agnostic to the distribution of vascular disease or with bilateral disease. Two approaches are discussed, beginning with the use of perfusion imaging obtained in routine clinical practice in a cohort of patients undergoing BOLD-CVR for SOD. It is then extended to the extraction of healthy voxels using inline temporal shift (TS) features of the baseline BOLD time-signal course (TSC) allowing an auto-calibrated approach in patients with ambiguous or multifocal SOD.Methods
16 patients with unilateral chronic SOD (mean age: 52.38±13.44 years, 8 females) underwent 22 ACZ-challenge MRI exams. Subjects were scanned in a 3T whole-body SIEMENS Prisma scanner with a 64-channel head coil. Several sequences were acquired during the scan including: a 1mm isotropic T1-weighted (T1w) MPRAGE (TR/TE=2300/2.9ms, FA=9°), a 20-minute resting state T2*-weighted EPI based BOLD scan (TR/TE=2150/36ms, voxel size=2x2x5mm3) and a DSC perfusion scan (TR/TE=1740/40ms, FA=70°, voxel size=1.7x1.7x6mm3). 1-gram ACZ in 10mL normal saline was infused over ~3 minutes, following a 4-5 minutes baseline scan without interruption of the BOLD scan.The pre-processing of T1w and BOLD images was elaborated previously 2. BOLD TSC underwent denoising, motion correction, spatial distortion correction, slice timing correction, spatial and temporal filtering without detrending. The first and last 1 minute of BOLD signals were removed. A linear boundary-based coregistration was used to align BOLD and perfusion images to the pre-processed T1w image 3.
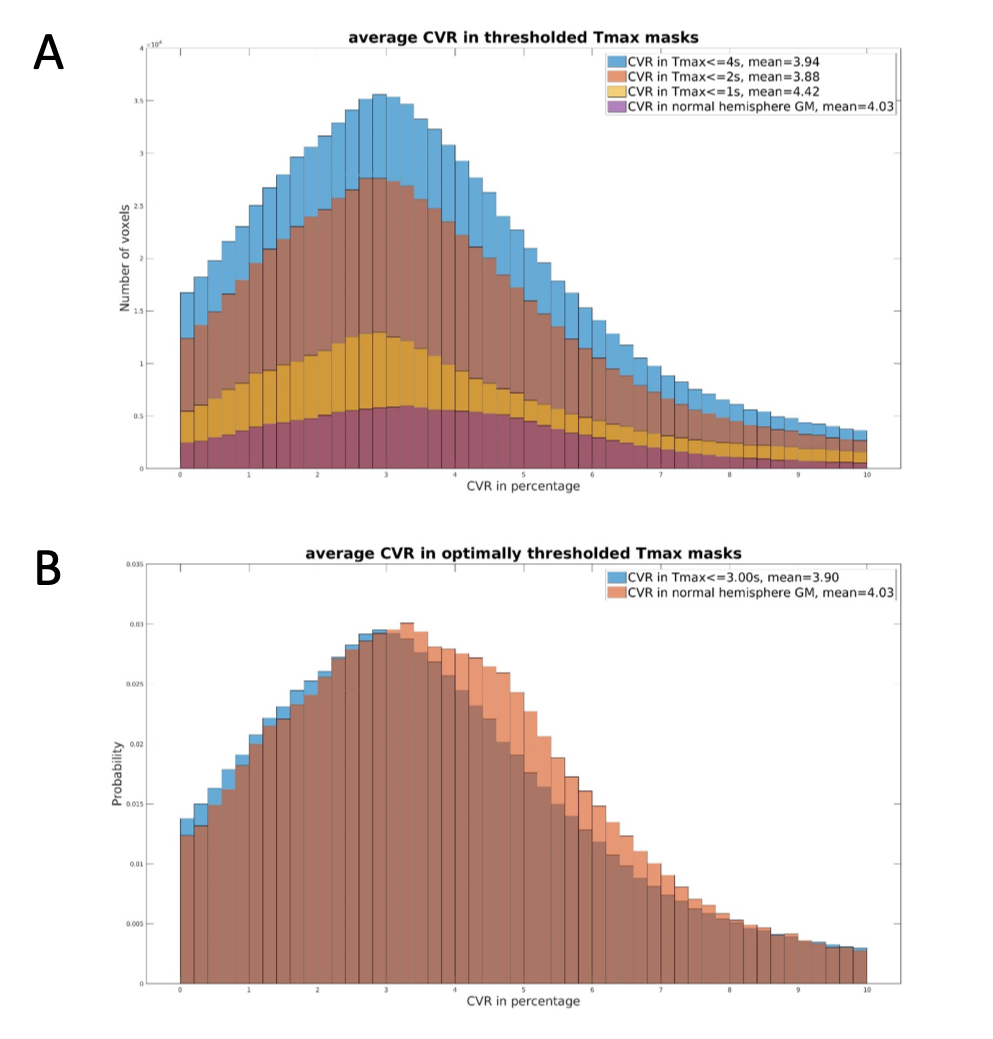
Conventional CVR maps were produced from the first and last one-minute of BOLD data and averaged respectively as BOLDpre and BOLDpost. CVR was calculated as 100*(BOLDpost – BOLDpre)/BOLDpre. DSC perfusion was processed by RAPID (RapidAI, California, USA) to generate time-to-maxima of the residue function (Tmax) and mean-transit-time (MTT). The first 3 minute of the pre-processed BOLD image was detrended and analyzed for TS map using RAPIDTIDE 4. Manual ROIs were placed in the straight sinus as TS reference region. Incremental thresholds were iteratively tested on each parametric map in order to minimize the chi-square distance 5 in CVR histograms relative to normal hemispheric gray matter (GM) histograms, thus optimizing the estimation of normal hemisphere CVR.
One-way ANOVA was performed on the mean CVR in normal hemisphere GM, as well as in the thresholded Tmax, MTT, TS masks to assess differences.
Results
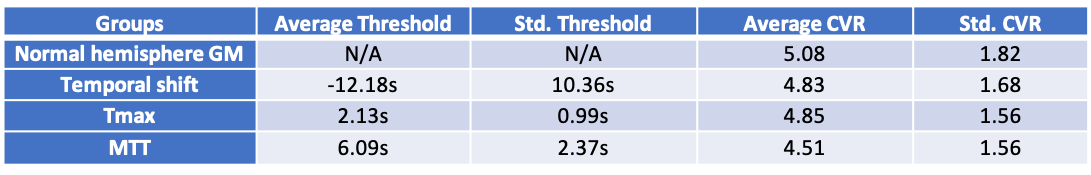
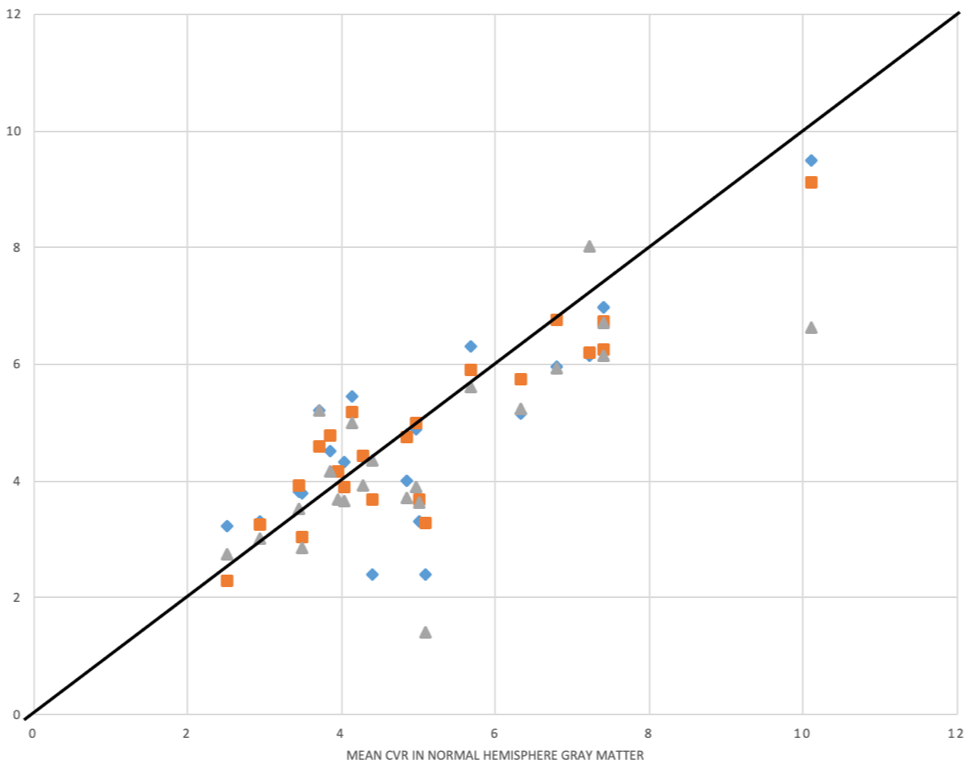
Figure1 illustrates the process of searching for optimal thresholds. The thresholds and the mean CVR of each parametric mask are summarized in Table1. The average CVR in normal hemisphere GM is 5.07%. Optimal threshold for TS was found at an average of -12.18s, and the mean CVR within TS mask is 4.83%. Optimal threshold for Tmax was at 2.13s, which gives a mean CVR 4.85%. MTT reached optimal threshold at 6.09s and the mean CVR is 4.51%. One-way ANOVA test shows there’s no difference in CVR among these 4 groups (F=0.44, p=0.73).Each subject’s mean CVR in thresholded Tmax, MTT and TS masks were plotted against that in normal hemisphere GM as in Figure2. Blue, orange and gray icons represents the CVR in TS, Tmax and MTT masks respectively. The black line represents identity.
Discussion
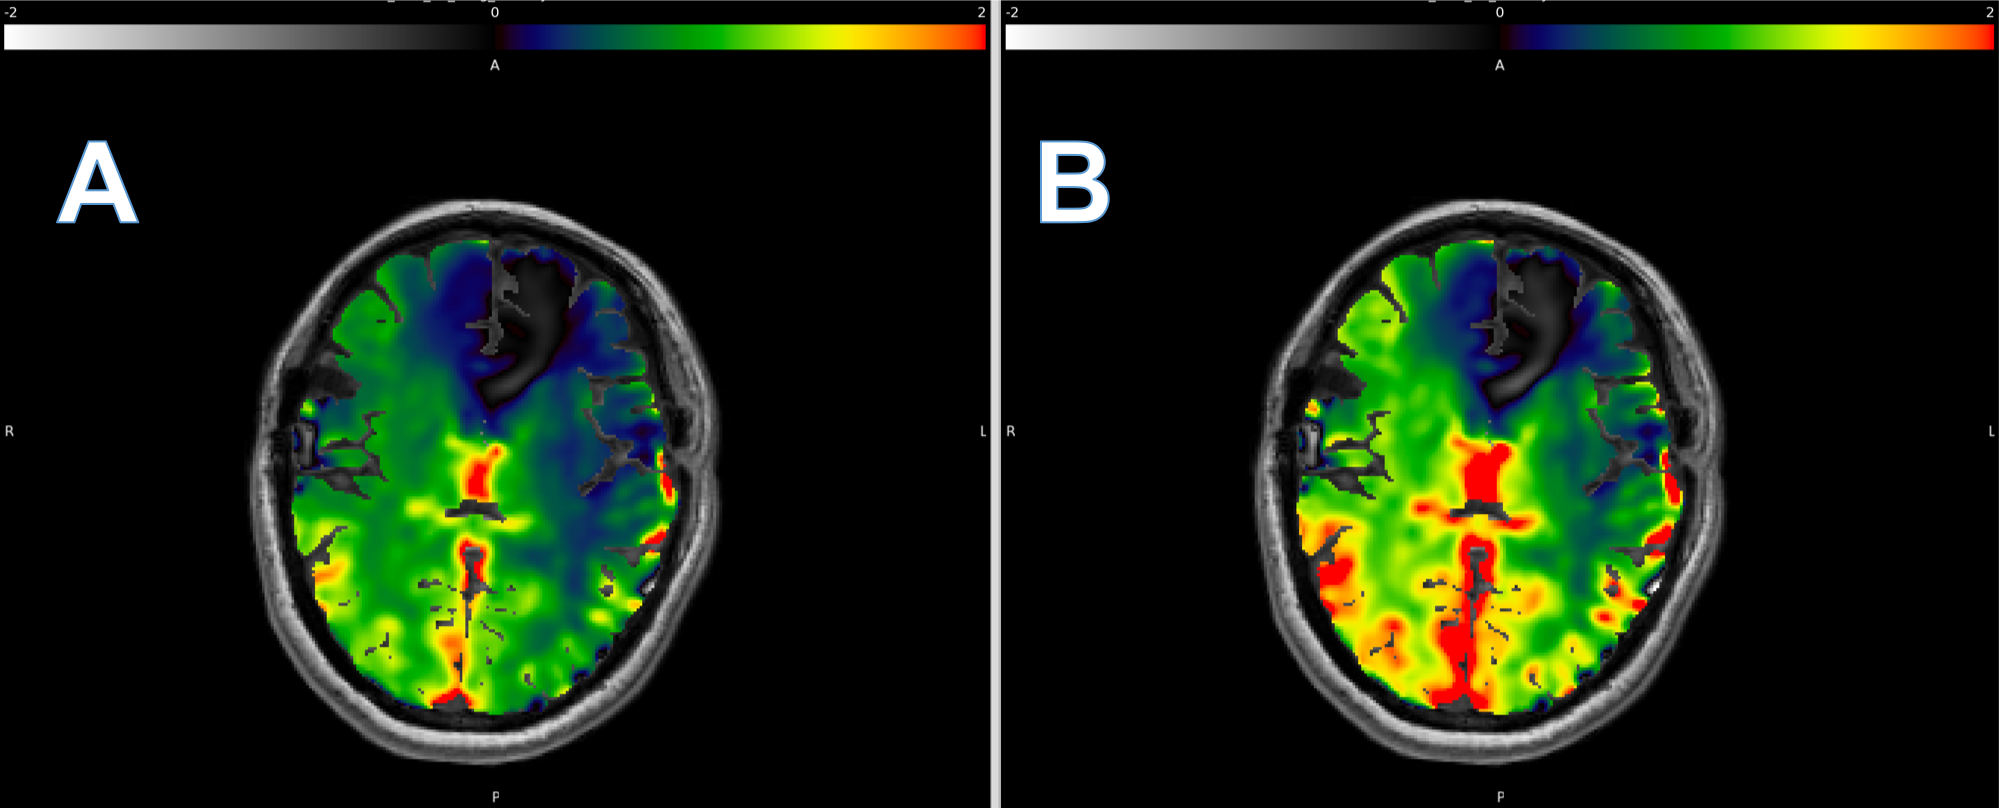
Using average CVR in normal hemisphere GM as the ground truth, we present 3 different parametric masks to achieve a similar mean CVR by minimizing the histogram chi-square distance. DSC perfusion using both Tmax and MTT were tested to incorporate both macrovascular and theoretically microvascular hemodynamic features predicted best to approximate the tissue level features of CVR exhaustion. Mean CVR from each of the 4 masks revealed no difference at the group level, suggesting that even conventional normalization of CVR using normal hemispheres in patients with unilateral disease can perhaps be replaced with average CVR from a well-defined whole brain hemodynamic mask producing a potentially more robust global reference, but most critically facilitating extension of CVR analysis in patients with bihemispheric or ambiguous disease patterns as shown in Figure3.While Tmax and MTT require addition of contrast-enhanced DSC perfusion, TS can be calculated using the baseline signal of BOLD providing a potential approach to auto-calibration. Importantly, the TS and MTT both tend to underestimate the CVR when in excess of 4%, whereupon Tmax shows better performance and consistency across the entire range. A machine learning framework that includes the hemodynamic parametric maps may be well-suited to automate the proposed strategy and is currently being explored.
Conclusion
We present an efficient and readily attainable strategy to identify candidate healthy voxels for relative CVR estimation in patients with multifocal or bihemispheric disease.Acknowledgements
No acknowledgement found.References
1. Wu J, Dehkharghani S, Nahab F, and Qiu D. Acetazolamide-augmented dynamic BOLD (aczBOLD) imaging for assessing cerebrovascular reactivity in chronic steno-occlusive disease of the anterior circulation: An initial experience. NeuroImage: Clinical 13 (2017) 116-122
2. Dogra S, Wang X, Veraart J, et al. A Flexible Computational Framework for Characterization of Dynamic Cerebrovascular Response to Global Hemodynamic Stimuli. ISMRM 2021 In Proc Intl Soc Mag Reson Med 29 (2021)
3. Greve DN, and Fischl B. Accurate and robust brain image alignment using boundary-based registration. Neuroimage 2009;48:63-72
4. Frederick, B, rapidtide [Computer Software] (2016-2021). https://github.com/bbfrederick/rapidtide.
5. Dodge Y. The concise encyclopedia of statistics. Springer Science & Business Media, 2008.
Figures