4904
Parametric ATT and CBF Mapping Using a Three-Dimensional Convolutional Neural Network1Biomedical Engineering, University of California, Davis, CA, United States, 2Radiology, University of California, Davis, CA, United States, 3Radiology, Wake Forest University, Winston-Salem, NC, United States, 4Center for Brain Imaging Science and Technology, College of Biomedical Engineering and Instrumental Science, Zhejiang University, Zhejiang, China, 5Internal Medicine, Wake Forest University, Winston-Salem, NC, United States
Synopsis
A CNN algorithm was proposed to estimate ATT and CBF simultaneously, using multi-TI ASL, acquiring ASL images at multiple PLDs. Hierarchical structure of CNN was used to reduce the estimation error of ATT and CBF. The proposed method successfully estimated ATT and CBF maps using reduced numbers of TIs or averages with a higher accuracy than a conventional non-linear model fitting. The successful estimation of ATT and CBF using our H-CNN may allow a total scan time reduction with a smaller number of TIs or averages and improvements of image quality when a part of acquisition is corrupted.
Introduction
Multi-TI ASL has been used to estimate arterial transit time (ATT) and cerebral blood flow (CBF) more accurately with multiple post labeling delays (PLDs). However, acquiring ASL images at multiple PLDs requires relatively long scan time compared to a single PLD. We propose a hierarchically structured 3-dimensional convolutional neural network (H-CNN) to estimate the ATT and CBF maps from the reduced number of TIs as well as averages.Method
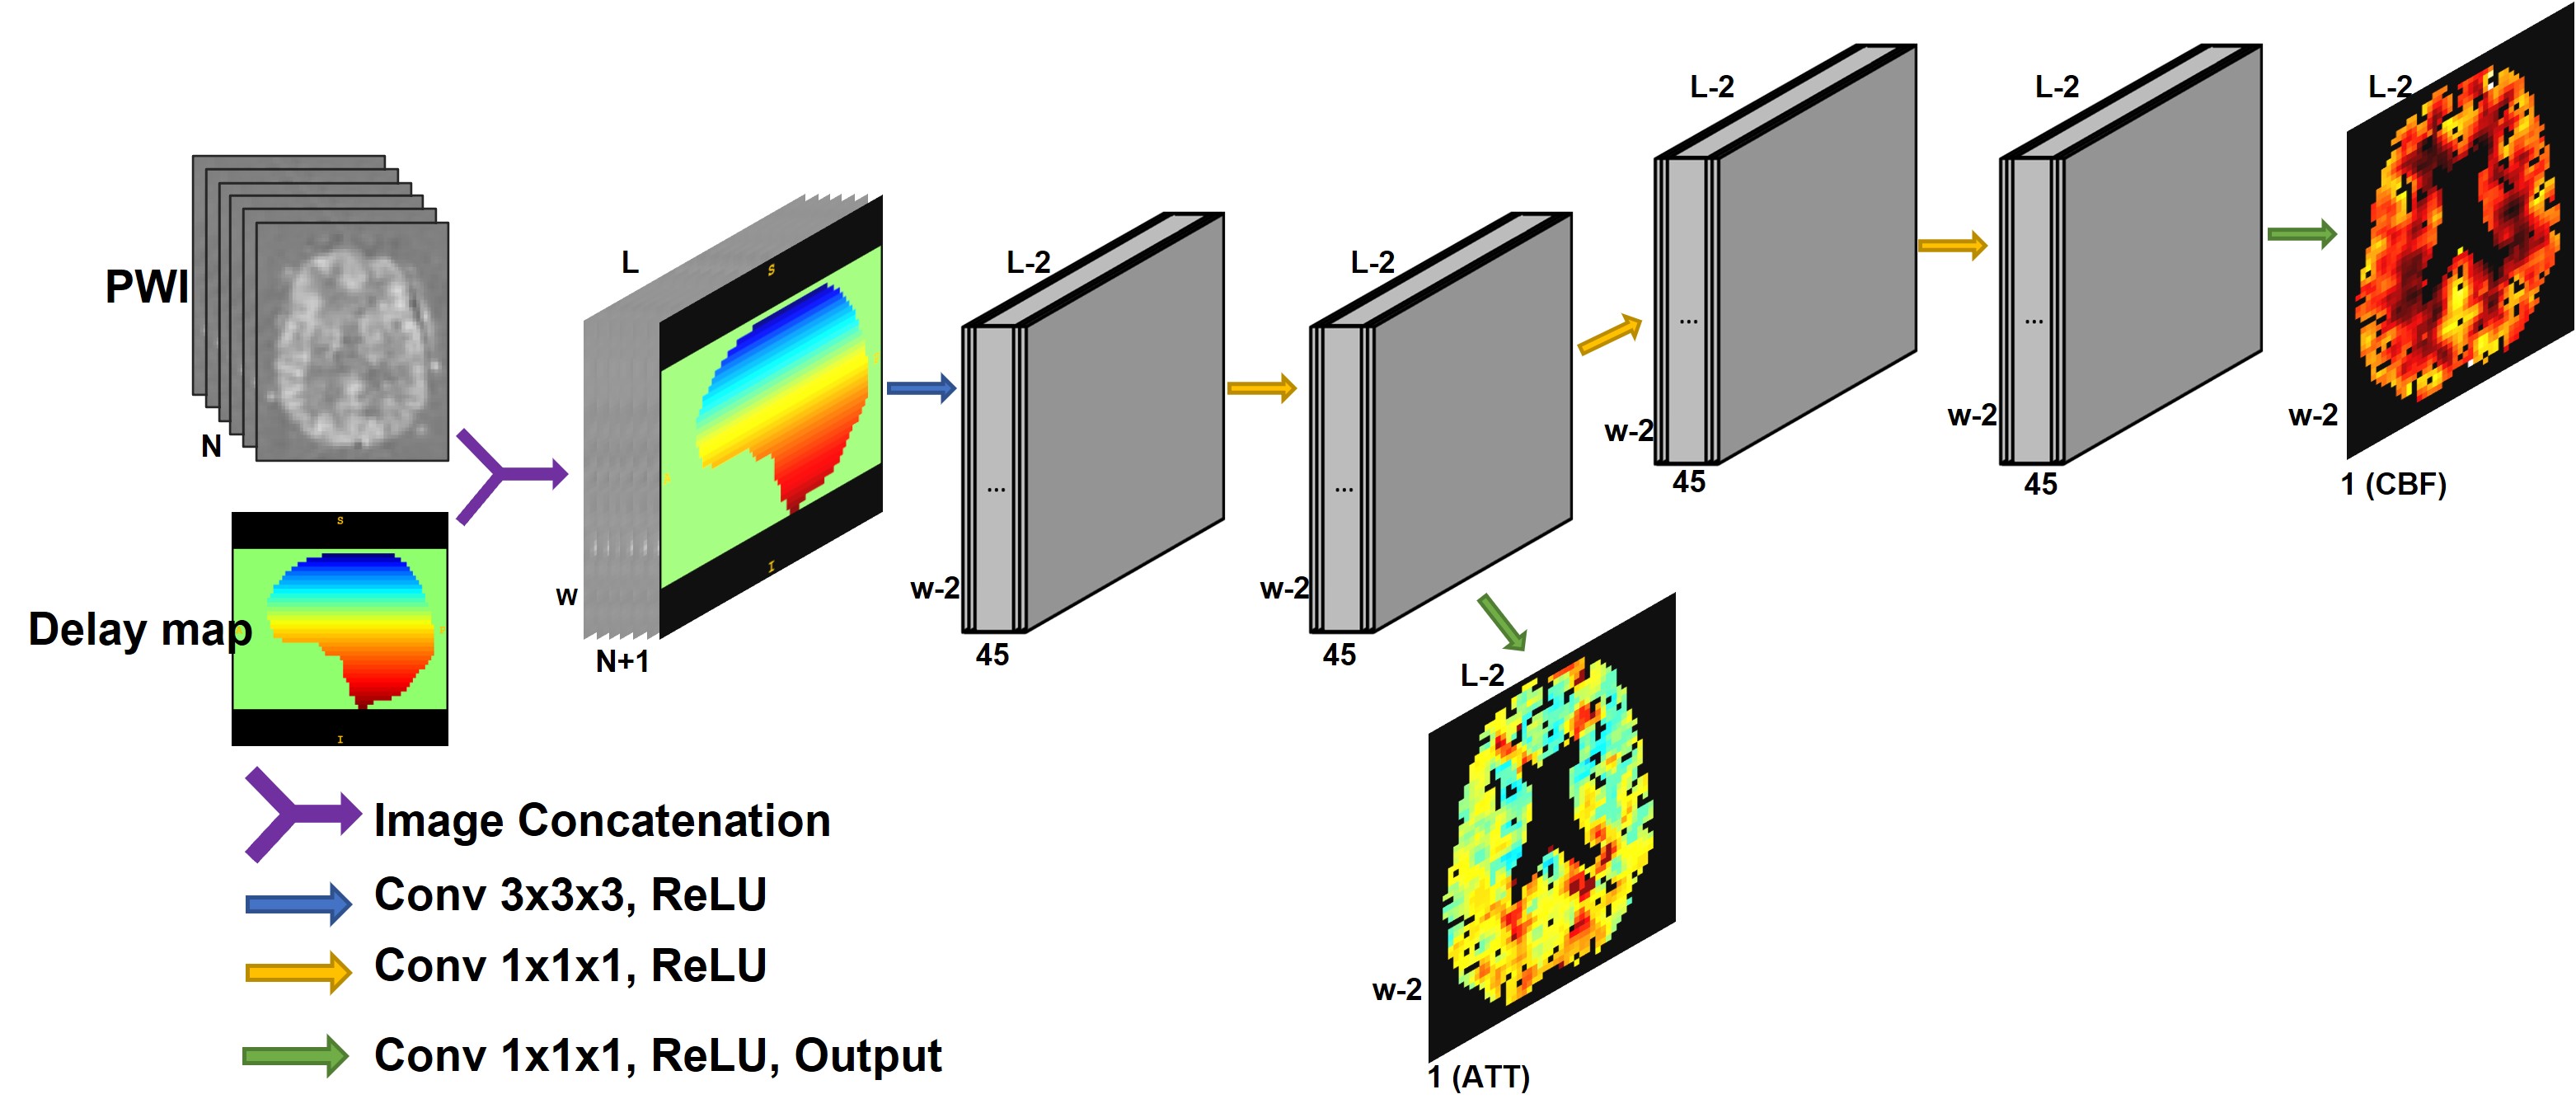
Twelve subjects (age: 68.92±6.87 years, M/F: 3/9) from the Wake Forest Alzheimer’s Disease Research Center without any severe neurological diseases had MRI including a multi-TI PCASL sequence on a 3T Siemens Skyra MRI with a 32-channel head coil (Siemens, Erlangen, Germany). Total 6 TIs were collected from 1800ms, with increments of 600ms and 6 averages per TI. The duration of PCASL labeling was 1800ms except the shortest TI that had 1700ms. Corresponding PLDs were [100ms, 600ms, 1200ms, 1800ms, 2400ms, and 3000ms]. Each TI had minimum TR: [2900ms, 3500ms, 4100ms, 4700ms, 5300ms, and 5900ms]1. The scan time for all six TIs were 5 minutes 21 seconds. A single-shot 2D EPI acquisition was used to cover the whole brain (56x70x36 matrix size, 3x3x4mm resolution, and 27.5ms delay between slices). To create the ground truth reference images for ATT and CBF, a voxel-wise non-linear model fitting was applied using the ASL kinetic model2.Nine randomly chosen subjects were used for training and the remaining 3 were used for testing. Since CBF is dependent on ATT in the model, ATT and CBF were estimated hierarchically (Figure 1). ATT was estimated from the partially shared layers using common features between ATT and CBF. The specific features or biases of CBF were learned through the deep layers. A 3D image that contains slice timing delay information was concatenated with the input perfusion weighted image (PWI) image for a slice timing correction in the H-CNN. To test if the reduced number of TIs can be recovered in the H-CNN, the PWI with the reduced number of TIs was used for the training. To avoid any bias for choosing TIs, all combinations of TIs were tested. The non-linear model fitting with the reduced number of TIs was also performed to compare the estimation errors between the fitting and the H-CNN. Additional testing was performed if the reduced number of averages can be recovered in the H-CNN. First N averages were sequentially chosen for the average reduction test. The root mean square error (RMSE) was used as a primary evaluation metric to compare the estimated measure to its reference images. To choose the ideal combination of TIs, the overall RMSEs of ATT and CBF were normalized to their maximum values in that ATT and CBF have different physiological values. TI combinations that provided minimum RMSEs of the normalized ATT and CBF from the model fitting were selected.
Results
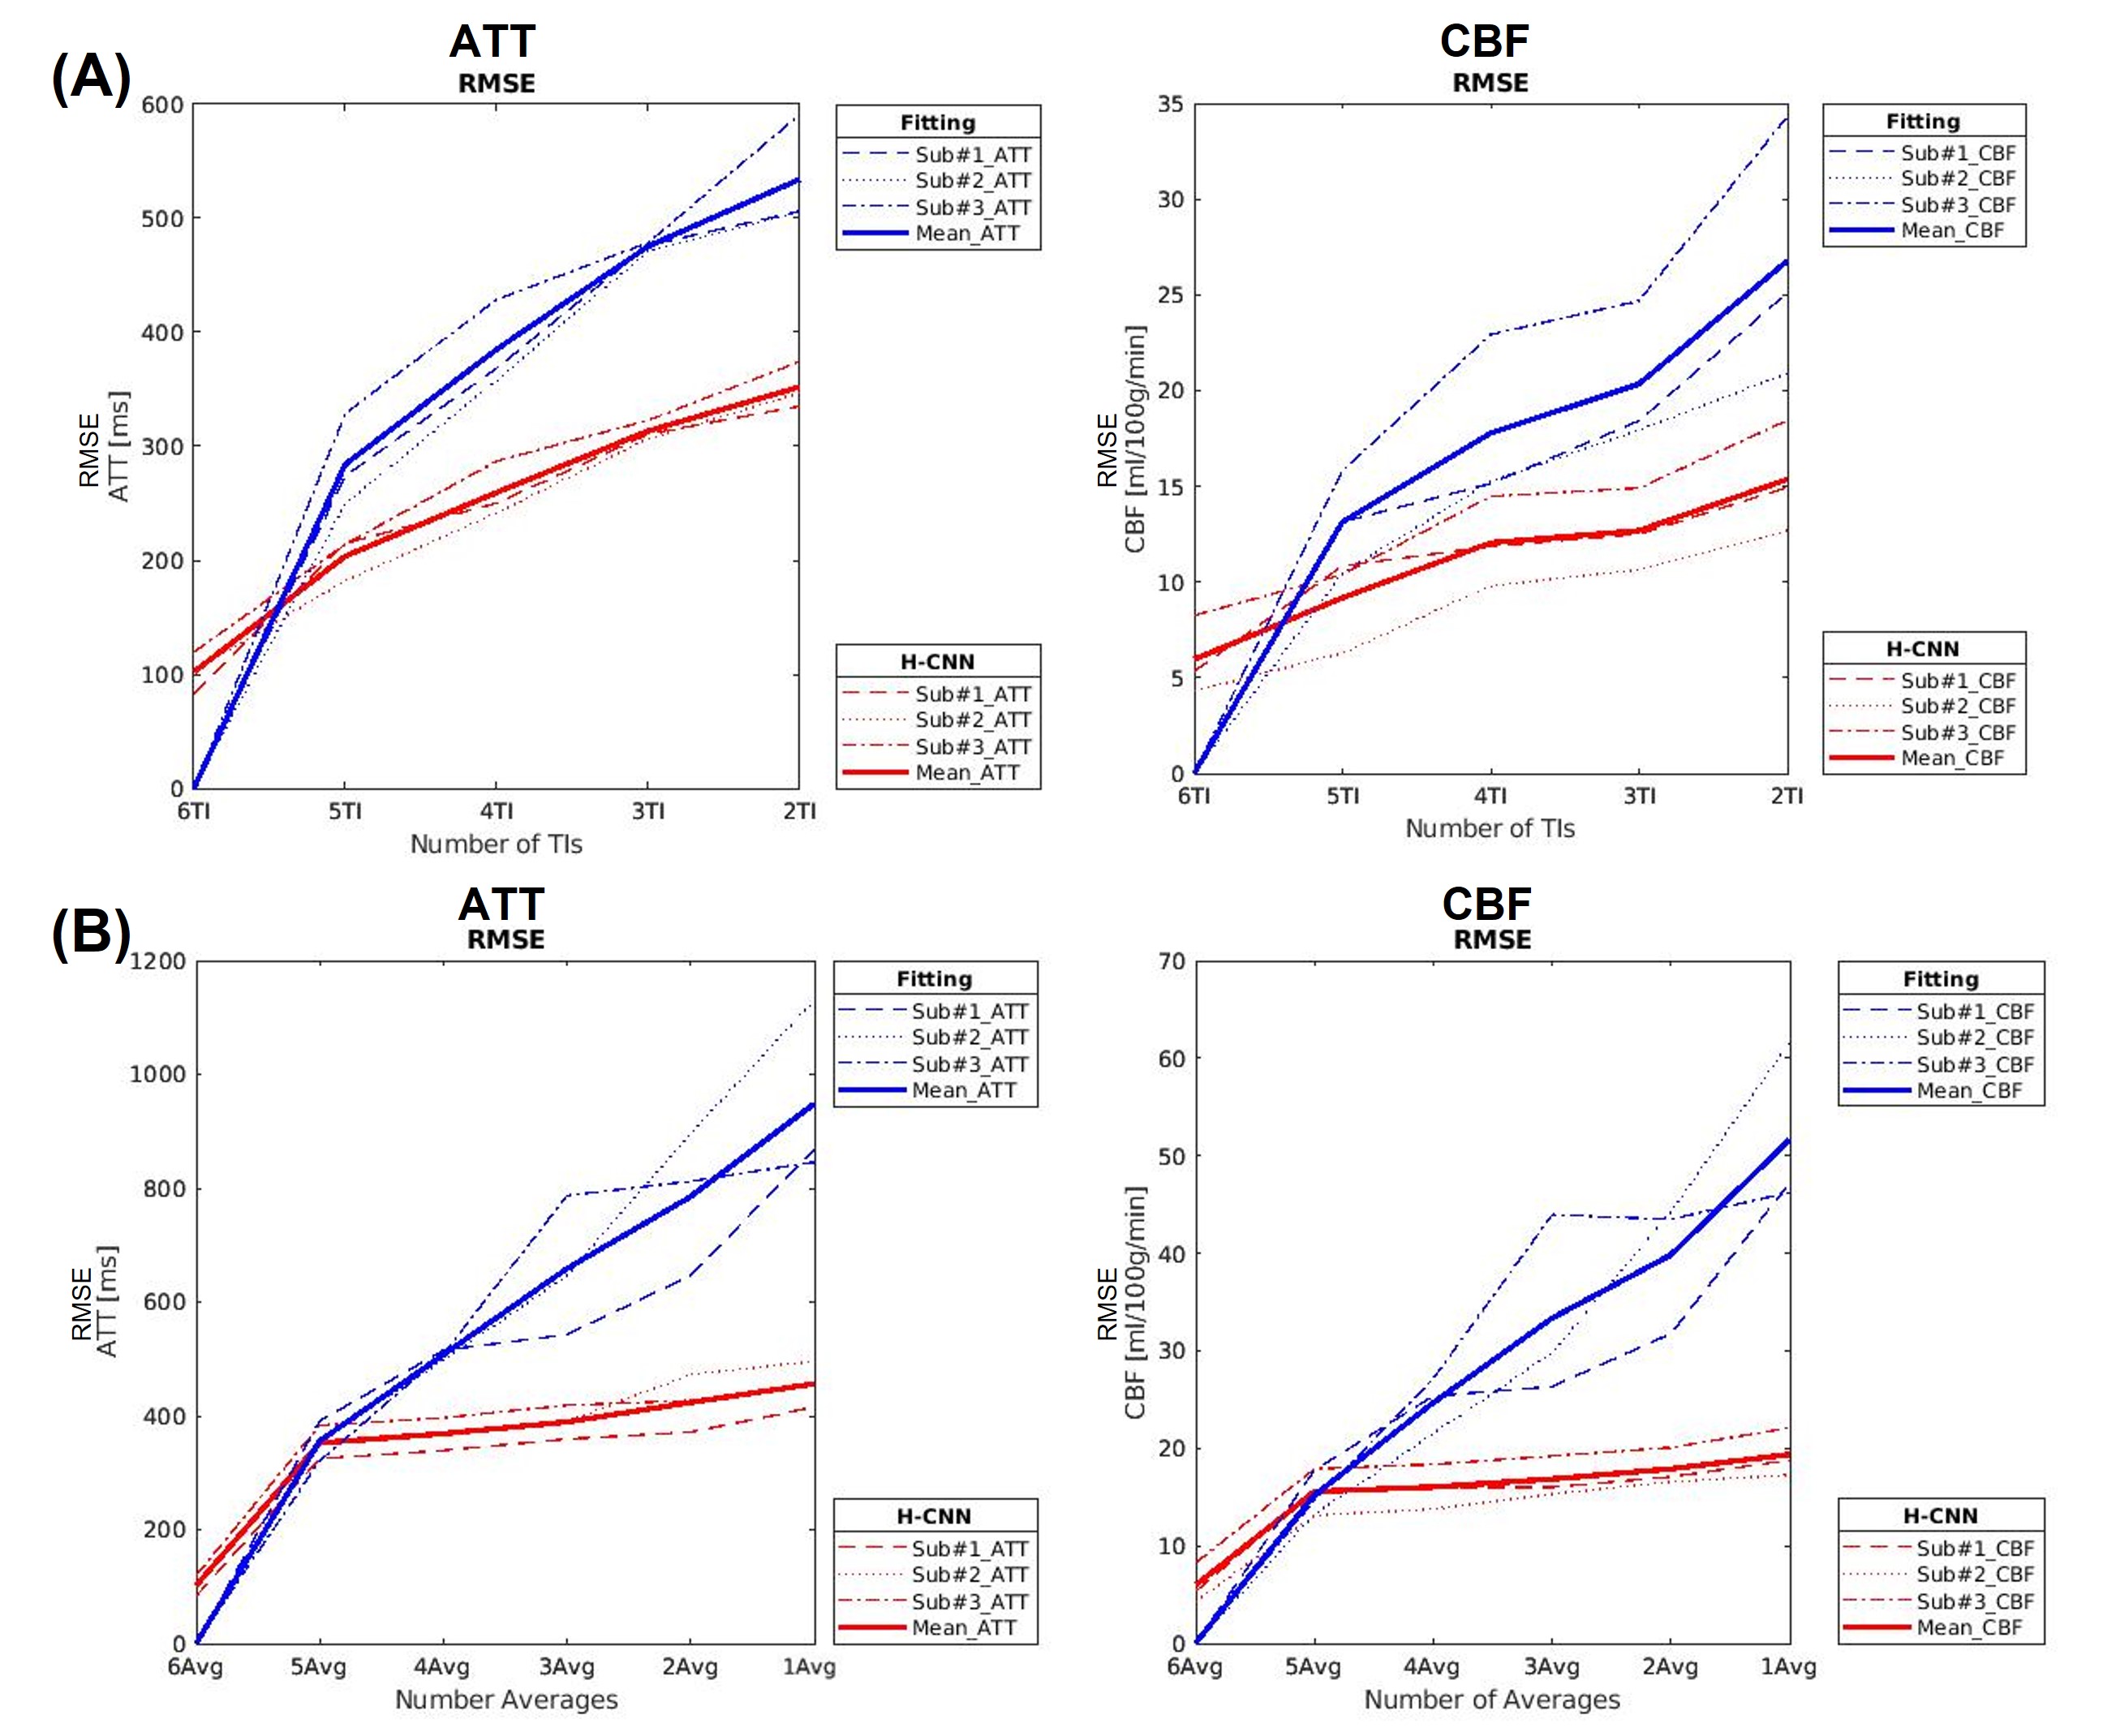
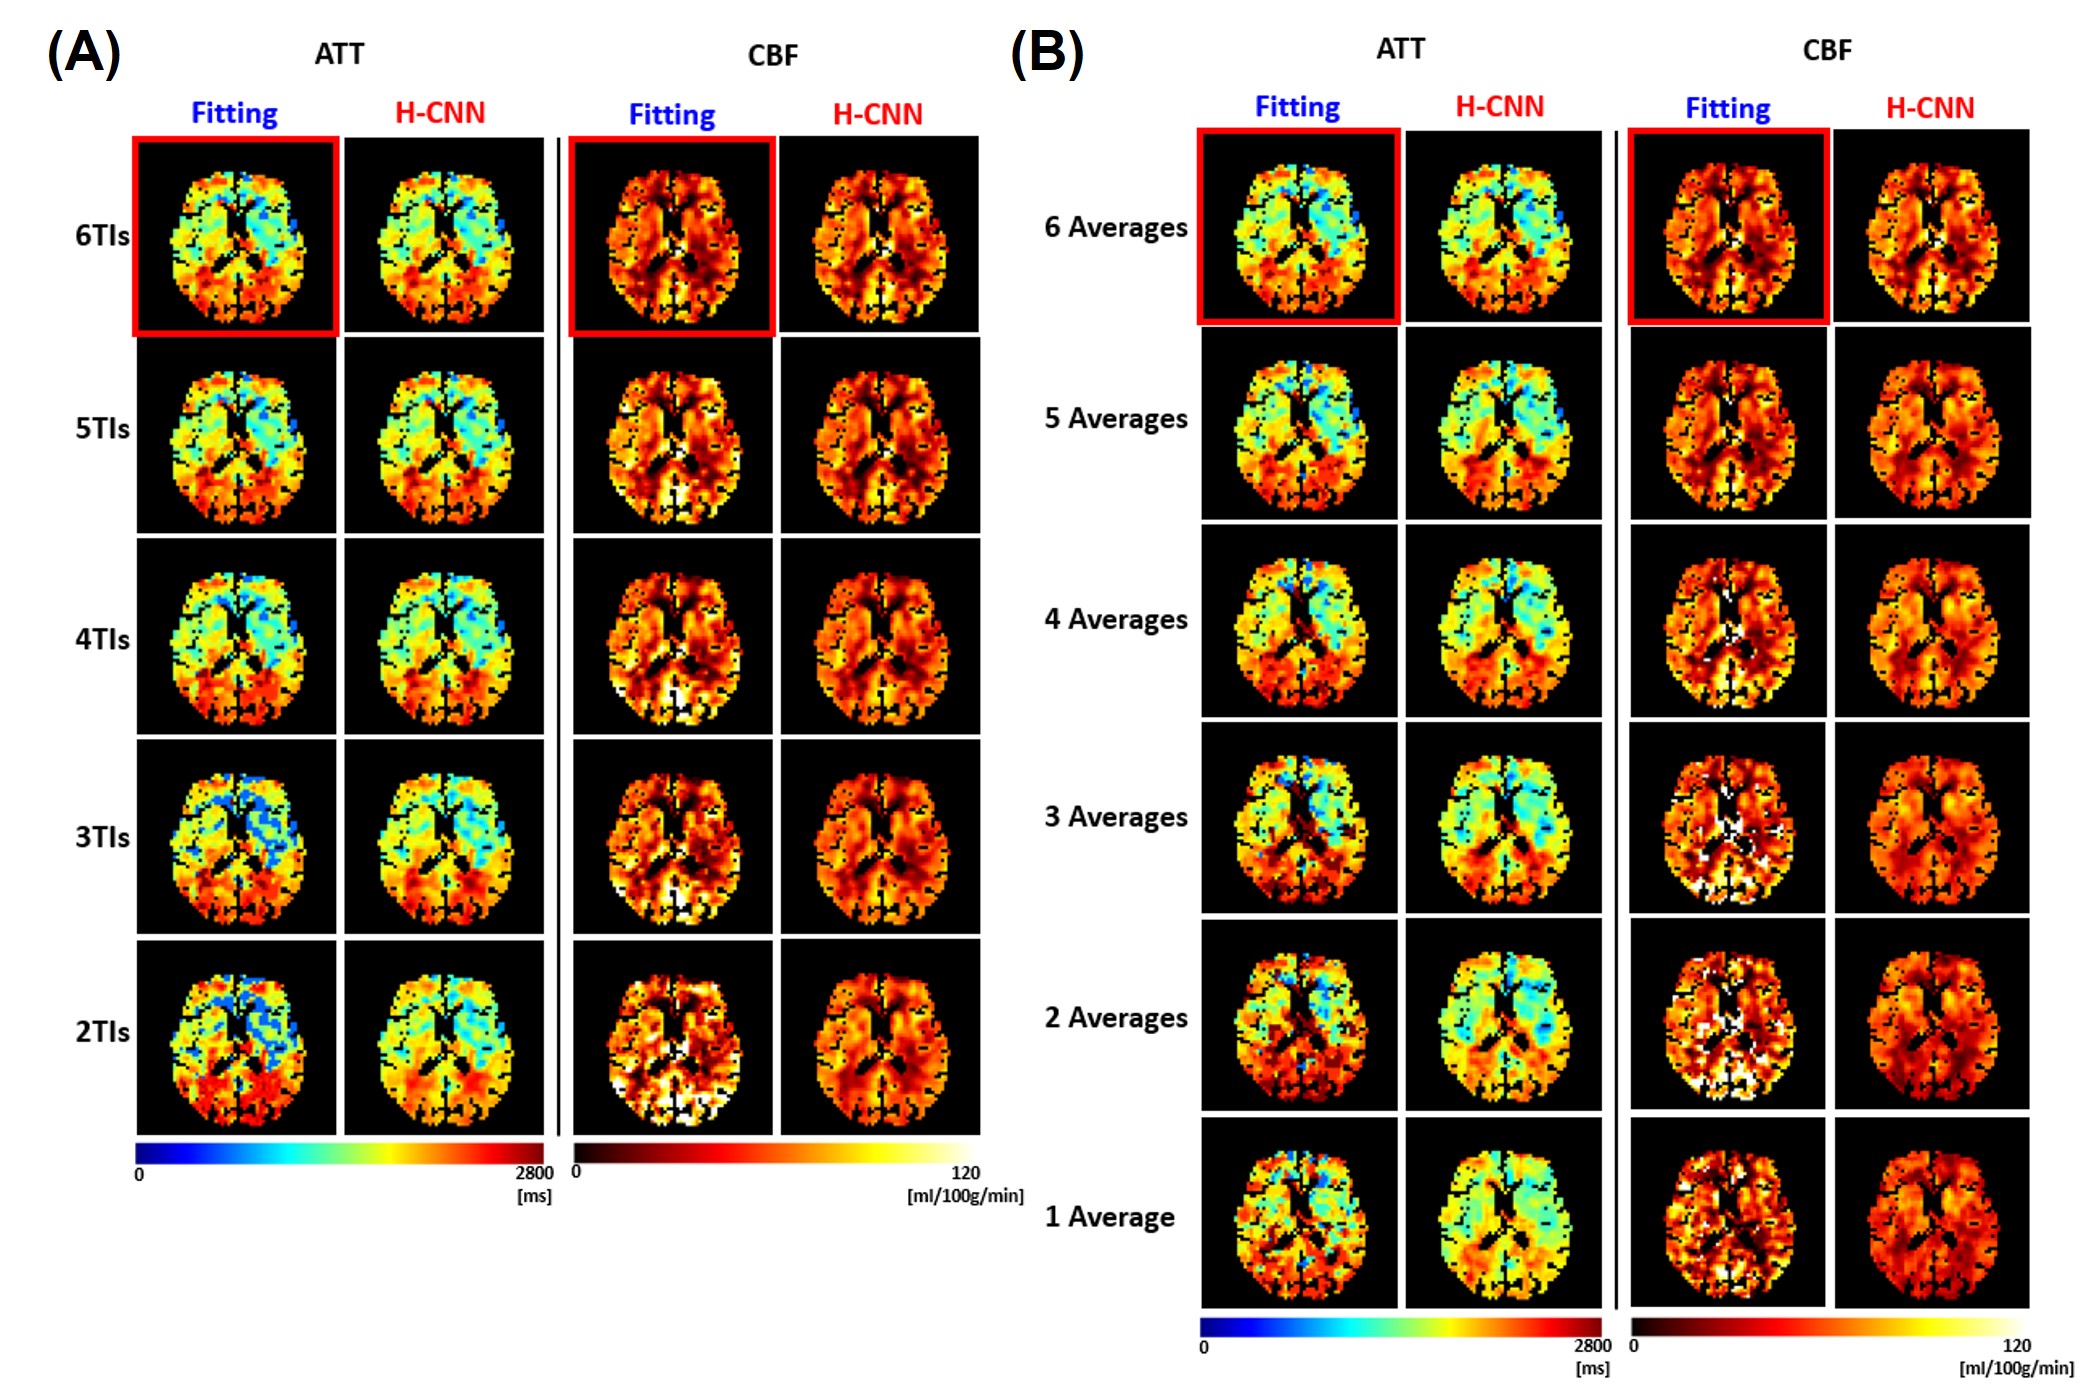
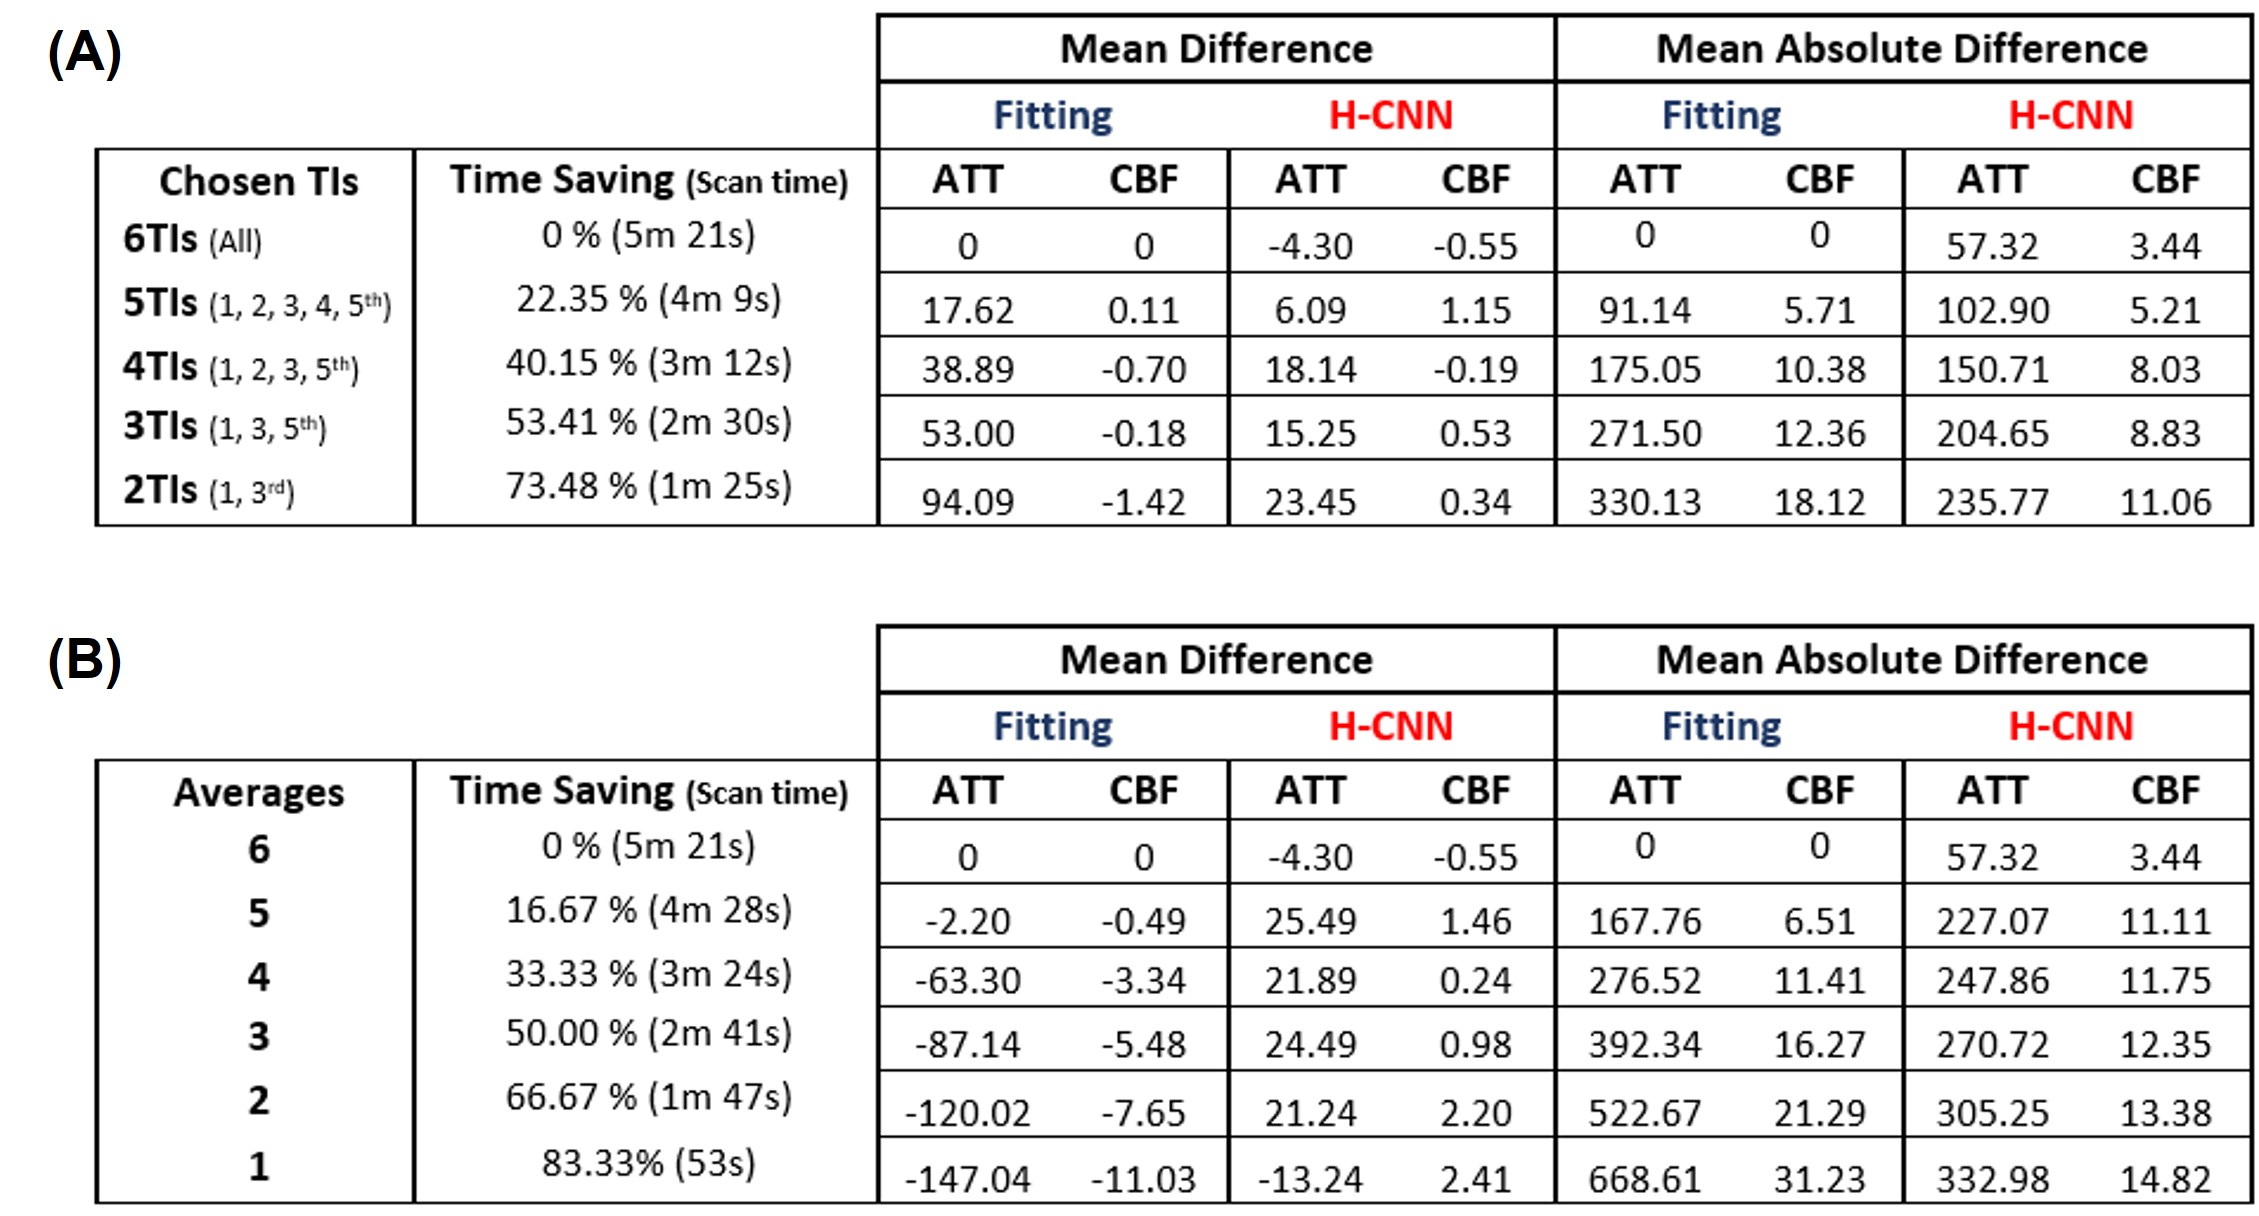
Based on the overall RMSEs of the non-linear model fitting and H-CNN with the reduced numbers of TIs or averages, our H-CNN outperforms the model fitting method when the number of TIs or averages were reduced (Figure 2). The reduction of number of averages produced larger errors on ATT and CBF than the reduction of TIs. Figure 3 shows the estimated ATT and CBF maps of one of the test subjects using the nonlinear model fitting and the H-CNN with the different numbers of TIs or averages. The reported subject has been selected due to the longest mean ATT among three test subjects, which is more challenging to estimate ATT and CBF in practice. Total scan time reduction by the reduced number of TIs or averages was calculated as the percent difference between theoretical total scan time compared to the full dataset (6 TIs and 6 averages) in Table 1. The mean difference and mean absolute difference were also addressed in Table 1.Discussion
A H-CNN model with an implementation of slice timing delay information was developed to estimate ATT and CBF from multi-TI PCASL with the reduced number of TIs or averages. The proposed method showed a higher estimation accuracy than the non-linear model fitting with reduced TIs or averages. In conclusion, the reported results showed that a smaller number of PLDs or averages can be used in the processing without significant discrepancy from the reference, which may allow a total scan time reduction of multi-TI PCASL scheme. Furthermore, in some cases, different TI combinations in H-CNN showed better estimation accuracies than the chosen TIs in this study. Therefore, this study may have a potential that provides the ideal choices of TIs. Additionally, based on the estimation errors from the reduced averages, 6 averages may be optimum average required in this acquisition scheme, but this work shows that less averages can be used in the processing to improve image quality when a part of acquisition is motion corrupted. Note that two different CNN approaches were also tested: one that estimates ATT and CBF simultaneously with shared layers and a hybrid method that estimates CBF using the non-linear fitting with the estimated ATT from a CNN. The H-CNN outperformed the other CNN methods in respect to the overall RMSEs and mean absolute errors.Acknowledgements
This work was supported by the Wake Forest Alzheimer’s Disease Research Center (NIH P30 AG049638) and an NIH Research grant (RF1 NS110043).References
1. Johnston, Megan E., et al. Multi-TI arterial spin labeling MRI with variable TR and bolus duration for cerebral blood flow and arterial transit time mapping. IEEE transactions on medical imaging 2015;34(6): 1392-1402.
2. Buxton, Richard B., et al. A general kinetic model for quantitative perfusion imaging with arterial spin labeling. Magnetic resonance in medicine 1998;40(3):383-396.
Figures