4900
On the optimization of 3D inflow-based vascular-space-occupancy (iVASO) MRI for the quantification of arteriolar cerebral blood volume (CBVa)1Biomedical Engineering, Johns Hopkins University, Baltimore, MD, United States, 2Neurosection, Division of MRI Research, Russell H. Morgan Department of Radiology and Radiological Science, Johns Hopkins University School of Medicine, Baltimore, MD, United States, 3F.M. Kirby Research Center for Functional Brain Imaging, Kennedy Krieger Institute, Baltimore, MD, United States, 4Division of Neuroradiology, Russell H. Morgan Department of Radiology and Radiological Science, Johns Hopkins University School of Medicine, Baltimore, MD, United States, 5Department of Neurosurgery, Johns Hopkins University School of Medicine, Baltimore, MD, United States
Synopsis
The iVASO MRI is a noninvasive approach for quantitative mapping of CBVa in the brain. It was originally developed in the single-slice mode. Recently, CBVa measured by single-slice iVASO has been validated using histological markers of arteriolar blood vessels in a mouse model. Here, we demonstrate an optimized 3D iVASO MRI protocol with a 3D turbo-field-echo (TFE) readout and a whole-brain coverage. It showed consistent CBVa measures when compared to the original single-slice iVASO. In 3D-TFE-iVASO, the imaging slab volume did not show significant effects on the measured CBVa values. CBVa measured with 3D-TFE-iVASO showed reasonable intra-subject reproducibility.
Introduction
The inflow-based vascular-space-occupancy (iVASO)1-6 MRI is a noninvasive approach for the measurement of cerebral-blood-volume in small pial arteries and arterioles (CBVa). In iVASO, CBVa is calculated from the difference signal between an arterial blood nulled image and a control image without blood nulling. To account for the heterogeneity of vascular transit times, images are acquired at multiple post-inversion times (TI), from which absolute CBVa can be quantified2. The arterial origin is confirmed experimentally by measuring the T2 of the difference signal in iVASO2, as arterial blood T2 is distinct from that of venous blood, extravascular tissue and CSF. The iVASO method has been applied in several brain diseases6-14. The iVASO MRI was originally developed in the single-slice mode using a gradient-echo (GRE) echo-planar-imaging (EPI) readout1-6. Recently, CBVa measured by single-slice iVASO has been validated using histological markers of arteriolar blood vessels in a mouse model10. The iVASO method was later expanded to a three-dimensional (3D) mode covering most of the brain11-14. A 3D turbo-field-echo (TFE) was adopted as the readout for 3D-iVASO, which has less signal dropout and geometric distortion compared to the previously used EPI sequence15. In this study, we aim to optimize 3D-iVASO MRI and evaluate it by comparing the results with the original single-slice iVASO. An improved numerical fitting algorithm was implemented for the quantitative analysis of CBVa, and two 3D-iVASO protocols with different coverage (imaging slab volume) were evaluated. Reproducibility of 3D-iVASO MRI was evaluated.Method
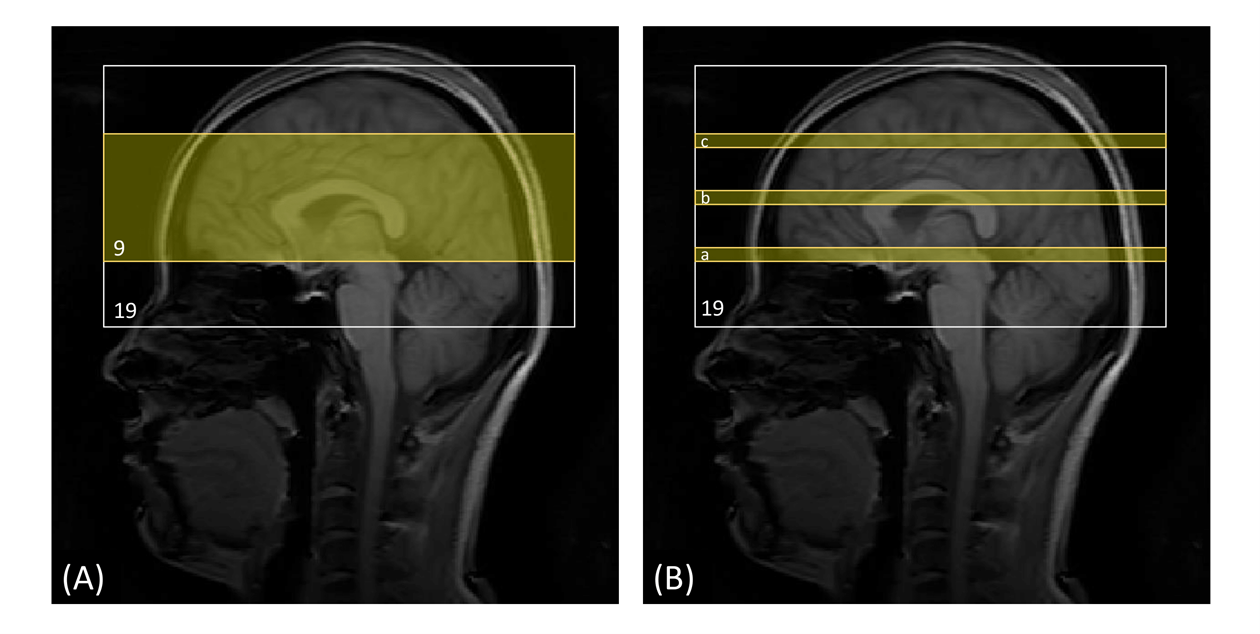
Five healthy subjects (age=27.2±4.4 years; gender=2F/3M) were scanned on a 3T Philips MRI scanner. The following scans were performed in each participant: (1) 3D-TFE whole-brain iVASO: voxel=3x3x6mm3; 19 slices; flip-angle=20°; TR/TI=403/191, 600/277, 800/360, 1000/437, 1500/611, 2000/757, 2700/921, 3500/1059ms; 4 nulling/control pairs in each TI; TE=1.7ms; shot number=5; readout echo-train length=108.8ms; TFE-factor=29; Compressed Sensing-Sensitivity Encoding (CS-SENSE)=7; partial-Fourier=0.8; turbo-direction=radial. A reference scan (TR=20000ms, others the same as iVASO) through the ventricle was acquired to calculate the scaling factor M02. (2) 3D-TFE partial-brain iVASO: 9 slices; shot number=2; other parameters the same as (1). The center of the partial-brain volume was aligned with that of the whole-brain iVASO scan. (3) 2D-GRE-EPI single-slice iVASO: flip-angle=20°; TE=25ms; SENSE(AP)=2; and voxel and TR/TI the same as those in 3D iVASO scans. Three sets of single-slice scans were performed at three different locations corresponding the 6th, 10th (middle) and 14th slices in the whole-brain 3D-iVASO scans (Figure 1). (4) MPRAGE: TR/TE/TI=8.1/3.7/749ms; CS-SENSE=8; voxel=1x1x1mm3; 150 slices. (5) A low-resolution MPRAGE with the same resolution and coverage as the whole-brain 3D-iVASO scan to assist the alignment between iVASO and MPRAGE. Note that in all three 3D and 2D iVASO scans, the flip-back slab was kept identical (thickness=126mm). For each participant, the same whole-brain 3D-iVASO scan was repeated within 2 weeks after the initial scan to evaluate its reproducibility.Data analysis was performed using the SPM12 software and in-house MATLAB scripts. The surrounding subtraction method16 was used to calculate the difference signals between the nulled and control images in iVASO. A voxel-by-voxel fitting was conducted to calculate CBVa maps from the multi-TI iVASO difference signal using the Metropolis-Hastings algorithm17,18. Compared to the commonly used least-square algorithm, the Metropolis-Hastings algorithm is more suitable and robust for data with relatively low signal-to-noise ratio (SNR) such as iVASO, arterial spin labeling (ASL)19, and diffusion MRI20-22. Six regions-of-interest (ROI: grey matter (GM), white matter (WM), cuneus, precentral gyrus, postcentral gyrus, dorsal anterior cingulate cortex (ACC)) were identified on the anatomical images using MRICloud23-25 and mean CBVa values were recorded in each ROI. To compare results from the three different iVASO protocols, paired Wilcoxon test was performed in each region. Coefficient of variation (CV) was computed to assess the scan-rescan reproducibility of the repeated scans, which is defined as the standard deviation of the difference between scan and rescan divided by the average signal intensity in each ROI26.
Results
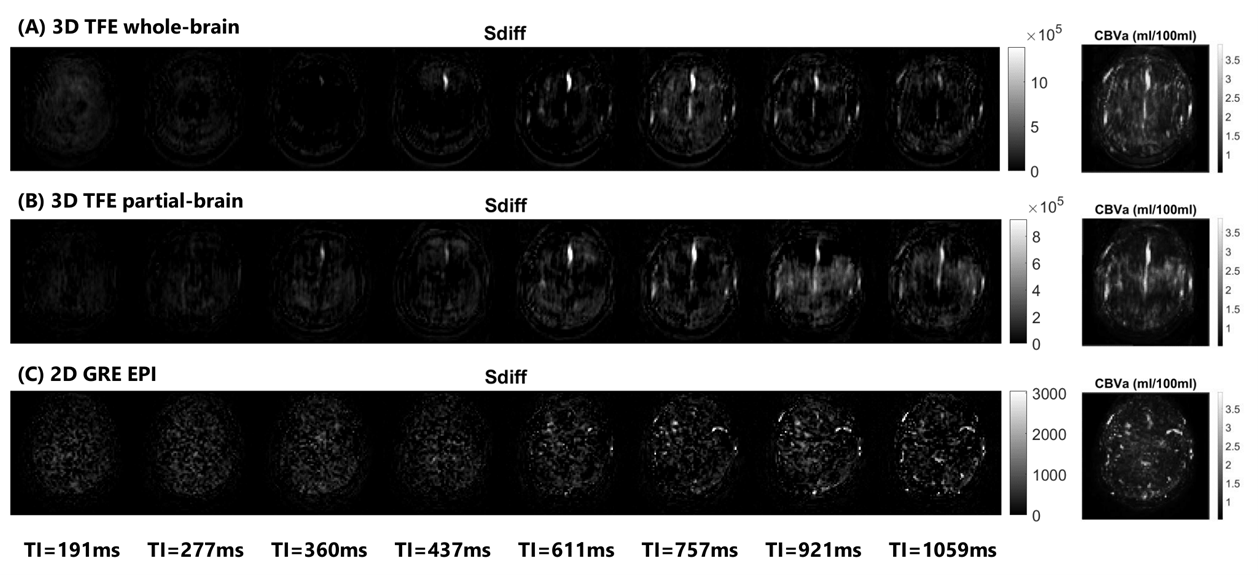
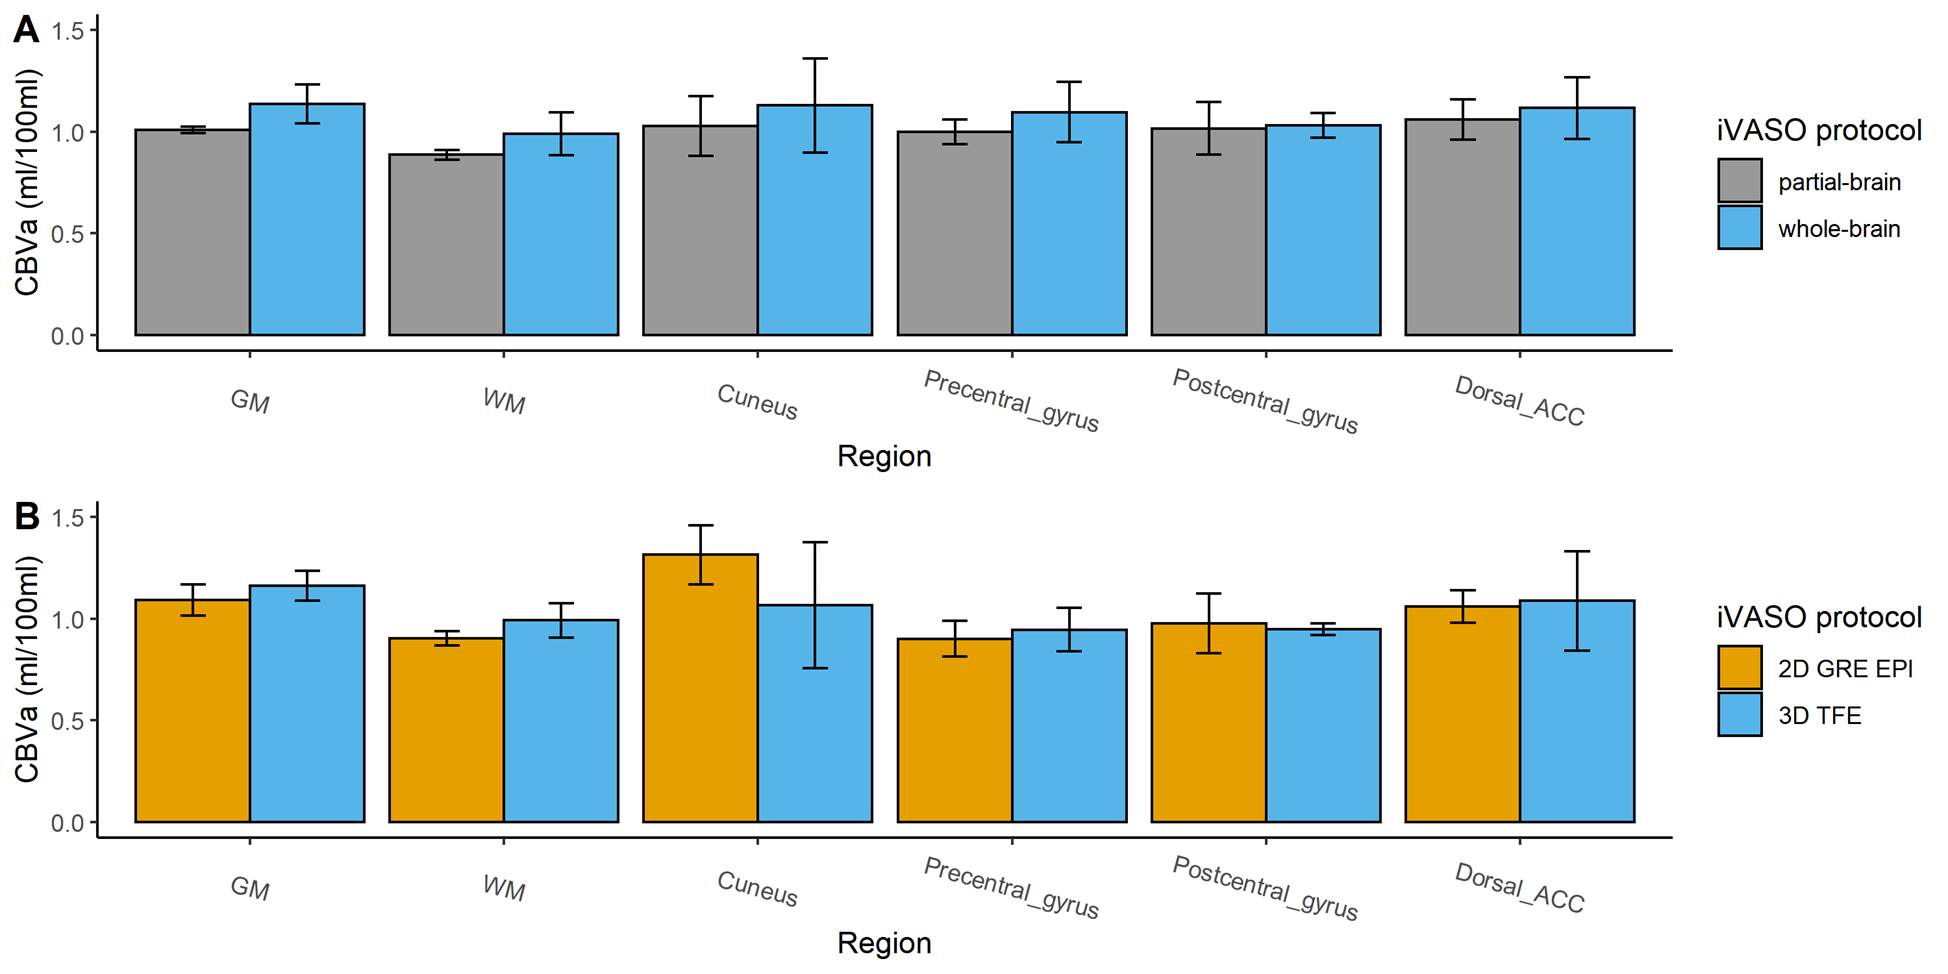
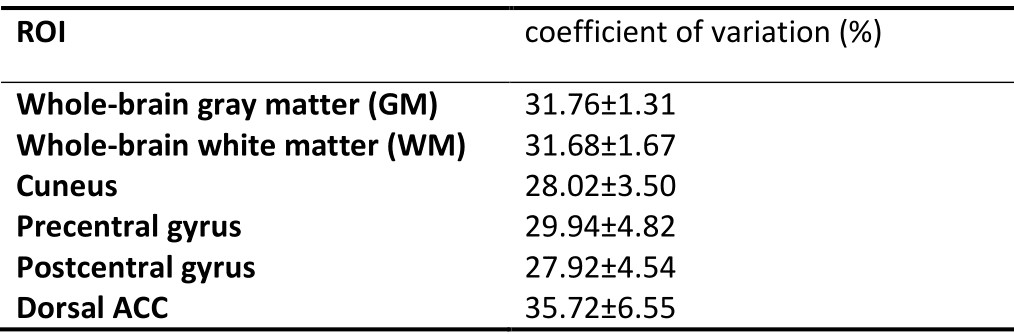
Figure 2 shows the representative images of the difference signals in iVASO (Sdiff) at each TI and the fitted CBVa map from the whole-brain and partial-brain 3D-iVASO scans and the single-slice iVASO scan. Quantitative results of the fitted CBVa from the three iVASO protocols are compared in each ROI in Figure 3. No significant difference was observed between the two 3D-iVASO scans, and between the 3D whole-brain and 2D single-slice iVASO scans. Reproducibility of CBVa measured by the whole-brain 3D-iVASO MRI scan is shown in Table 1.Discussion & Conclusion
We demonstrate an optimized 3D-iVASO MRI protocol with a 3D-TFE readout and a whole-brain coverage. It shows consistent CBVa measures when compared to the original single-slice iVASO scan. The single-slice iVASO is used as a gold standard here as it has recently been validated using histological markers of arterioles in a mouse model10. In 3D-TFE-iVASO, the imaging slab volume did not show significant effects on the measured CBVa values. Therefore, this 3D-iVASO protocol can be tailored to different coverage for various applications. The CBVa values measured with the 3D-TFE-iVASO showed reasonable intra-subject reproducibility. Results from this technical study will serve as the basis for future clinical studies applying iVASO MRI in various brain diseases.Acknowledgements
This study is supported by DoD (PD160104), NINDS (1R01NS108452), NIA (1R01AG064093), NIBIB (P41EB031771), and NICHD (U54 HD079123).References
1. Hua J, Qin Q, Donahue MJ, Zhou J, Pekar JJ, van Zijl PC. Inflow-based vascular-space-occupancy (iVASO) MRI. Magn Reson Med. Jul 2011;66(1):40-56.
2. Hua J, Qin Q, Pekar JJ, Zijl PC. Measurement of absolute arterial cerebral blood volume in human brain without using a contrast agent. NMR Biomed. May 24 2011;24(10):1313-1325.
3. Hua J, Qin Q, Donahue MJ, Zhou J, Pekar J, van Zijl PCM. Functional MRI Using Arteriolar Cerebral Blood Volume Changes. 2009:12.
4. Hua J, Qin Q, Pekar J, van Zijl PCM. Measuring Absolute Arteriolar Cerebral Blood Volume (CBVa) in Human Brain Gray Matter (GM) without Contrast Agent. 2009:5314.
5. Donahue MJ, MacIntosh BJ, Sideso E, et al. Absolute cerebral blood volume (CBV) quantification without contrast agents using inflow vascular-space-occupancy (iVASO) with dynamic subtraction. 2009:628.
6. Donahue MJ, Sideso E, MacIntosh BJ, Kennedy J, Handa A, Jezzard P. Absolute arterial cerebral blood volume quantification using inflow vascular-space-occupancy with dynamic subtraction magnetic resonance imaging. J Cereb Blood Flow Metab. Jul 2010;30(7):1329-42.
7. Hua J, Liu P, Kim T, et al. MRI techniques to measure arterial and venous cerebral blood volume. Neuroimage. Feb 16 2018;doi:10.1016/j.neuroimage.2018.02.027
8. Wu Y, Agarwal S, Jones CK, et al. Measurement of arteriolar blood volume in brain tumors using MRI without exogenous contrast agent administration at 7T. J Magn Reson Imaging. Nov 2016;44(5):1244-1255. doi:10.1002/jmri.25248
9. Hua J, Unschuld PG, Margolis RL, van Zijl PC, Ross CA. Elevated arteriolar cerebral blood volume in prodromal Huntington's disease. Mov Disord. Mar 2014;29(3):396-401. doi:10.1002/mds.25591
10. Liu H, Zhang C, Xu J, et al. Huntingtin silencing delays onset and slows progression of Huntington's disease: a biomarker study. Brain. May 27 2021;doi:10.1093/brain/awab190
11. Hua J, Lee S, Blair NIS, et al. Increased cerebral blood volume in small arterial vessels is a correlate of amyloid-beta-related cognitive decline. Neurobiol Aging. Jan 10 2019;76:181-193. doi:10.1016/j.neurobiolaging.2019.01.001
12. Paez A, Gu C, Rajan S, et al. Differential changes in arteriolar cerebral blood volume between Parkinson’s disease patients with normal and impaired cognition and individuals with mild cognitive impaired (MCI) due to Alzheimer’s disease– an exploratory study. Tomography. 2020;
13. Hua J, Lee S, Blair NIS, et al. Reduced Grey Matter Arteriolar Cerebral Blood Volume in Schizophrenia. 2015:
14. Hua J, Brandt AS, Lee S, et al. Abnormal Grey Matter Arteriolar Cerebral Blood Volume in Schizophrenia Measured With 3D Inflow-Based Vascular-Space-Occupancy MRI at 7T. Schizophrenia bulletin. Aug 18 2016;43:620-632. doi:10.1093/schbul/sbw109
15. Hua J, Jones CK, Qin Q, van Zijl PC. Implementation of vascular-space-occupancy MRI at 7T. Magn Reson Med. Apr 2013;69(4):1003-13. doi:10.1002/mrm.24334
16. Lu H, Donahue MJ, van Zijl PC. Detrimental effects of BOLD signal in arterial spin labeling fMRI at high field strength. Magn Reson Med. Sep 2006;56(3):546-52.
17. Metropolis N, Rosenbluth AW, Rosenbluth MN, Teller AH, Teller E. Equation of State Calculations by Fast Computing Machines. Journal of chemical physics. 1953;21(6):1087-1092. doi:10.1063/1.1699114
18. Hastings WK. Monte Carlo Sampling Methods Using Markov Chains and Their Applications. Biometrika. 1970;57(1):97-109. doi:10.2307/2334940
19. Woolrich MW, Chiarelli P, Gallichan D, Perthen J, Liu TT. Bayesian inference of hemodynamic changes in functional arterial spin labeling data. Magn Reson Med. Oct 2006;56(4):891-906. doi:10.1002/mrm.21039
20. Harms RL, Roebroeck A. Robust and Fast Markov Chain Monte Carlo Sampling of Diffusion MRI Microstructure Models. Front Neuroinform. 2018;12:97. doi:10.3389/fninf.2018.00097
21. Behrens TE, Woolrich MW, Jenkinson M, et al. Characterization and propagation of uncertainty in diffusion-weighted MR imaging. Magn Reson Med. Nov 2003;50(5):1077-88.
22. Jbabdi S, Sotiropoulos SN, Savio AM, Graña M, Behrens TE. Model-based analysis of multishell diffusion MR data for tractography: how to get over fitting problems. Magn Reson Med. Dec 2012;68(6):1846-55. doi:10.1002/mrm.24204
23. Tang X, Oishi K, Faria AV, et al. Bayesian Parameter Estimation and Segmentation in the Multi-Atlas Random Orbit Model. PLoS One. 2013;8(6):e65591. doi:10.1371/journal.pone.0065591
24. Wang H, Yushkevich PA. Multi-atlas segmentation with joint label fusion and corrective learning-an open source implementation. Front Neuroinform. 2013;7:27. doi:10.3389/fninf.2013.00027
25. Mori S, Wu D, Ceritoglu C, et al. MRICloud: Delivering High-Throughput MRI Neuroinformatics as Cloud-Based Software as a Service. Computing in Science Engineering. 2016;18(5):21-35. doi:10.1109/MCSE.2016.93
26. Landman BA, Huang AJ, Gifford A, et al. Multi-parametric neuroimaging reproducibility: a 3-T resource study. Neuroimage. Feb 14 2011;54(4):2854-66. doi:10.1016/j.neuroimage.2010.11.047
Figures