4898
Combined Modality PET/MR For the Detection of Severe Large Vessel Vasculitis1Northwestern University, Chicago, IL, United States
Synopsis
Combined modality PET/MR may be a sensitive modality to detect severe large vessel vasculitis. To distinguish severe large vessel vasculitis, a qualitative review of PET imaging findings appears more useful than standardized uptake values of a patient’s highest-uptake vessel. Inflammatory marker levels and trends, as well as single-modality scan findings, were not significantly different between severe and non-severe large vessel vasculitis patients.
Introduction
Large vessel vasculitis (LVV) is a noninfectious inflammatory disorder involving the arteries of the central vasculature. It produces ill-defined systemic symptoms that overlap with other disease processes. Since inflammatory markers often do not correlate with LVV disease activity1,2, vascular imaging has increasingly been explored to identify active LVV. Simultaneous combined 18F-FDG positron emission tomography (PET)/magnetic resonance (MR) is a promising modality to identify active LVV and has been proposed to guide immunosuppression strategy. However, treatment strategies for LVV are also decided upon based on the presence, or absence, of life- or organ-threatening manifestations (severe vs non-severe LVV, respectively)3. While 18F-FDG PET/MR findings and inflammatory marker measurements have been used to identify active LVV, they have not been used as a basis to distinguish severe, from non-severe, LVV. There is a need to evaluate the imaging and laboratory measures associated with the subgroups of a symptoms-based LVV classification paradigm to understand if combined modality PET/MR has the potential to supplement symptoms-based treatment decisions.Methods
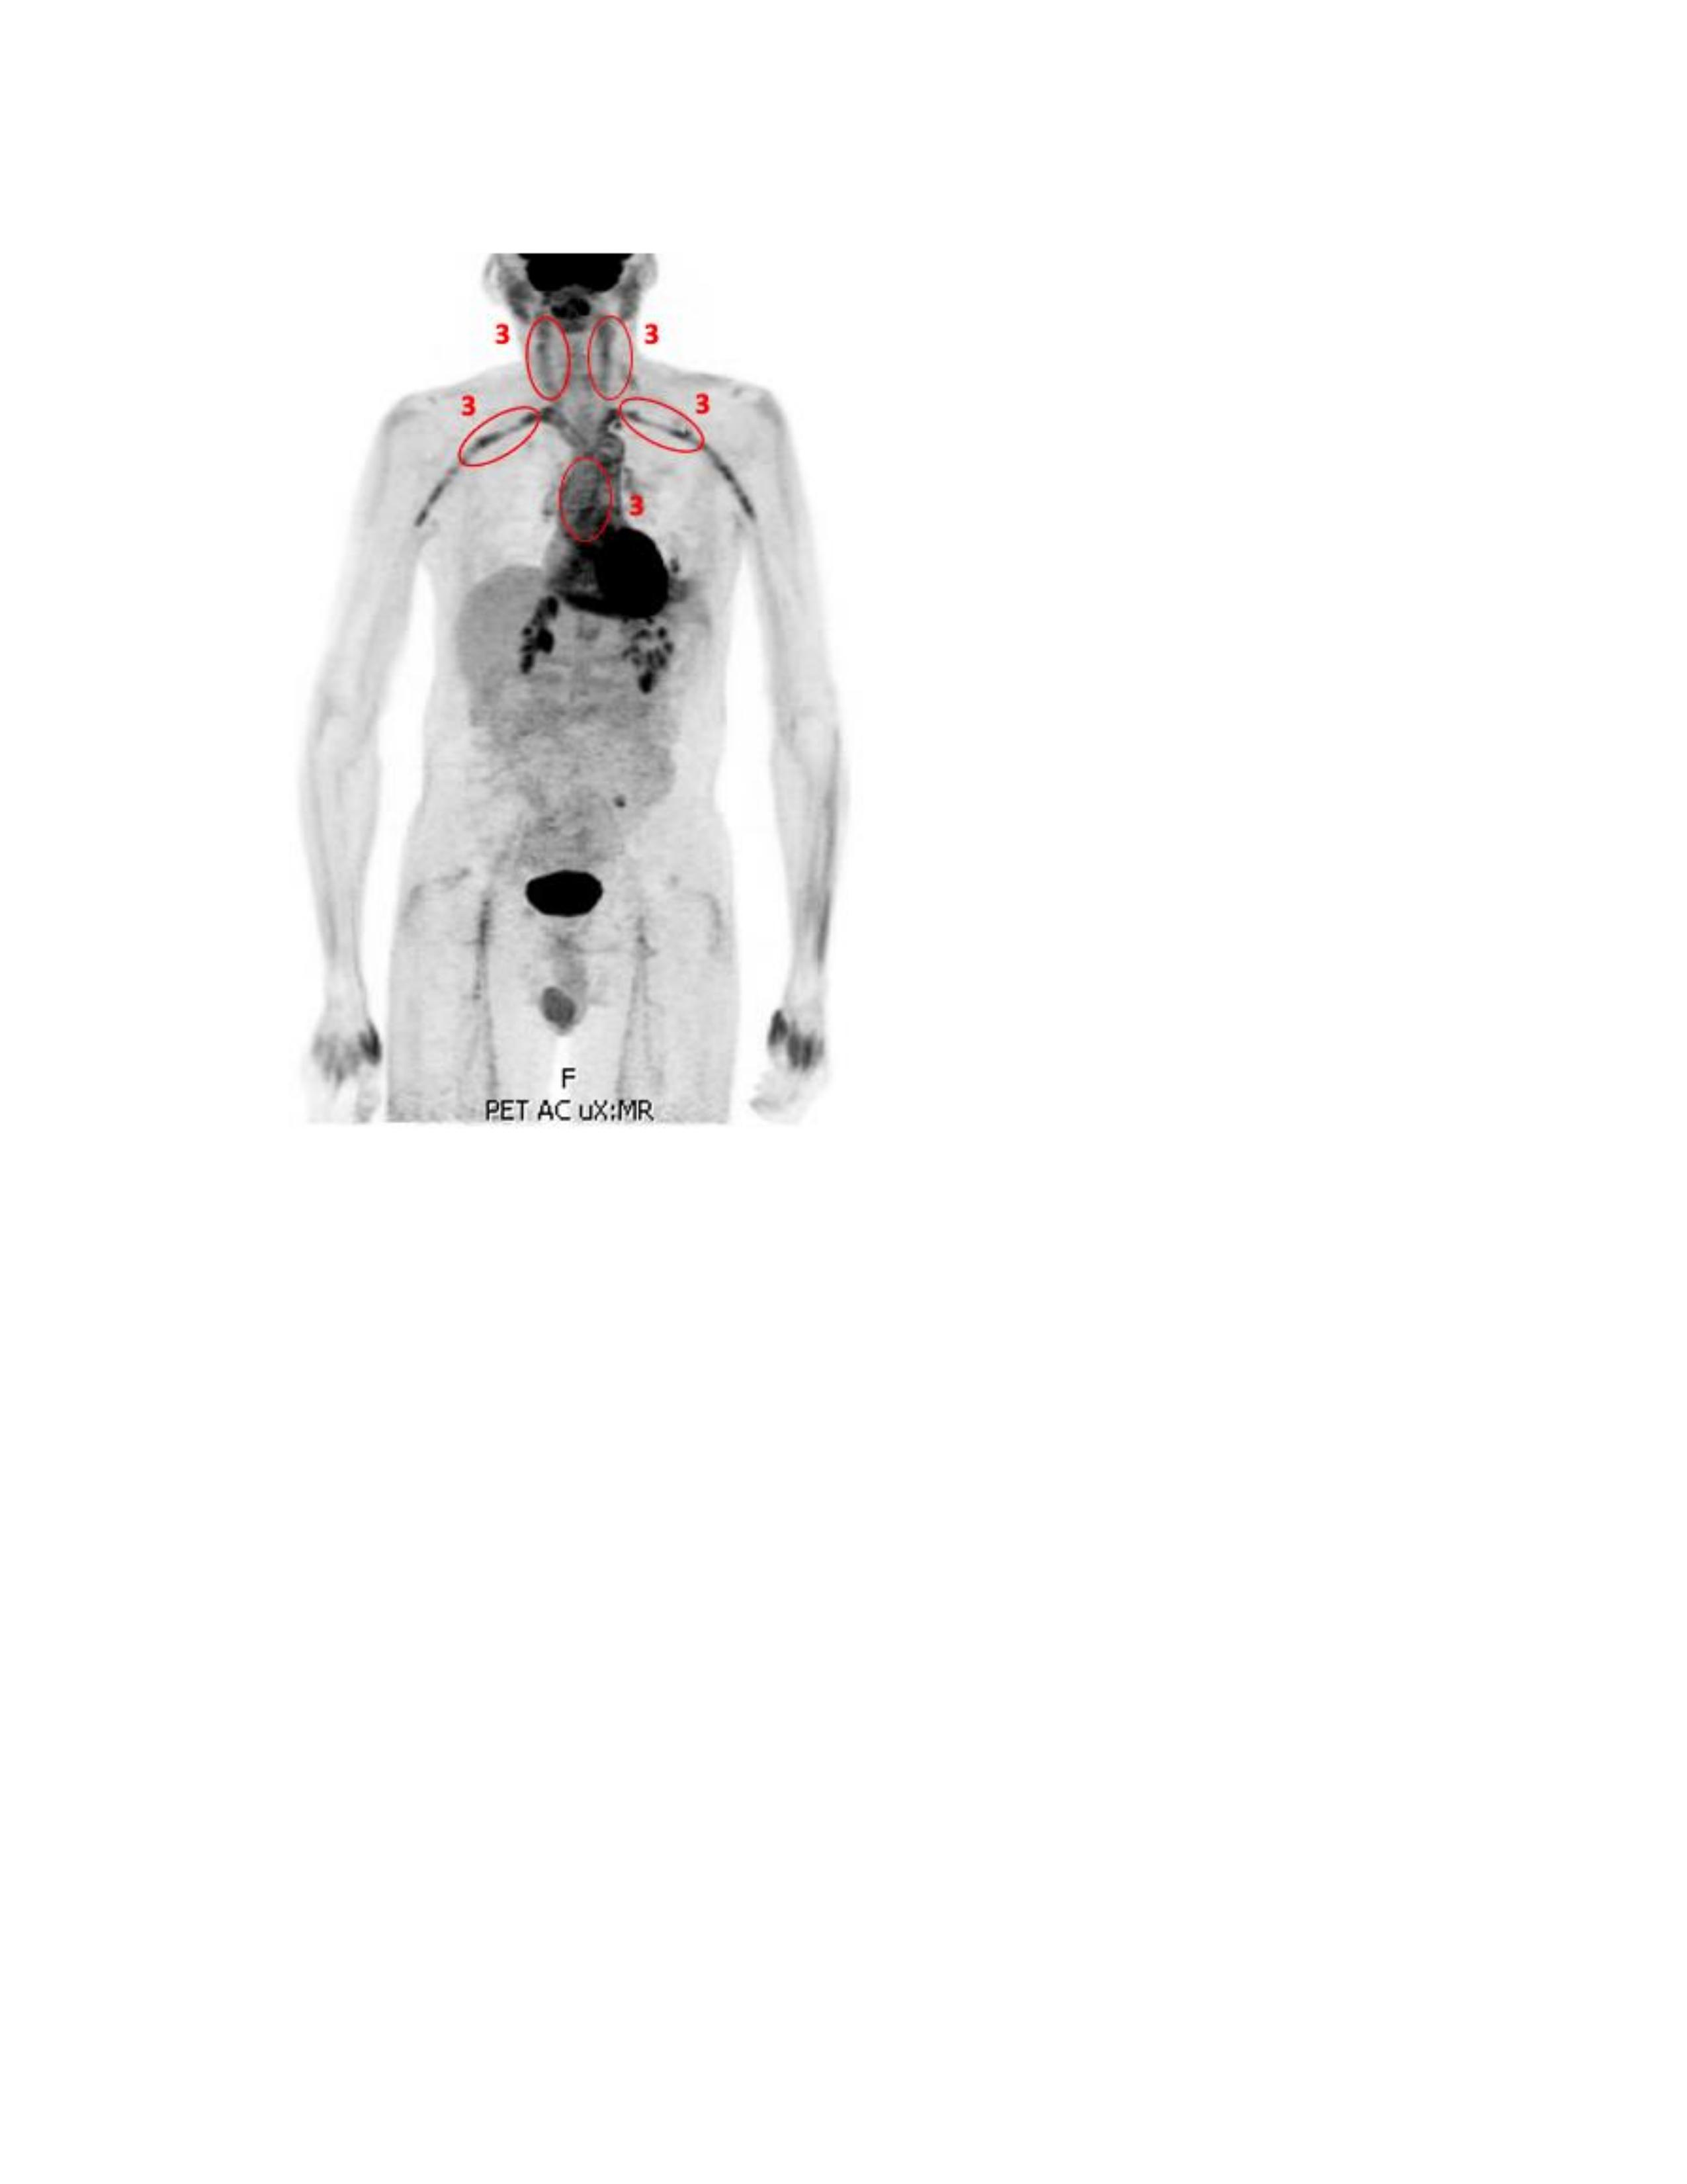
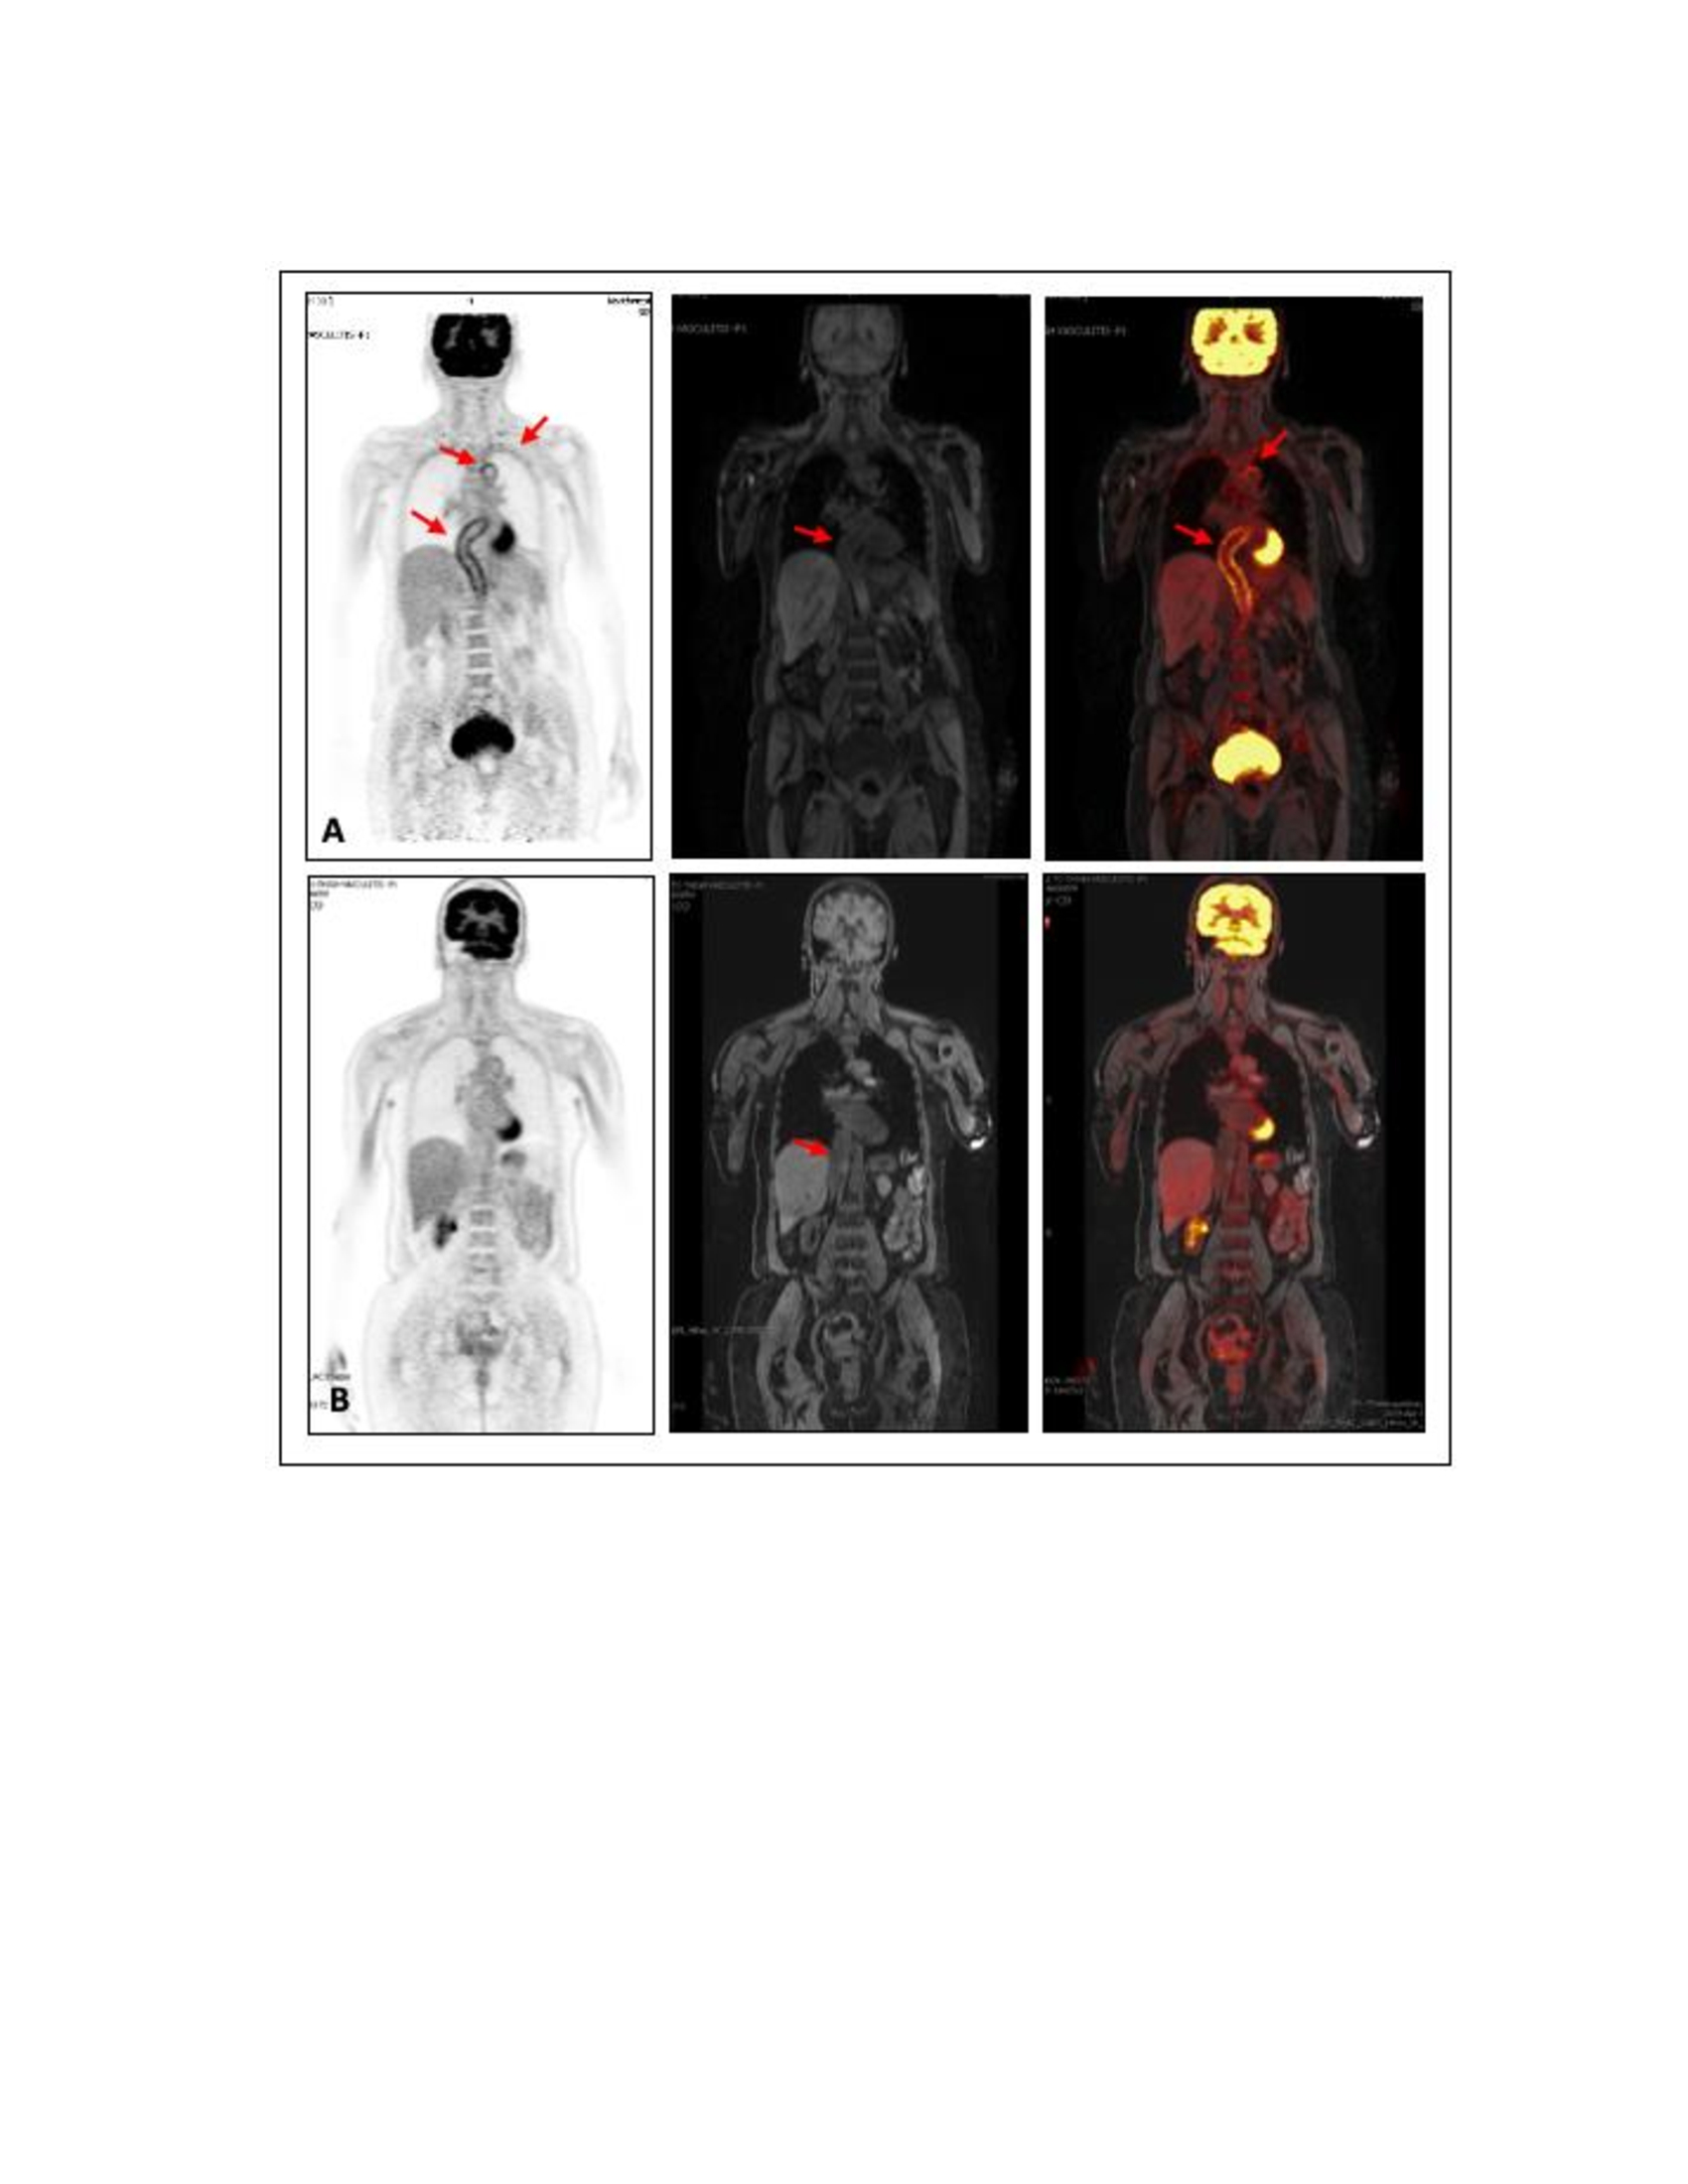
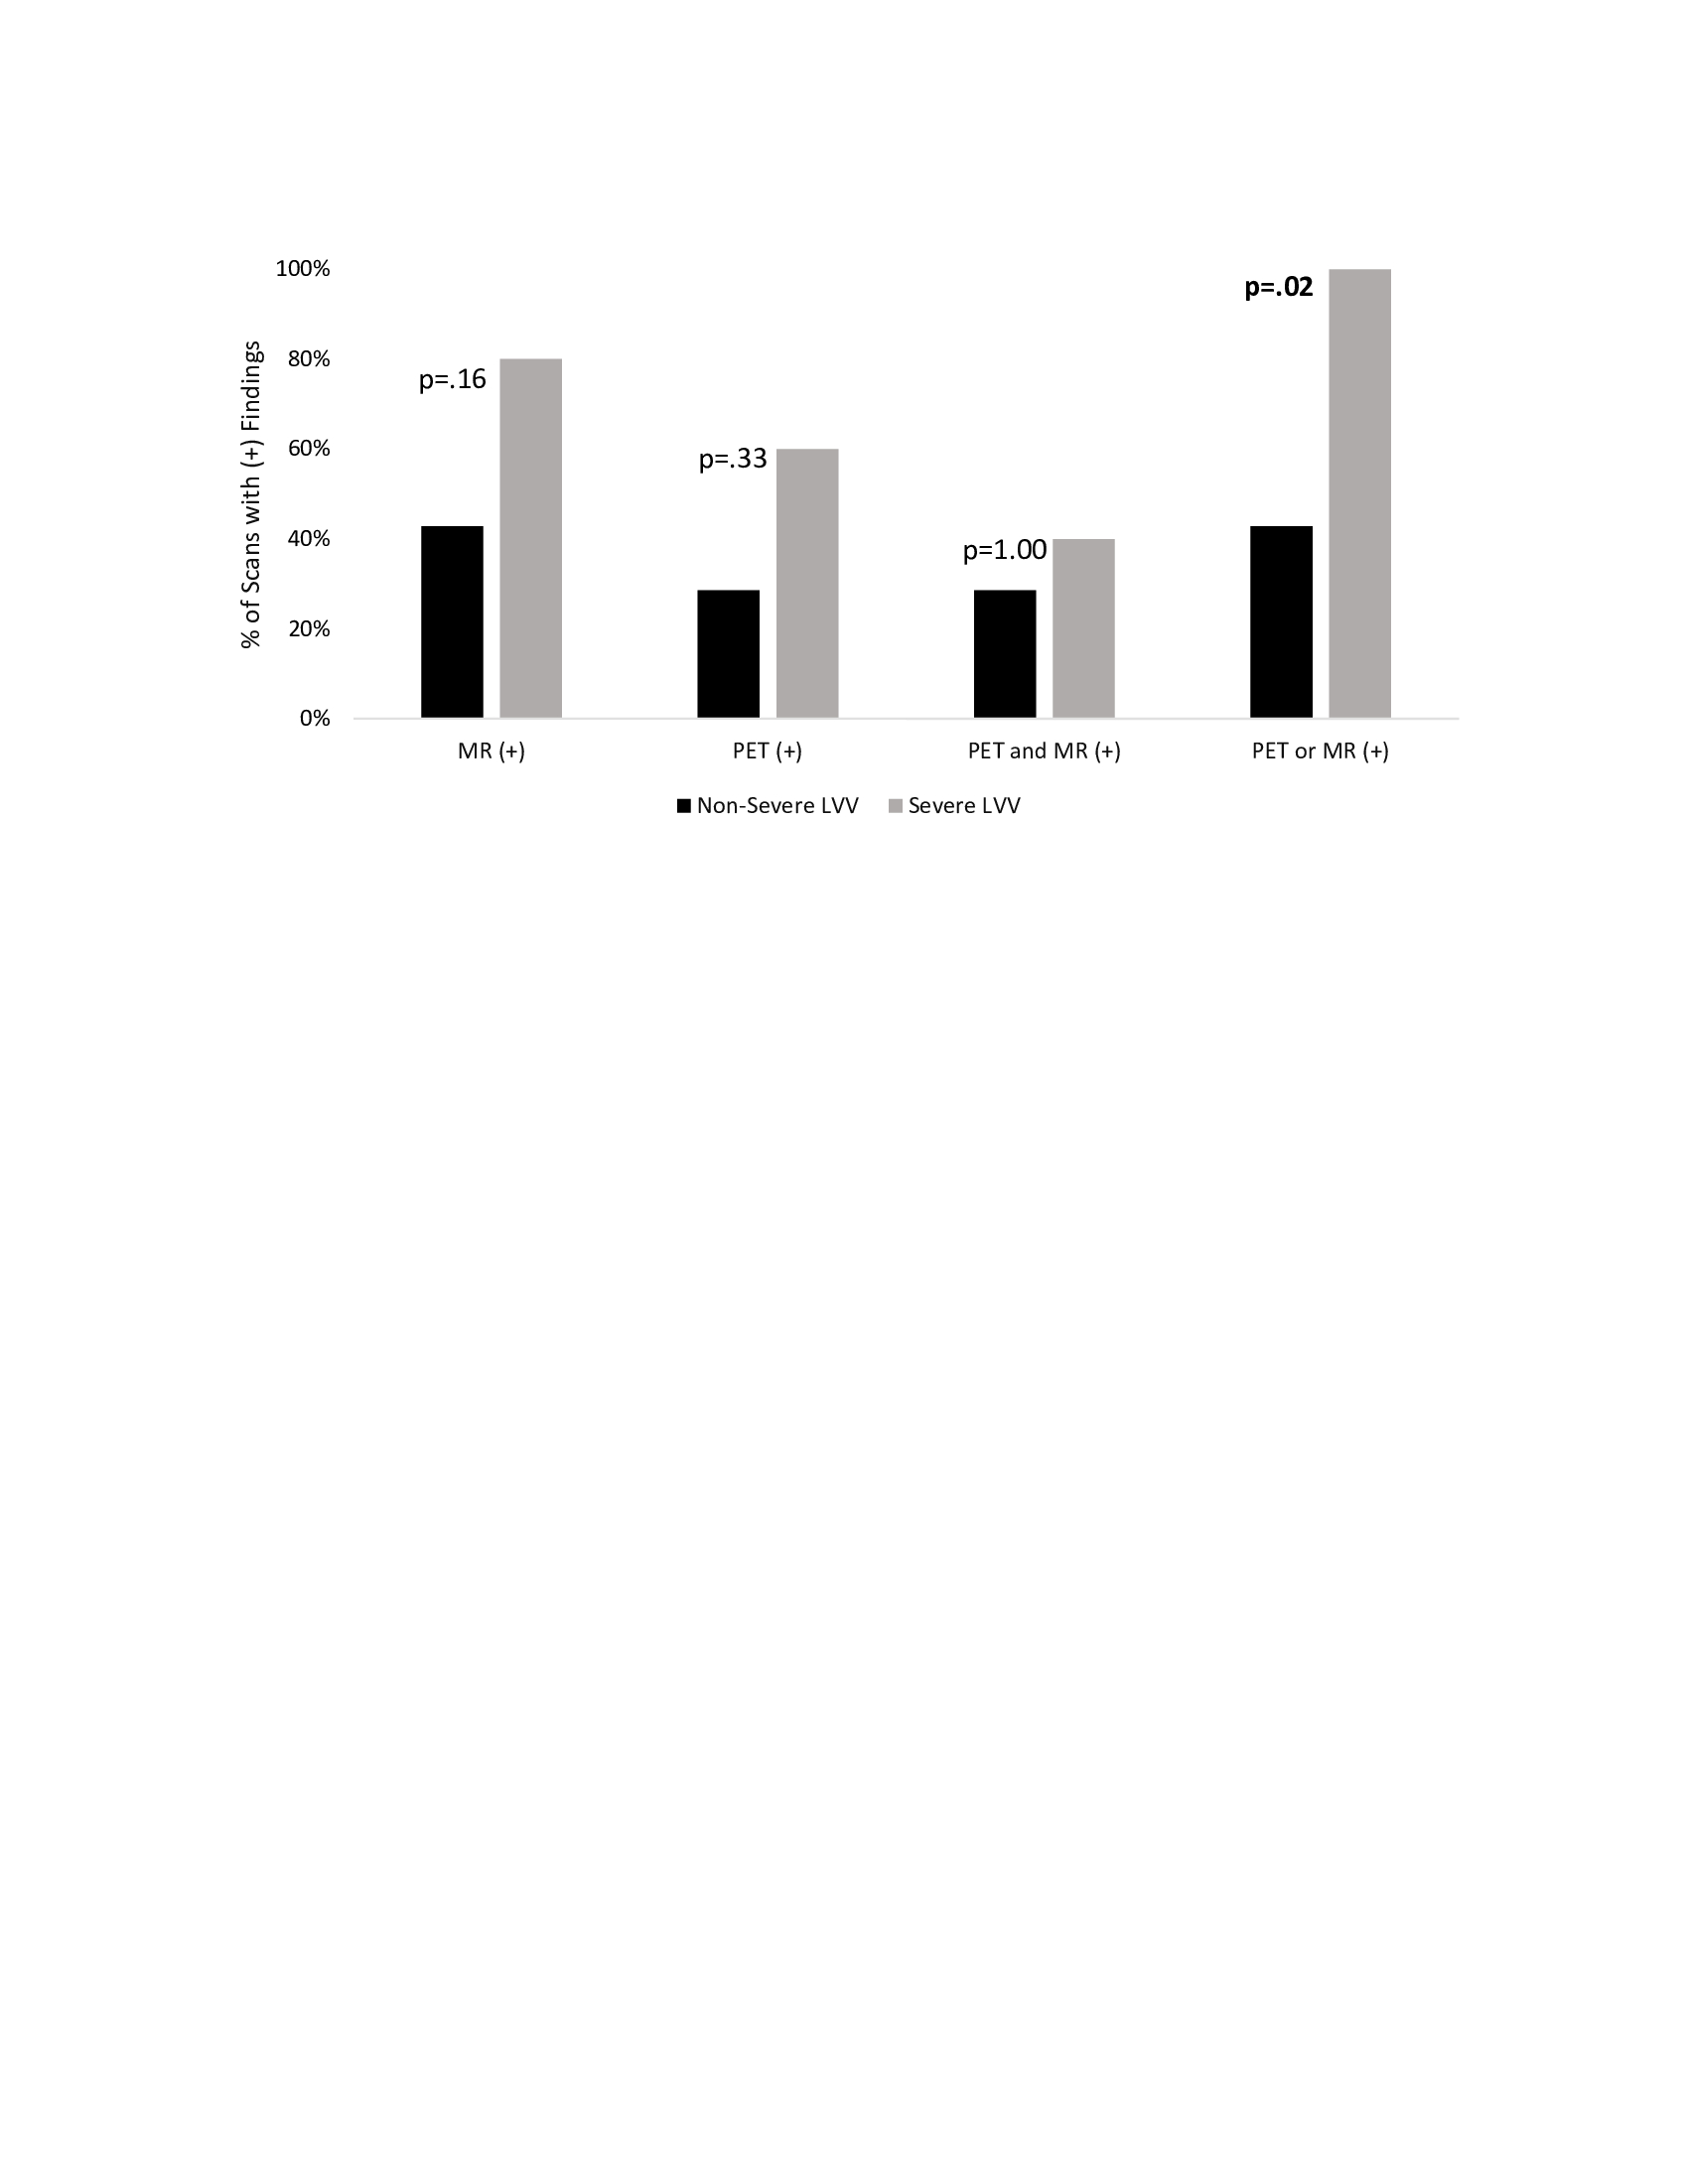
A retrospective review of patients with LVV who had undergone 18F-FDG PET/MR was performed. The two (baseline and follow-up) C-reactive protein (CRP) and erythrocyte sedimentation rate (ESR) values taken closest to the time of scan (<14 months) were obtained and summed to obtain net ESR and CRP values. Patients’ clinical histories were reviewed to determine classification as severe vs non-severe LVV. Symptoms such as vision loss, cerebrovascular ischemia, or limb ischemia were considered severe.Qualitative PET/MR Assessment: Scans were assessed on a vessel-by-vessel basis, including the ascending thoracic aorta, aortic arch, descending thoracic aorta, suprarenal abdominal aorta, subclavian arteries, common carotid arteries, common iliac arteries, and femoral arteries. FDG inflammatory uptake on PET was semi-quantitatively scored by severity with reference to the liver (0= no uptake; 1=uptake less than liver; 2=same uptake same as liver; 3=uptake greater than liver) (Figure 1). The appearance of each vessel on MR was qualitatively evaluated for LVV using the presence of wall thickening, enhancement, focal stenosis, or aneurysm as positive indicators. If a scan had any vessels with a PET score of 3, or MR-findings suggestive of LVV, the scan was considered PET- or MR-positive, respectively (Figure 2). Fisher’s exact test was used to compare the distribution of positive scans between groups.
Quantitative PET Assessment: Spherical volumes of interest (VOIs) were placed on the most hypermetabolic region of every vessel, within the descending thoracic aorta blood pool, and within the posterior right liver lobe. For each scan, normalized maximum standardized uptake values (MSUVs) were calculated: A) Blood Normalized MSUV=(Vessel MSUV)/(Blood MSUV); B) Liver Normalized MSUV=(Vessel MSUV)/(Liver MSUV).
Results
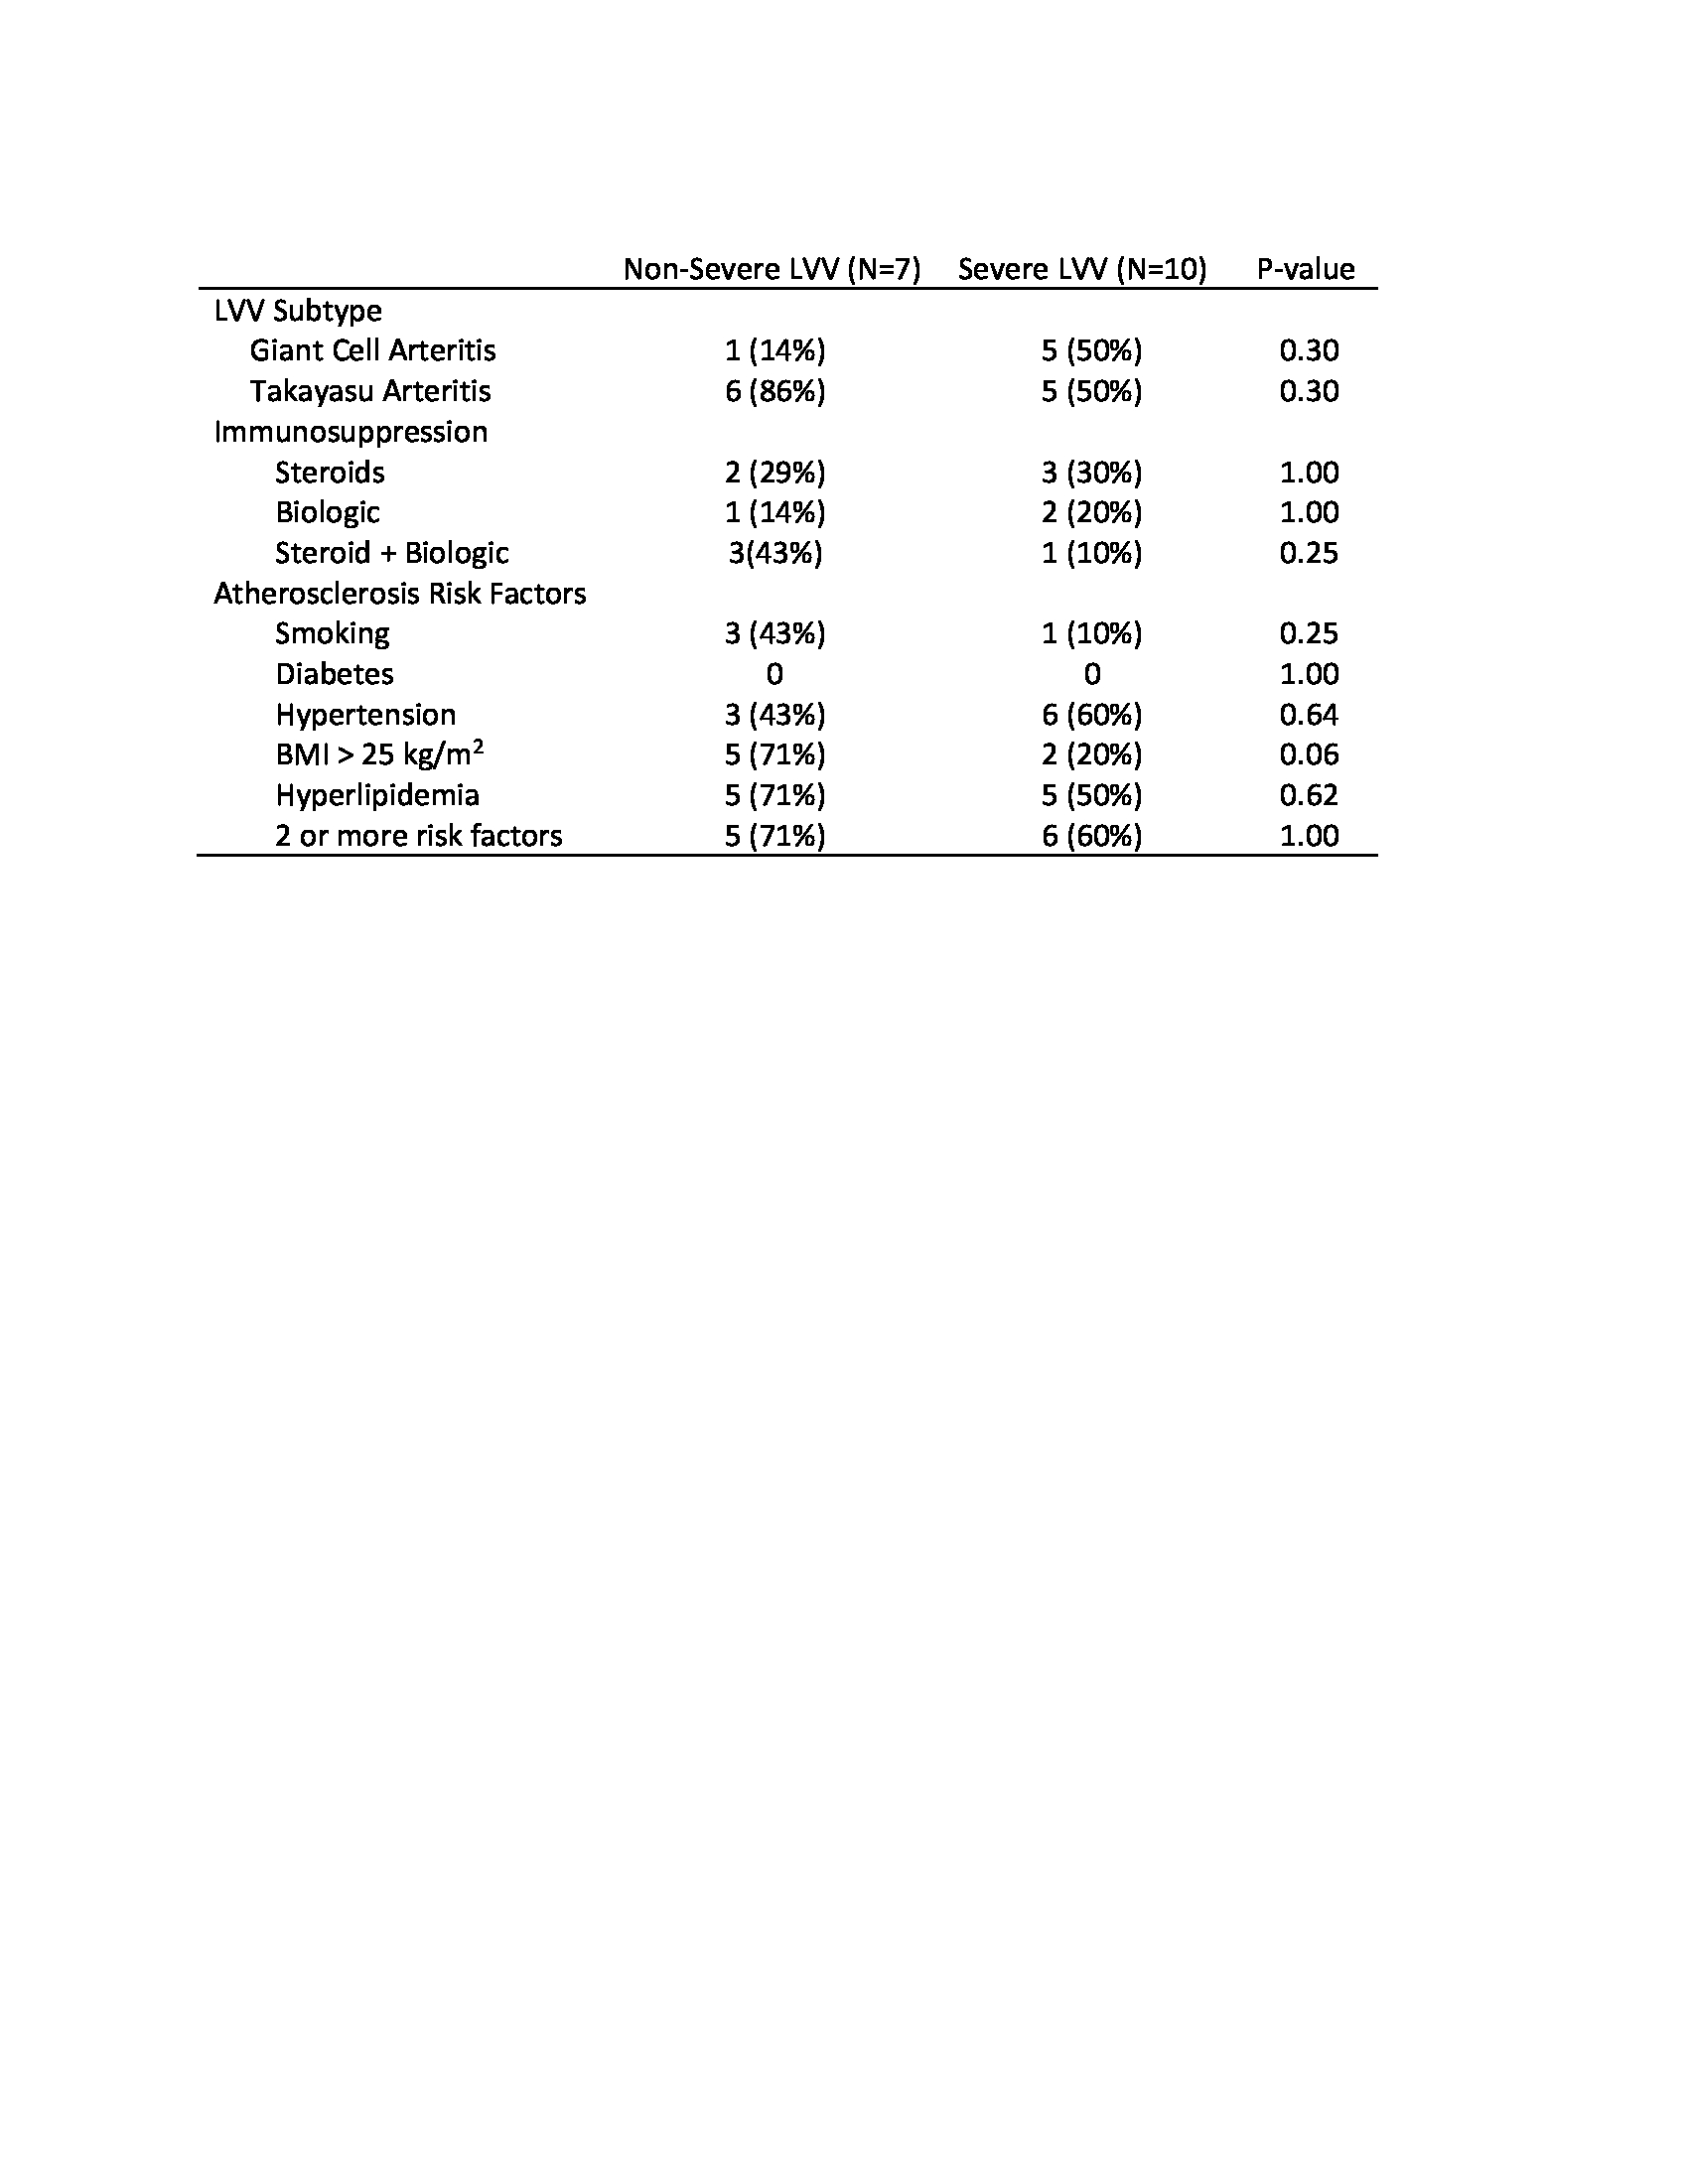
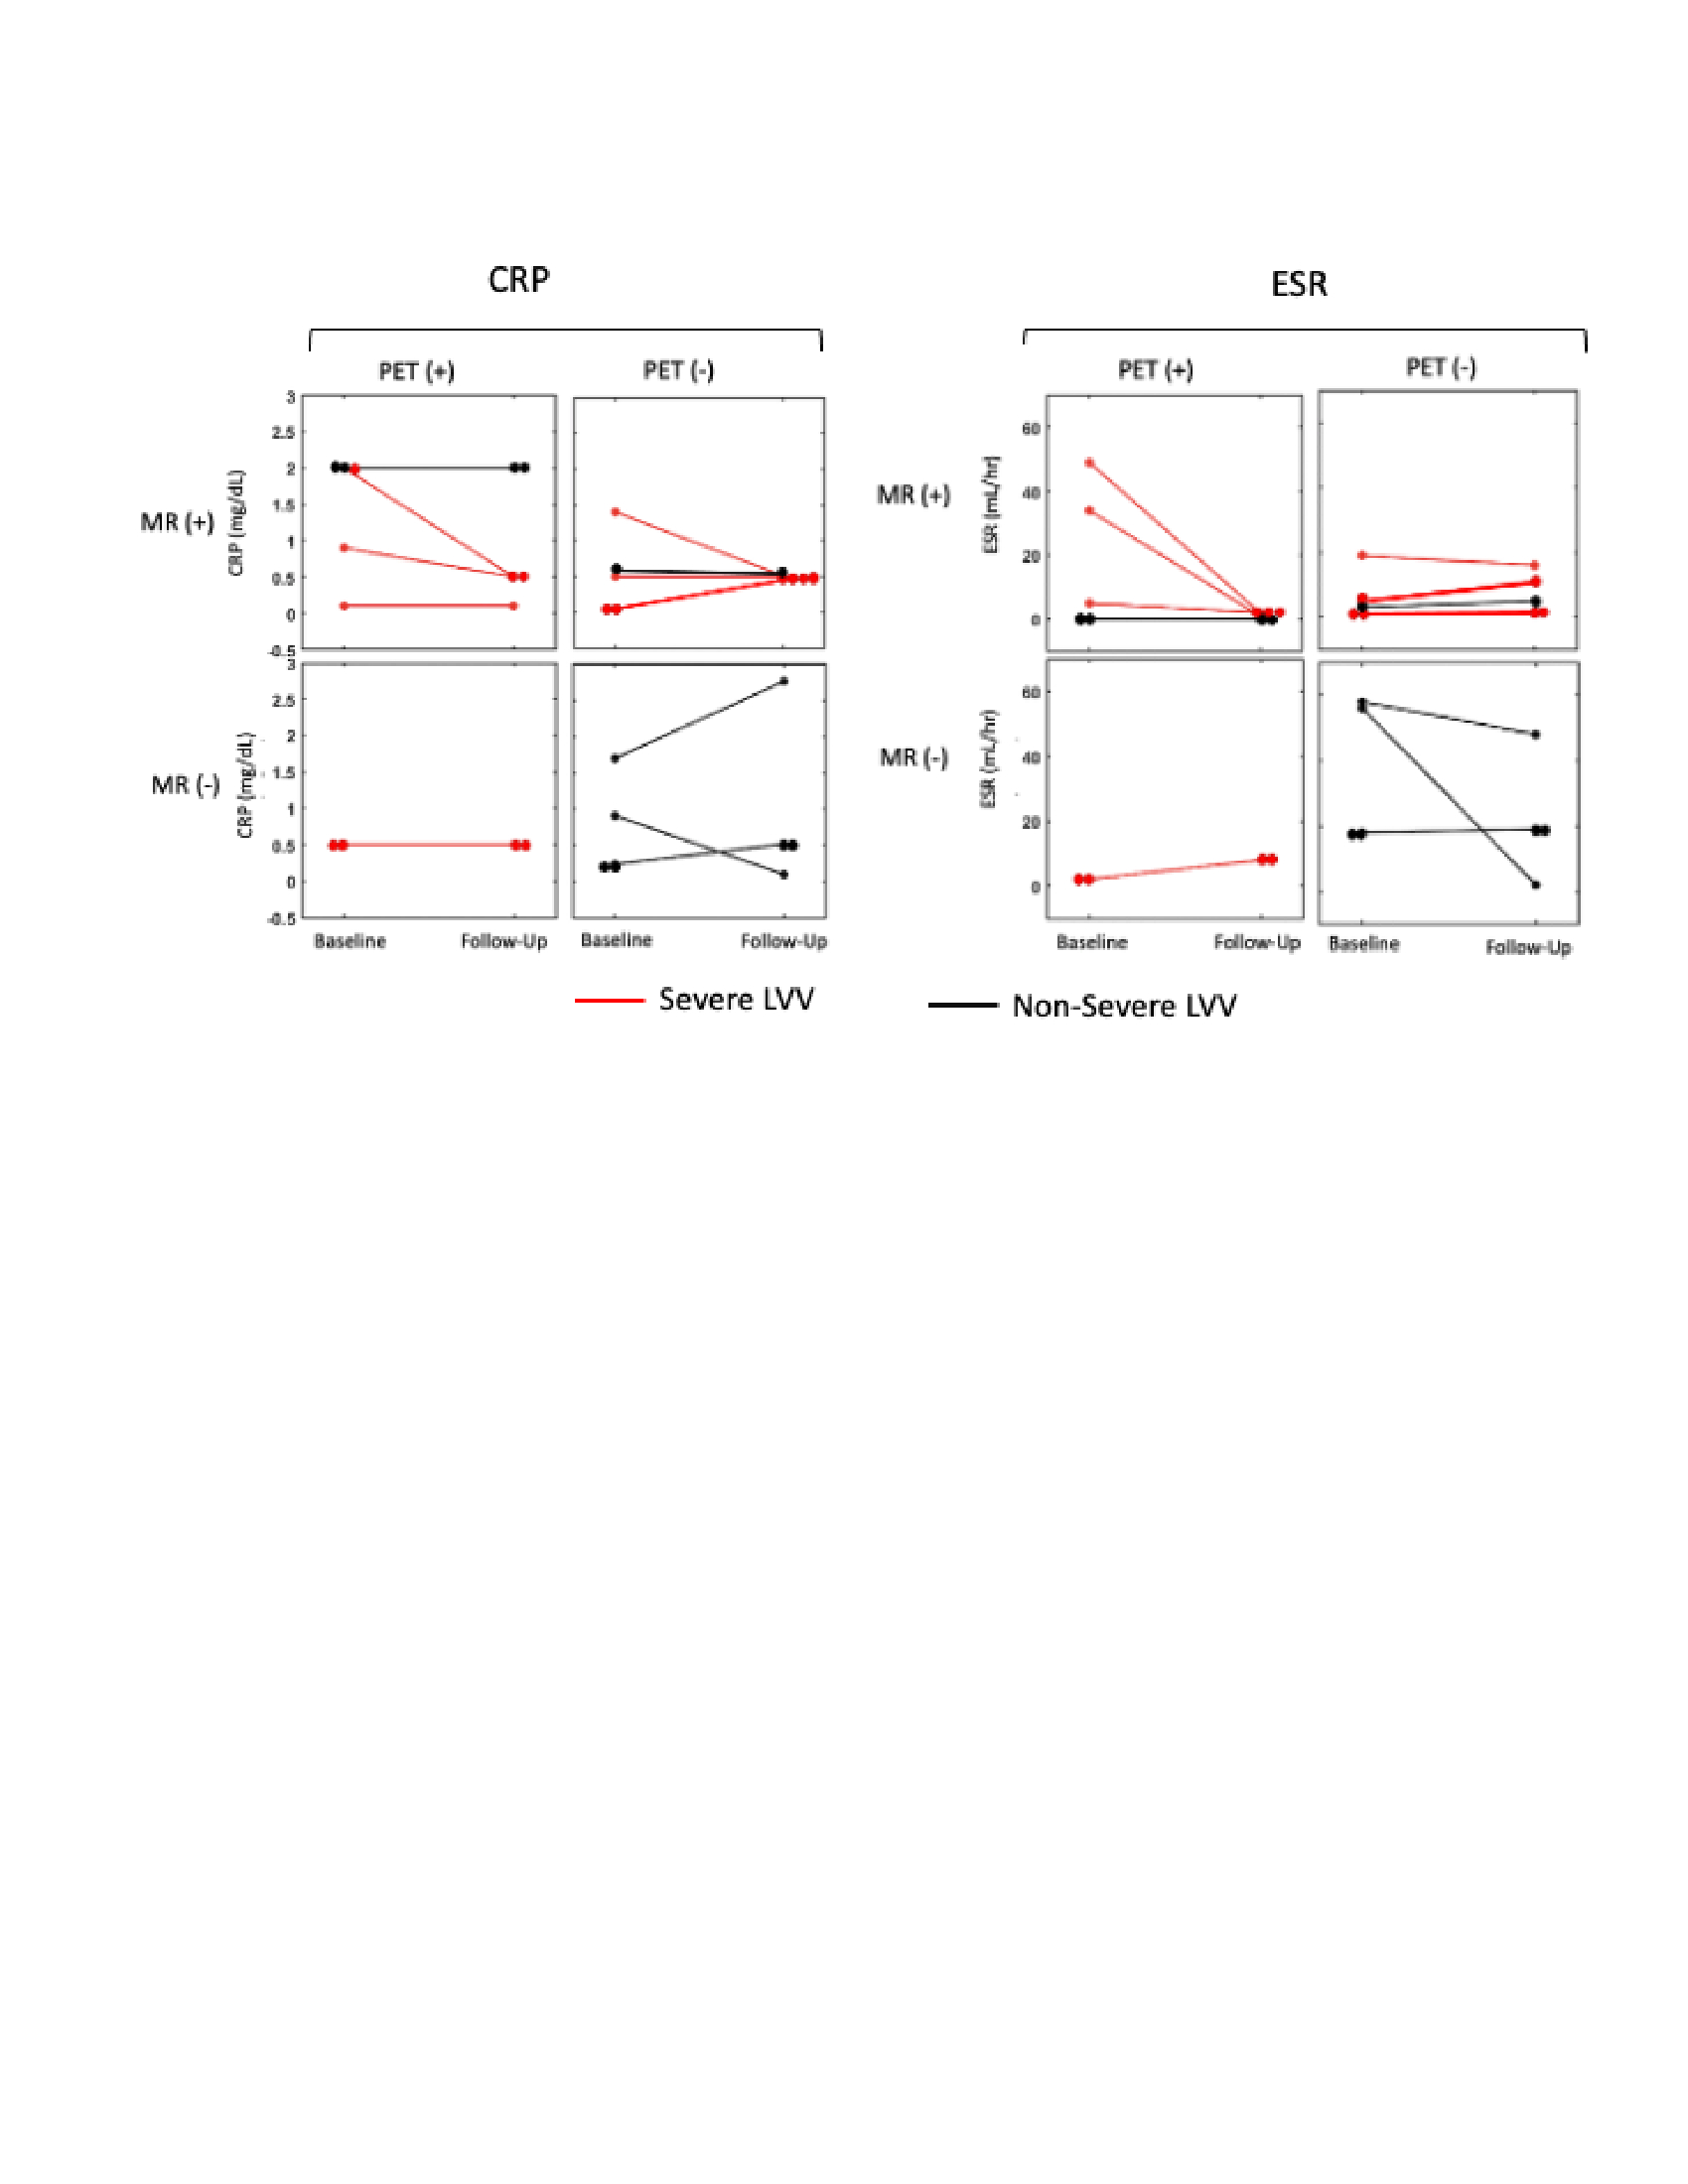
12 LVV patients (57±17 years, 11 female) were included and underwent 17 scans (5 patients had baseline and follow-up scans) (demographic data in Table 1). Inflammatory marker trends (increasing vs decreasing) and levels were not significantly different between severe and non-severe LVV groups (severe: ESR=18±17 mm/hr, 3/9 increasing; CRP=1.1±0.8 mg/dL, 2/9 increasing) (non-severe: ESR=38±41 mm/hr, 1/7 increasing; CRP=1.0±1.0 mg/dL, 2/7 increasing) (Figure 3).Qualitative PET/MR Assessment: High amounts of artifact prevented the PET grading of the right subclavian artery in 9/17 scans, left subclavian artery in 4/17 scans, right common carotid artery in 8/17 scans, left common carotid artery in 4/17 scans, right common iliac artery in 4/17 scans, left common iliac artery in 4/17 scans, right femoral artery in 6/17 scans, and left femoral artery in 4/17 scans. High amounts of artifact prevented MR grading of the left femoral artery in 1/17 scans, right femoral artery in 1/17 scans, and left common carotid artery in 1/17 scans. The combined use of PET and MR was able to detect severe LVV compared to non-severe LVV (p<0.02), more effectively than either modality in isolation (P>0.05) (Figure 4).
Quantitative PET Assessment: Blood- and liver-normalized MSUVs were similar between severe and non-severe patients (2.04±1.06 vs 2.09±0.38; 1.60±0.83 vs 1.62±0.20, respectively).
Discussion
Combined modality PET/MR may hold utility when patients have life-threatening symptoms that overlap with other disease processes. Combined modality PET/MR appears to offer additional insight to the information obtained by isolated PET, isolated MR, and inflammatory markers. This study is limited by the number of vessels that were unable to be qualitatively assessed. Although the femoral and common carotid arteries were unable to be assessed in many scans, each scan had different vessels excluded from analysis. For this reason, MR- and PET-extent were not evaluated in this study. It follows that several PET-negative and MR-negative patients may have had positive scans, but high amounts of artifact prevented this observation.Conclusion
Qualitative assessment by 18F-FDG PET/MR may supplement clinical symptoms-based LVV classification.Acknowledgements
No acknowledgement found.References
1) Kerr, G. S. et al. Takayasu arteritis. Ann. Intern. Med. 120, 919–929 (1994).
2) Tso, E. et al. Takayasu arteritis: utility and limitations of magnetic resonance imaging in diagnosis and treatment. Arthritis Rheum. 46, 1634–1642 (2002).
3) Maz, M. et al. 2021 American College of Rheumatology/Vasculitis Foundation Guideline for the Management of Giant Cell Arteritis and Takayasu Arteritis. Arthritis Rheumatol. 73, 1349–1365 (2021).
Figures