4896
Vessel Density Mapping of Brain Small Vessels on 3D High Resolution Black Blood MRI1University of Southern California, Los Angeles, CA, United States, 2Siemens Medical Solutions USA, Inc., Los Angeles, CA, United States
Synopsis
High resolution 3D black blood MRI with sub-millimeter spatial resolution has been proposed for visualizing small vessels of the brain. Here we present and evaluate a novel approach for mapping brain vessel density from 3D black blood images acquired at 3T. Using automated vessel segmentation and non-linear registration, localized detection and quantification of small vessel density is demonstrated to be feasible. This framework can potentially serve as a useful tool for detection and monitoring of localized vascular changes in aging and neurovascular disorders.
Introduction
The underlying mechanisms of small vessel disease remain poorly understood since cerebral small vessels are largely inaccessible to existing clinical in vivo imaging technologies. High resolution 3D black-blood MRI with sub-millimeter spatial resolution has been proposed for visualizing small vessels of the brain, using T1-weighted turbo spin echo with variable flip angles (T1w-VFA-TSE) scan at 3T [1]. Utilizing an optimized T1w-VFA-TSE sequence, 3D segmentation and quantification of lenticulostriate arteries (LSAs) is feasible. In this study, we developed a novel 3D analysis framework for localized 3D vessel density mapping of small vessels of the whole brain from 3D black-blood images acquired at 3T.Methods
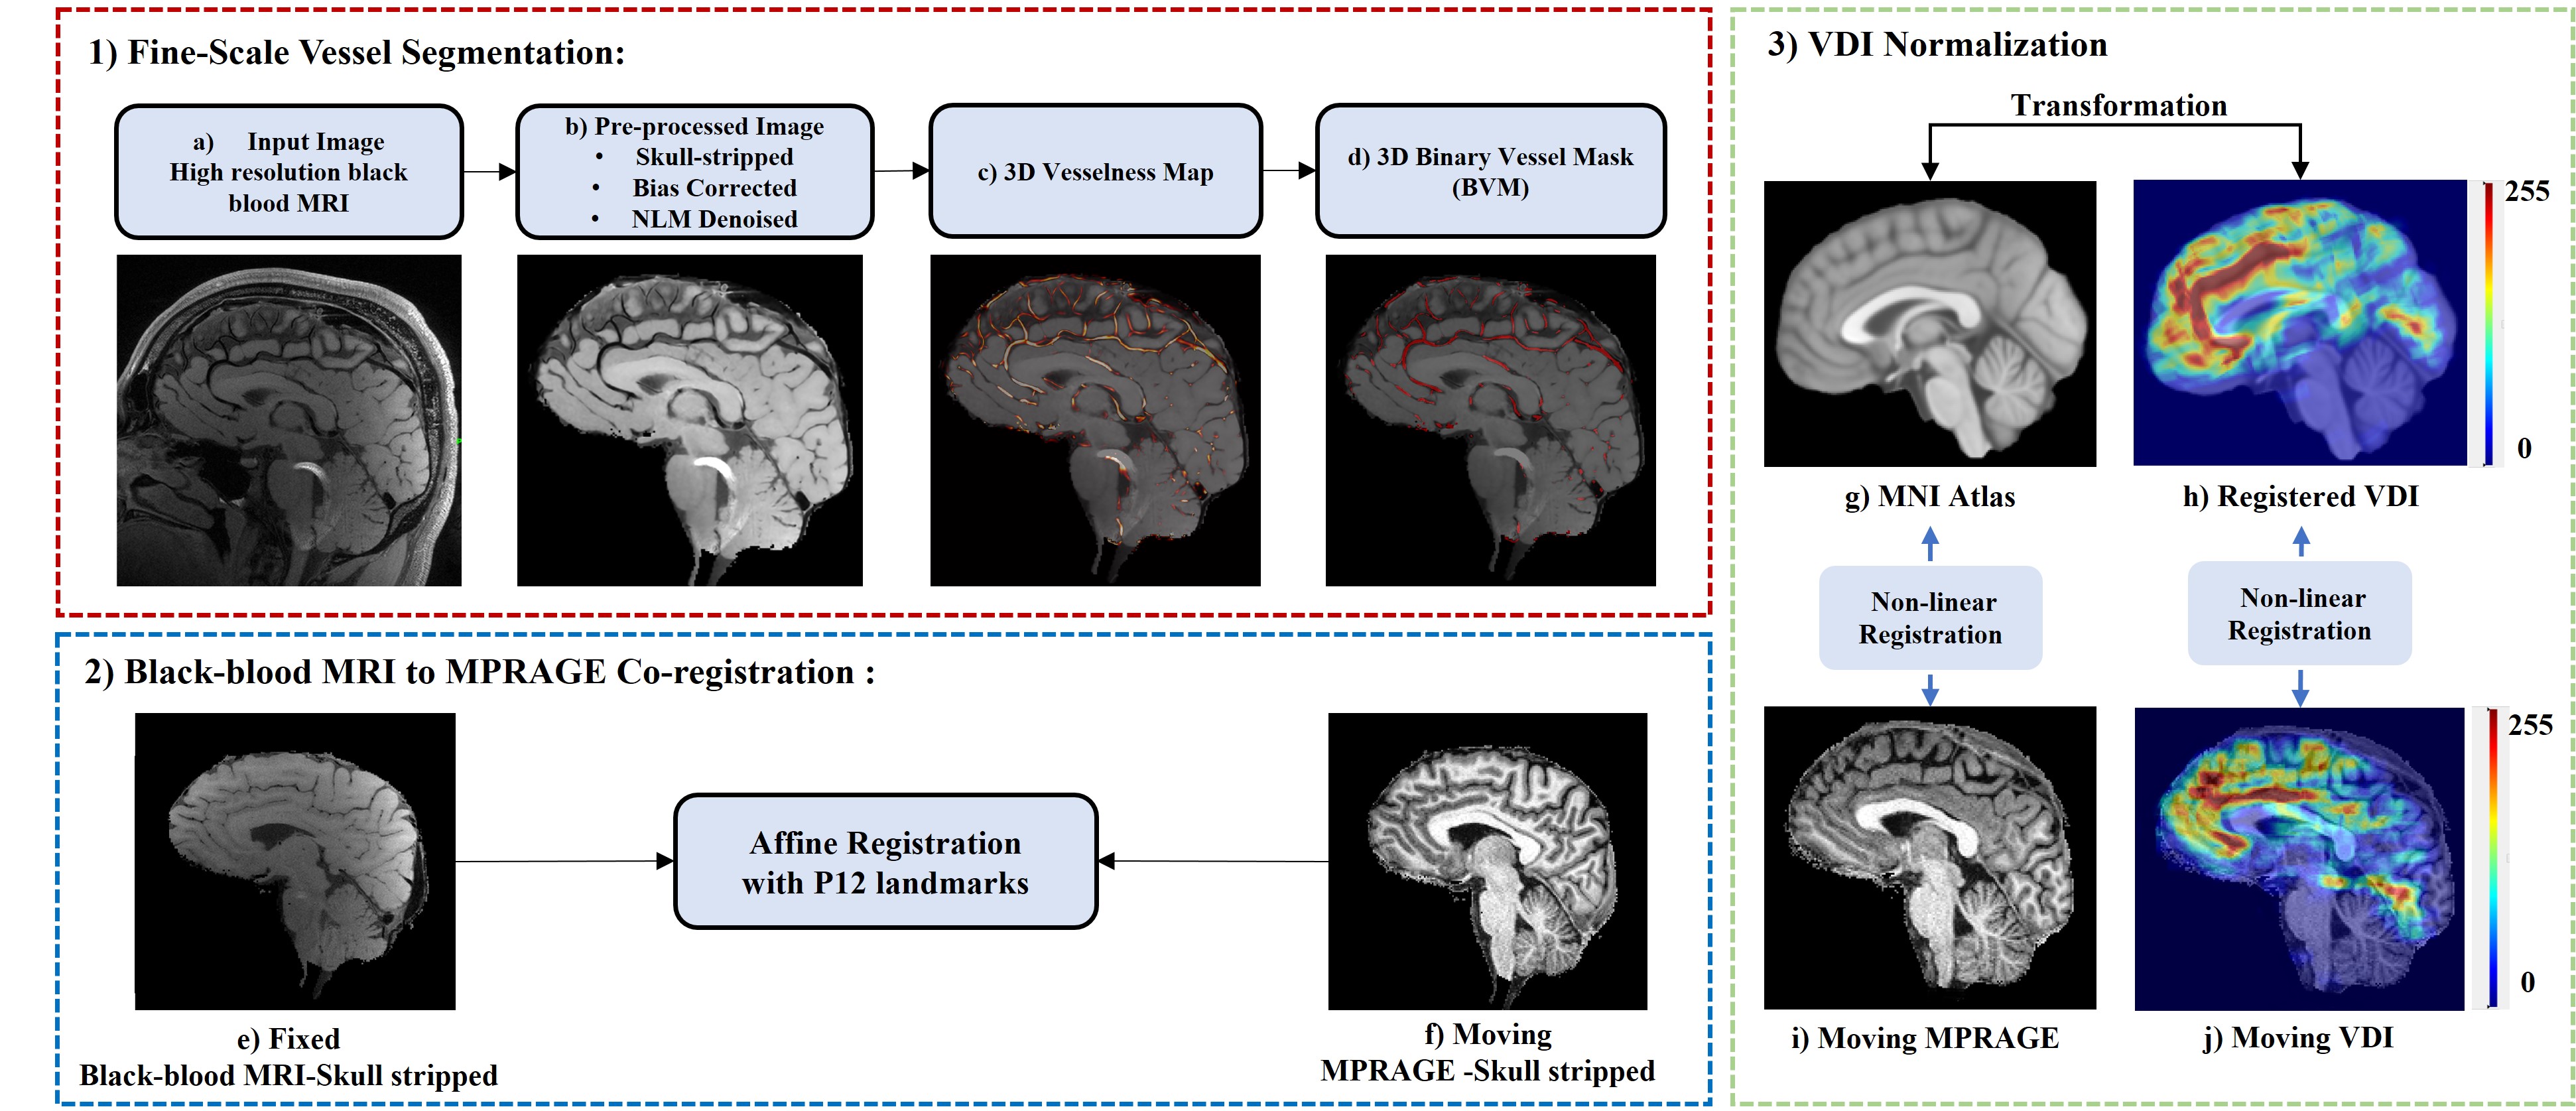
Data acquisition and processingPaired black blood MRI and structural images (MPRAGE) were collected from 16 participants and divided into younger (N =7, 3 female, 26.5±3.8 years, age range [22,33]), and older groups (N =9, 7 female, 68.2±6.8 years, age range [61, 81]). Images were acquired using a Siemens 3T MAGNETOM Prisma scanner with a 32-channel head coil (Siemens Healthcare, Erlangen, Germany). The “black blood” contrast was attained with an optimized T1w-VFA-TSE sequence[1] with the following parameters: TR/TE=1000/12ms, turbo factor=44, matrix size=756x896, resolution=0.51x0.51x0.64mm3 interpolated to 0.3x0.3x0.5mm3, 160 sagittal slices, GRAPPA=2; TA=8:39min. The flowchart of the analysis pipeline is shown in Figure 1, including modules of fine-scale vessel segmentation, Co-registration, and vessel density image (VDI) normalization.
To prepare the images for vessel segmentation, initially, black blood MRI and MPRAGE images were skull-stripped. Black-blood MRI skull-stripped images were further pre-processed by bias correction and denoised via non-local means filtering (Figure 1- (b)).
Vessel Segmentation
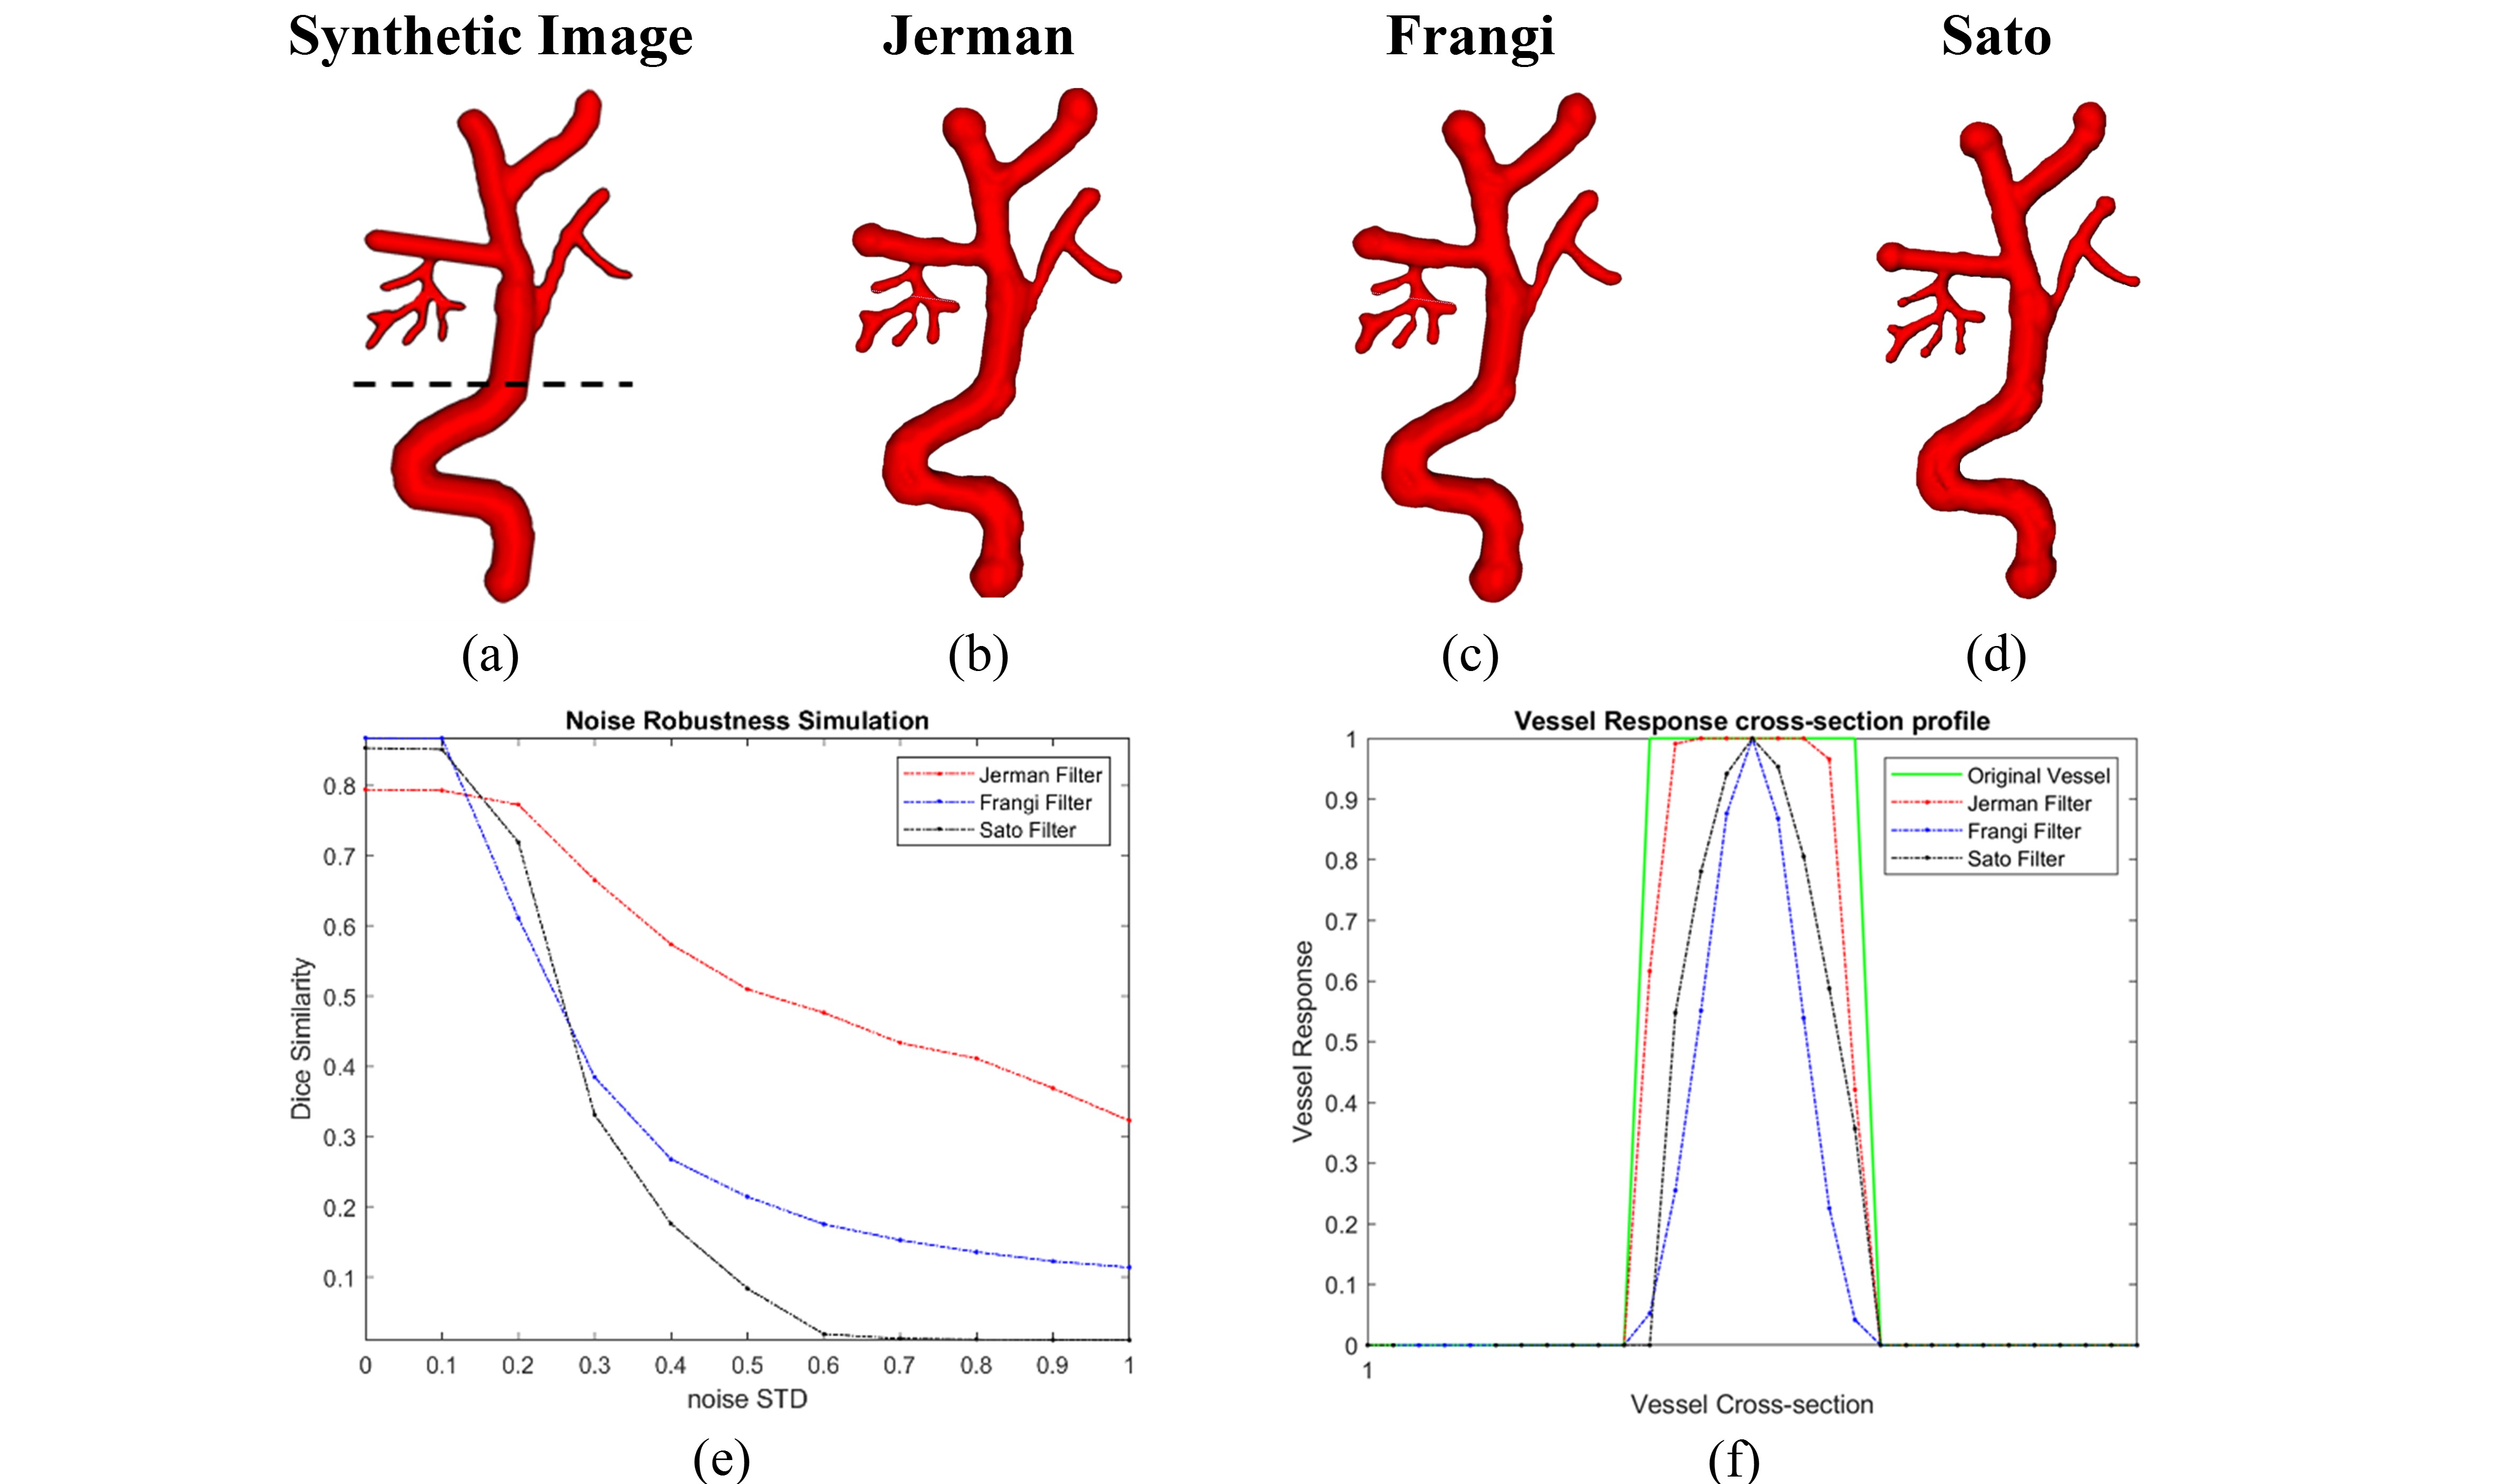
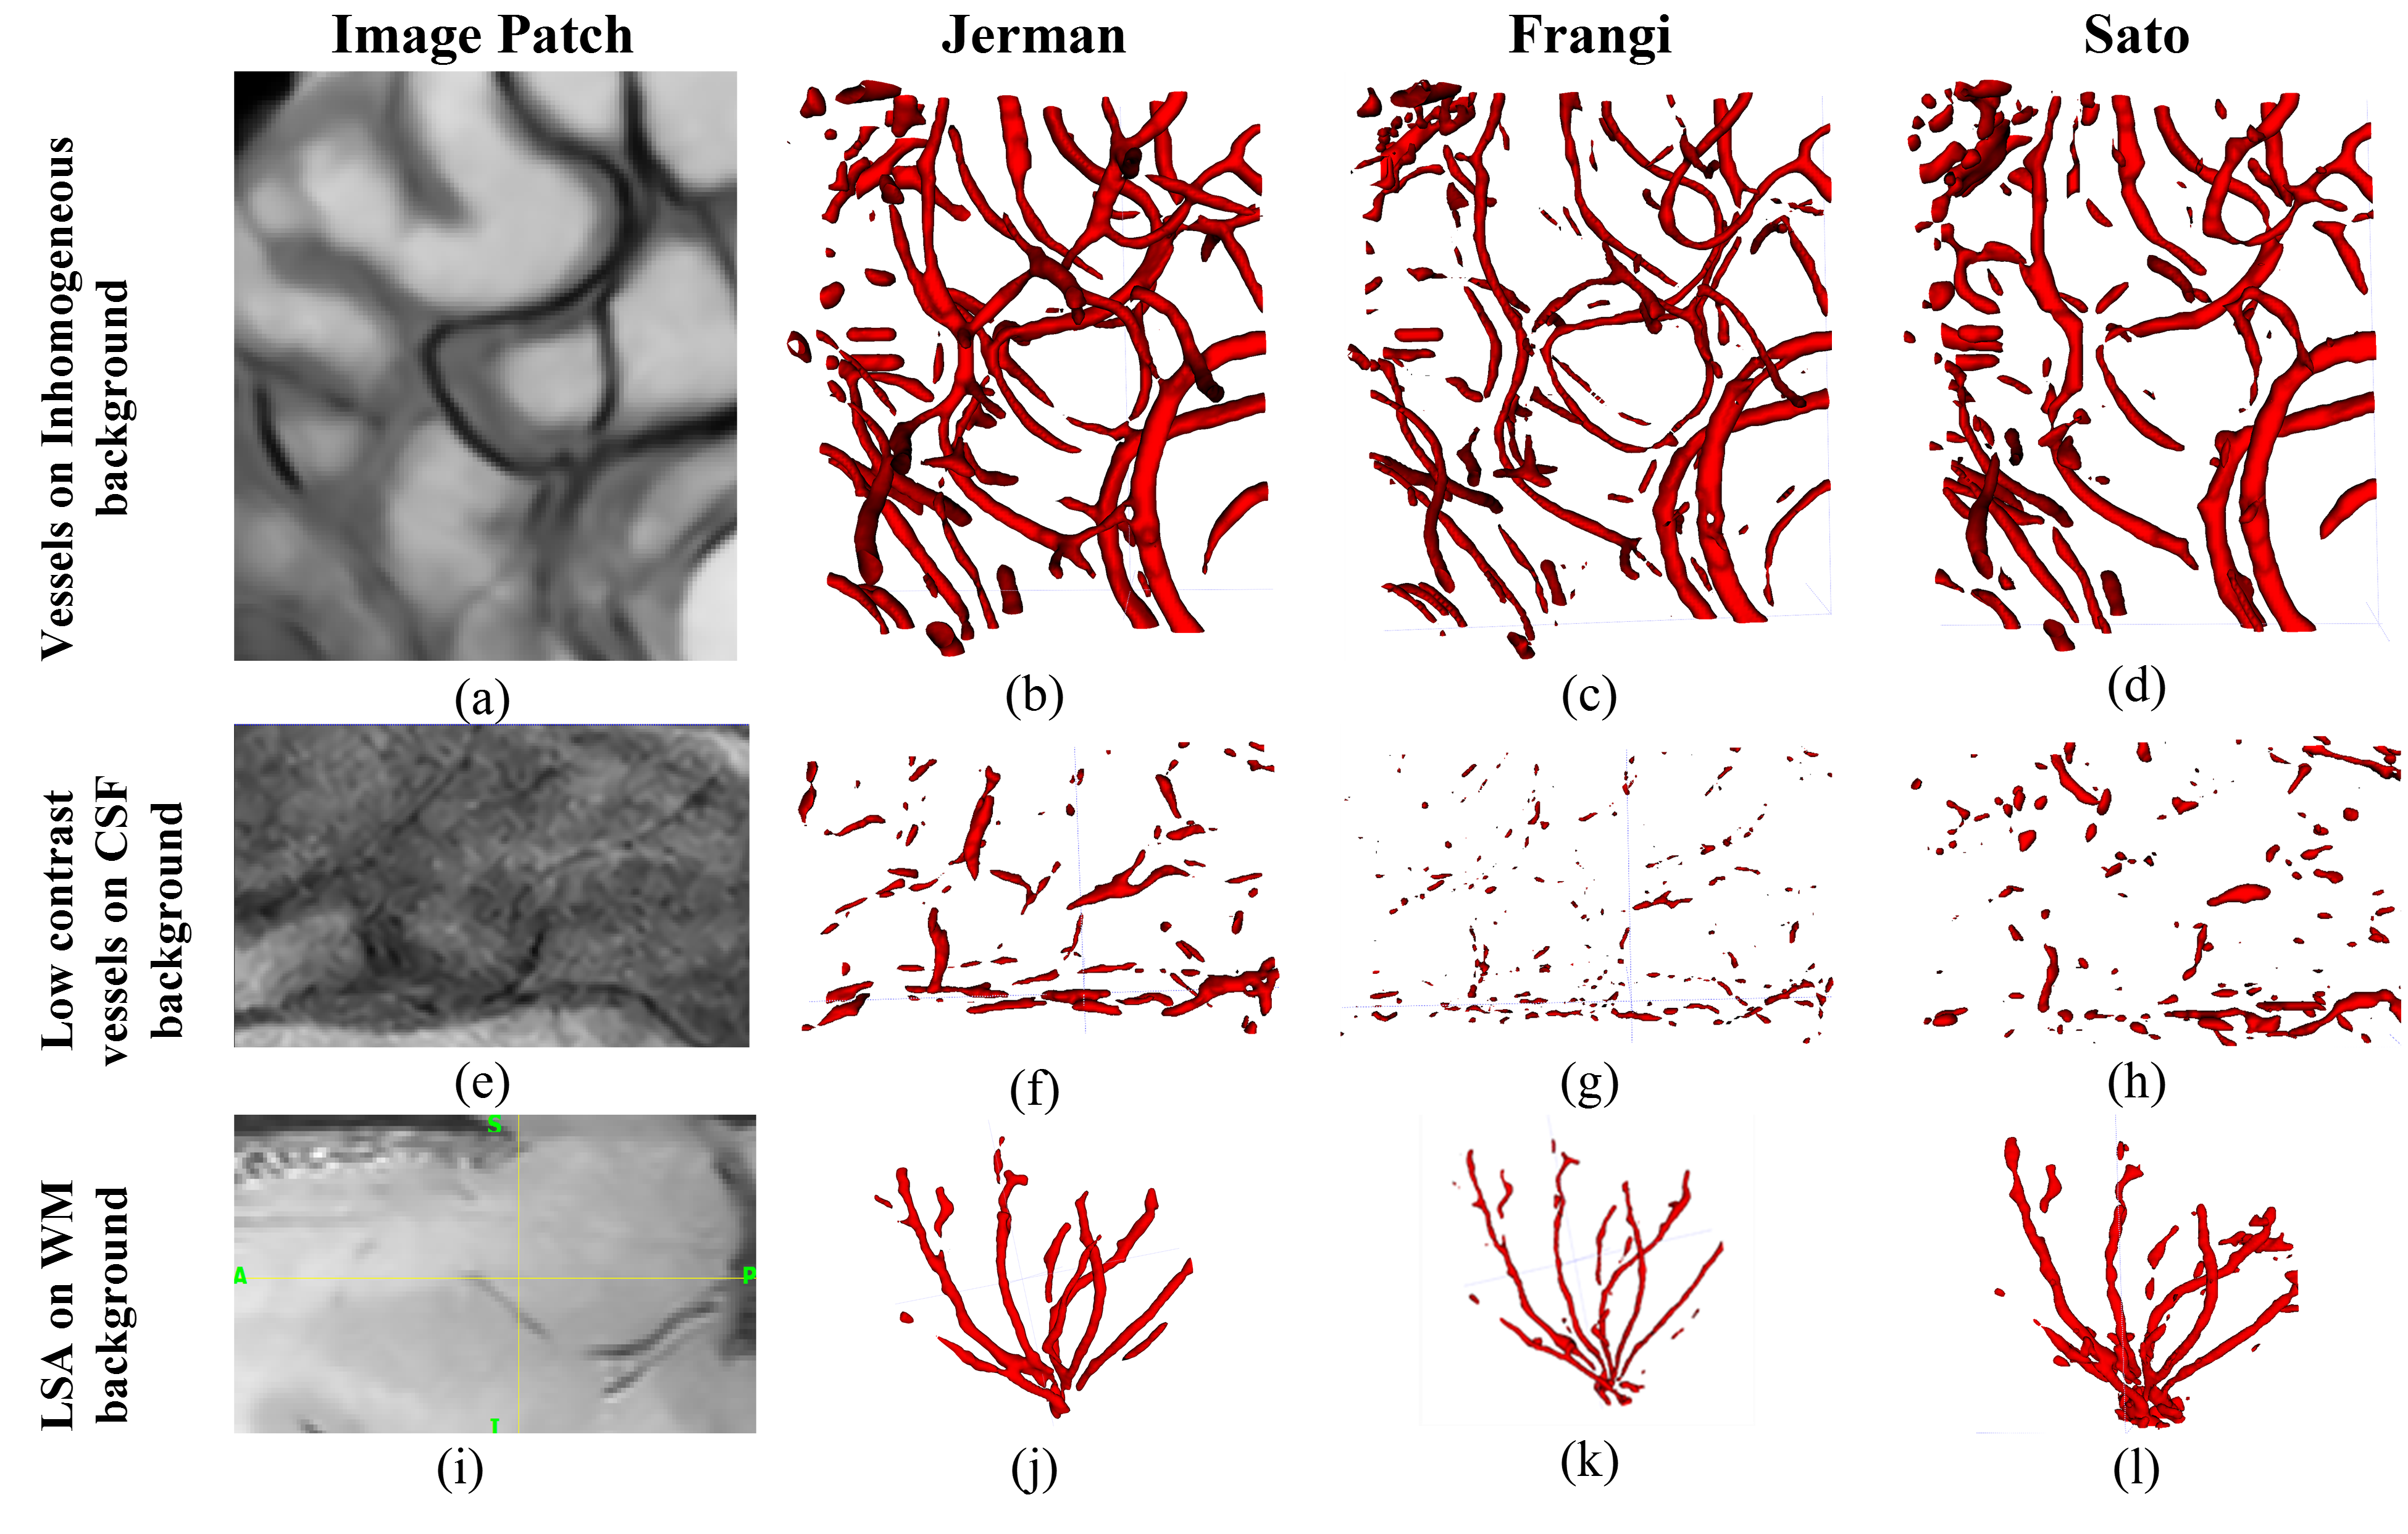
Multiscale Hessian-based methods have been evaluated for the enhancement and segmentation of the vessels. Vesselness maps of the pre-processed black-blood MRI images were obtained by Sato [2], Frangi [3], and Jerman filtering[4]. In the clinical experiments (Figure 3), to detect small vessels, the scale range was set to S= [0.5 – 0.7] voxels, (voxel size = 0.25mm x 0.25mm x 0.5mm), where S is the vessel radius. Afterwards, a binary vessel mask (BVM) was computed by applying Otsu’s adaptive thresholding. The result was post-processed by removing small, disconnected components (<200 voxels) and masked by eroded brain mask to remove Dural sinus and superficial veins.
Co-registration
To robustly co-register black-blood MRI and MPRAGE image pairs, a 3D-Affine registration with 12 landmark points was performed (Figure 1- 2(e-f)) using Elastix [5]. The landmarks were selected from the cerebrum, cerebellum, and brainstem regions.
Vessel Density Image (VDI) Mapping
Since small vessels distribution varies across individuals, a vessel density image (VDI) was calculated to allow effective localized comparison of vascular changes. VDI was computed for each subject by convolution of BVM with a 3D average kernel. To pool the VDIs from all subjects into the MNI Atlas, we implemented a non-linear 3D brain registration approach, where VDI was first reversely transformed to MPRAGE space using affine transformation, and then non-linearly transformed to the MNI Atlas using a B-spline transformation (Figure 1- 3(h, j)). The non-linear parameters were obtained by the registration of MPRAGE to the MNI Atlas (Figure 1- 3 (g, i)). After non-linear registration, all VDIs were normalized, and a p-value map was generated by comparing the registered VDIs of the two groups at voxel-level. For each voxel, a two-tailed student t-test was applied to examine the group difference between the VDI values of comparing groups.
Results and Discussion
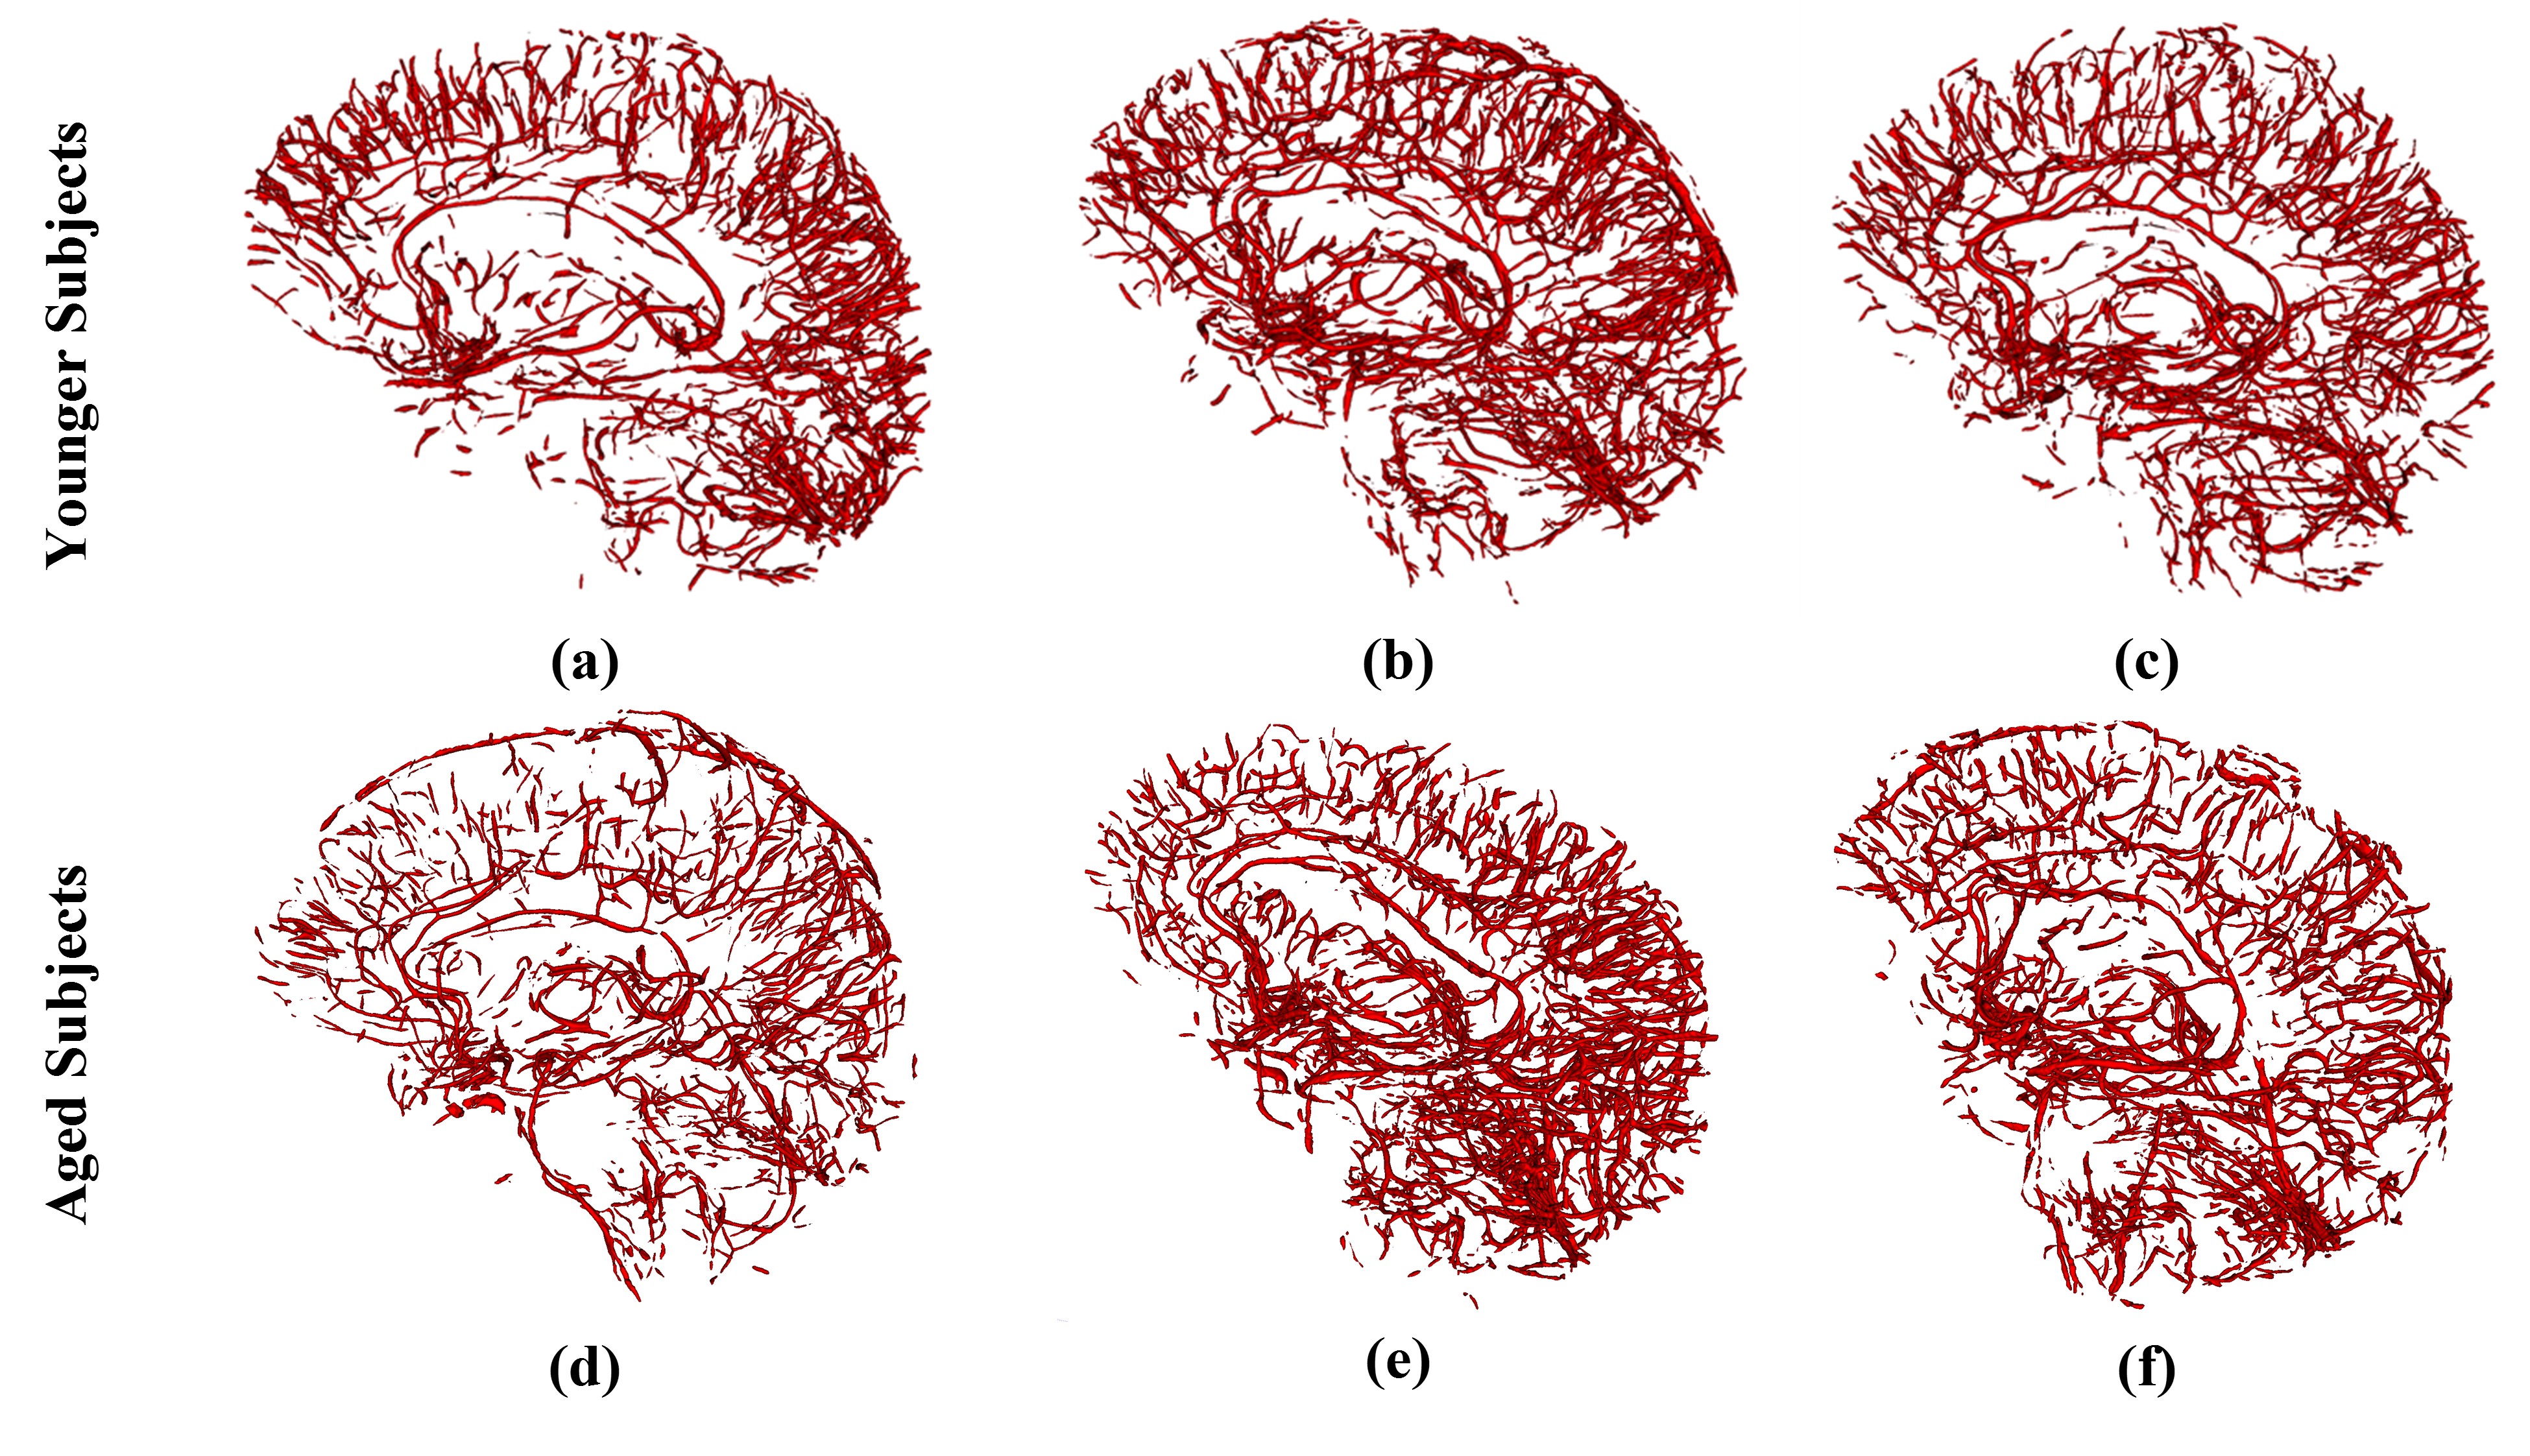
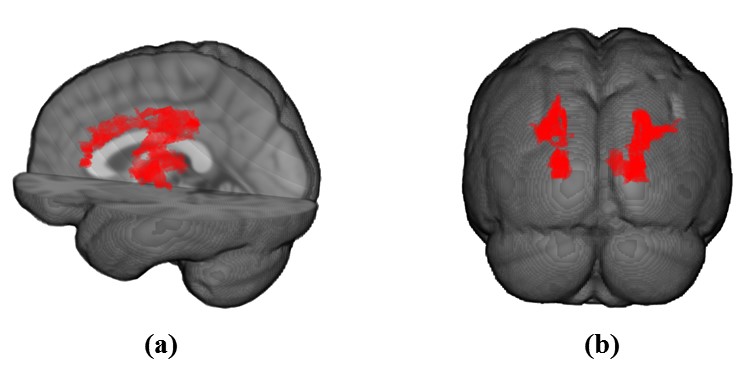
Figures 2 and 3 show examples of the segmentation results for each method on synthetic and clinical data, respectively. In synthetic simulations (Figure 2- (e, f)), the robustness to noise was quantitatively evaluated among the three methods using Dice metric. Jerman (Dice: 0.8) outperformed Frangi (Dice: 0.1) and Sato (Dice: 0) in high noise levels (noise-std> 0.9). Additionally, Jerman had higher response at vessel boundaries. In clinical data (Figure 3), the visual assessment of the three methods on image patches from high resolution 3D black-blood MRI demonstrated that it is feasible to perform automatic segmentation of the small vessels in regions with varying contrast. Jerman especially performed better for low contrast vessels of small size.Figure 4 shows the successful segmentation of 3D brain vasculature of the winning method, Jerman, on the subjects from two age groups. Vessel density differences among subjects is visible by qualitative comparison. In Figure 5, voxel-level statistics is shown between the young and aged groups in frontal and parietal lobes. Localized significant regions (P<0.01) with decreased vessel density in the aged group are shown with red-colored clusters. With further optimization, the Jerman model is a promising method for VDI mapping in black blood images.
Conclusion
We presented and evaluated a novel framework for automated segmentation and mapping of brain small vessels from black blood images acquired at 3T. Using filter-based segmentations and non-linear registration, 3D vessel mapping of brain is demonstrated to be feasible. This framework can serve as a tool for localized detection of vessel density changes in patients with neurovascular diseases.Acknowledgements
This work was supported by National Institutes of Health grants UH3-NS100614, and P41-EB015922.References
[1] S. J. Ma et al., "Characterization of lenticulostriate arteries with high resolution black-blood T1-weighted turbo spin echo with variable flip angles at 3 and 7 Tesla," Neuroimage, vol. 199, pp. 184-193, 2019/10/01/ 2019, doi: https://doi.org/10.1016/j.neuroimage.2019.05.065.
[2] Y. Sato et al., "Tissue classification based on 3D local intensity structures for volume rendering," IEEE Transactions on visualization and computer graphics, vol. 6, no. 2, pp. 160-180, 2000.
[3] A. F. Frangi, W. J. Niessen, K. L. Vincken, and M. A. Viergever, "Multiscale vessel enhancement filtering," Berlin, Heidelberg, 1998: Springer Berlin Heidelberg, in Medical Image Computing and Computer-Assisted Intervention — MICCAI’98, pp. 130-137.
[4] T. Jerman, F. Pernus, B. Likar, and Z. Spiclin, "Enhancement of Vascular Structures in 3D and 2D Angiographic Images," (in eng), IEEE Trans Med Imaging, vol. 35, no. 9, pp. 2107-2118, 09 2016, doi: 10.1109/TMI.2016.2550102.
[5] S. Klein, M. Staring, K. Murphy, M. A. Viergever, and J. P. Pluim, "elastix: a toolbox for intensity-based medical image registration," (in eng), IEEE Trans Med Imaging, vol. 29, no. 1, pp. 196-205, Jan 2010, doi: 10.1109/TMI.2009.2035616.
Figures