4894
Vessel Wall Imaging-Dedicated Automatic Processing Pipeline (VWI-APP): Towards Efficient and Reliable Intracranial Plaque Quantification1Bioengineering, University of California, Los Angeles, Los Angeles, CA, United States, 2Radiology, University of Southern California, Los Angeles, CA, United States, 3Radiation Oncology, University of California, Los Angeles, Los Angeles, CA, United States, 4Radiation Oncology, University of Southern California, Los Angeles, CA, United States, 5Biomedical Engineering, University of Southern California, Los Angeles, CA, United States
Synopsis
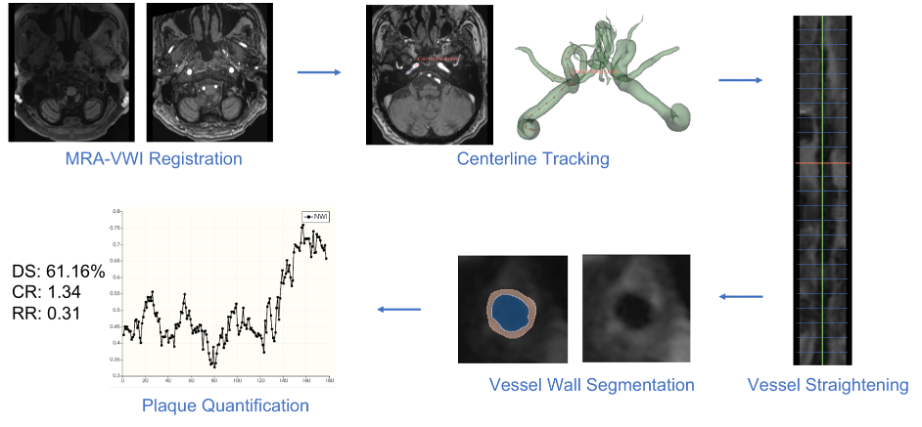
We propose an automatic pipeline for atherosclerosis plaque analysis based on magnetic resonance (MR) vessel wall imaging (VWI). The pipeline consists of five modules, i.e., 1) MR angiography (MRA) to VWI registration, 2) vessel centerline tracking, 3) vessel straightening and cross-sectional slices generating, 4) deep learning -based vessel wall and lumen segmentation, and 5) plaque quantification. The pipeline achieved good to excellent reliability for the clinically relevant plaque measures and largely reduced the analysis time required for physicians.
INTRODUCTION
Stroke is a worldwide leading cause of morbidity and mortality 1. Intracranial atherosclerosis disease (ICAD), characterized by lipid deposition, inflammation, and remodeling in the artery vessel wall, remains a major risk factor for stroke. Morphological vessel wall features, such as normalized wall index, arterial wall remodeling ratio, and plaque-to-wall contrast ratio, have been shown to be useful imaging surrogates for plaque burden quantification 2–4. These analyses build on lumen and vessel wall contouring on high-resolution, dark-blood magnetic resonance (MR) vessel wall imaging (VWI) 5. Despite the use of some image processing software, vessel contouring is typically performed manually on 2D slices that are generated by straightening the vessel along the vessel centerline and reconstructing the cross-sectional views. The centerline is also often manually prescribed. Therefore, VWI-based plaque quantification is currently time-consuming and subject to high inter- and intra-observer variations, which hinders the adoption of the imaging modality in ICAD workup. In this work, we have developed a software tool, named vessel wall imaging-dedicated automatic processing pipeline (VWI-APP), to maximally automate the entire analysis process. Specific design and initial performance evaluation are reported.METHODS
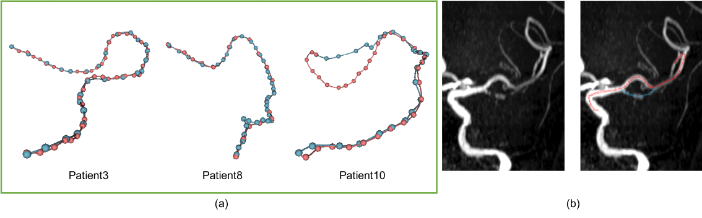
The VWI-APP is developed on 3D Slicer (slicer.org), a free, open-source software package. The pipeline consists of five modules (Fig. 1): 1) MR angiography (MRA) to VWI rigid registration, 2) MRA-based centerline tracking with Dijkstra's algorithm, 3) vessel straightening and slicing along the centerline in VWI, 4) VWI-based lumen and vessel wall segmentation, and 5) plaque feature quantification. Our specific technical development focused on modules 2), 4) and 5).Centerline Tracking: Centerline tracking is performed with Dijkstra's algorithm, which finds the shortest paths between the user input start and end points of a selected vessel segment. The centerline search is performed on the registered and then Z-score normalized MRA, denoted as mranorm, with a designed cost function:
\[ \mathcal{L}_\text{Dijkstra} = \begin{cases} & c, \text{mra}_{\text{norm}} < \text{thr}_l; \\ & \exp^{-1}{(a\cdot D)}, \text{mra}_{\text{norm}} > \text{thr}_h; \\ & 1, \text{ else}. \end{cases}\]
This cost function is to establish two barriers: 1) a foreground vs. background barrier established by image intensity threshold thrl to assign a huge cost c to the background, and 2) a centerline vs. edge barrier inside a vessel established by the Euclidean distance transform D and an inversed exponential function. The coefficient a is an empirically chosen hyperparameter that controls the gap between centerline points and edge points. thrh is another empirically chosen threshold hyperparameter that is slightly higher than the background threshold thrl to ensure a good separation between two adjacent vessel segments during distance transform. All the hyperparameters were tuned with respect to the performance of a randomly selected validation set, and the module was tested on ten patients. Some qualitative results are illustrated in Fig. 2.
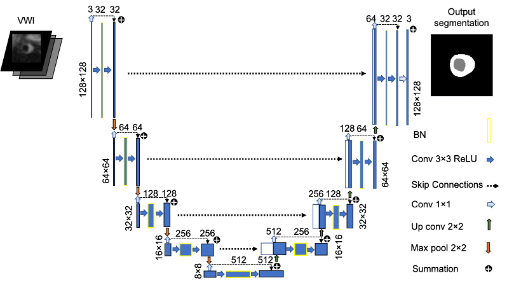
Vessel Wall Segmentation: Segmentation is performed with a recently developed 2.5D UNet deep neural network structure 6, illustrated as Fig. 3. The network takes three consecutive VWI slices as input and outputs the segmentation of the background, lumen, and the vessel wall for the middle slice with three output channels.
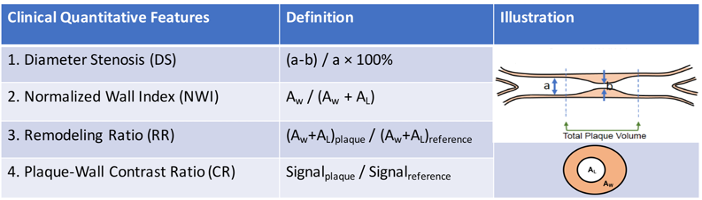
Plaque Feature Quantification: Clinically relevant quantitative plaque features, including diameter stenosis (DS), normalized wall index (NWI), remodeling ratio (RR), and plaque-wall contrast ratio (CR), are adopted in this module. Their definitions are illustrated in Fig. 4.
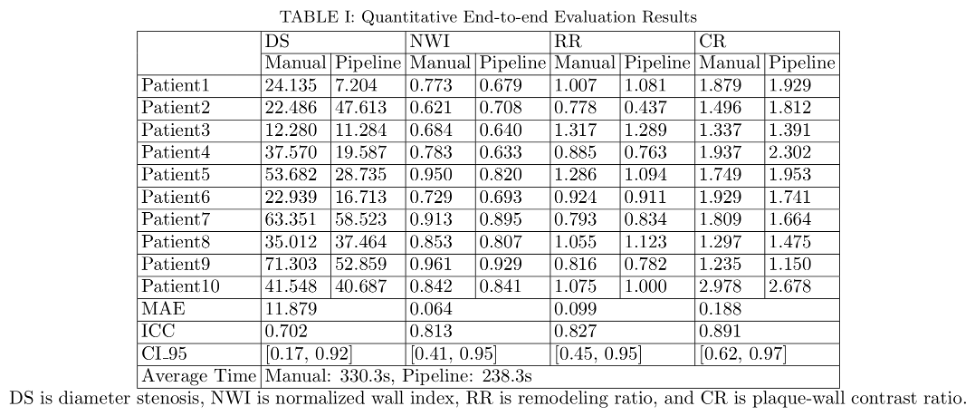
End-to-end Evaluation: Ten patients were used for evaluation. The performance of the VWI-APP was evaluated on the culprit lesion through comparison with the manual quantification by the same radiologist with a two-week time interval. During manual quantification, the centerline was manually tracked followed by computer-aided vessel straightening, and cross-sectional view generation in 3D Slicer (version 4.11.0) 7. The cross-sectional images were then exported to Horos (version 3.3.6) for manual measurement of area and signal intensity in hand-drawn regions of interest. Finally, DS, NWI, RR, and CR were manually calculated. The mean absolute error (MAE) of DS, NWI, RR, and CR metrics, and the averaged time consumed by using the pipeline as well as manual quantification were evaluated. Intraclass correlation coefficient (ICC) between a manual quantification process and the proposed pipeline and the corresponding 95% confidence intervals (CI_95) were reported 8.
RESULTS
Three out of ten cases needed manual adjustment of the centerline and contours using VWI-APP. The average processing time was 238.3s using VWI-APP plus expert adjustment, which was more time-efficient than the completely manual process (330.3s). The measured feature values are reported in TABLE I. The ICC analysis indicated excellent agreement between automatic quantification and manual quantification was achieved for NWI, RR, and CR measures, and good agreement for DS.DISCUSSION
VWI-APP provides good to excellent agreement with the manual fashion in plaque feature quantification, and largely reduces the intracranial plaque analysis time for physicians. The time reduction would be more beneficial for more extensive calculations such as the total plaque volume, which requires the segmentation for each slice of a segment. The manual input can be further automated by extracting the whole vessel tree, applying vessel wall segmentation based on VWI to the suspicious stenosis segments determined by MRA analysis, and performing quantitative analysis to each segment 9. Large-scale multi-institutional validation is warranted to establish the role of this software tool.Acknowledgements
This work was supported in part by NIH/NHLBI R01 HL147355.References
1. Murphy SJX, Werring DJ. Stroke: causes and clinical features. Medicine (Baltimore). 2020;48(9):561-566. doi:https://doi.org/10.1016/j.mpmed.2020.06.002
2. Xiao J, Padrick MM, Jiang T, et al. Acute ischemic stroke versus transient ischemic attack: Differential plaque morphological features in symptomatic intracranial atherosclerotic lesions. Atherosclerosis. 2021;319:72-78. doi:10.1016/j.atherosclerosis.2021.01.002
3. Xiao J, Song S, Schlick K, et al. Disparate trends of atherosclerotic plaque evolution in stroke patients under 18-month follow-up: a 3D whole-brain magnetic resonance vessel wall imaging study. Neuroradiol J. 2021:197140092110269. doi:10.1177/19714009211026920
4. Qiao Y, Anwar Z, Intrapiromkul J, et al. Patterns and Implications of Intracranial Arterial Remodeling in Stroke Patients. Stroke. 2016;47(2):434-440. doi:10.1161/STROKEAHA.115.009955
5. Bodle JD, Feldmann E, Swartz RH, Rumboldt Z, Brown T, Turan TN. High-Resolution Magnetic Resonance Imaging. Stroke. 2013;44(1):287-292. doi:10.1161/STROKEAHA.112.664680
6. Zhou H, Xiao J, Fan Z, Ruan D. Intracranial Vessel Wall Segmentation For Atherosclerotic Plaque Quantification. In: ; 2021:1416-1419. doi:10.1109/ISBI48211.2021.9434018
7. Kikinis R, Pieper SD, Vosburgh KG. 3D Slicer: A Platform for Subject-Specific Image Analysis, Visualization, and Clinical Support. In: Intraoperative Imaging and Image-Guided Therapy. Springer New York; 2014:277-289. doi:10.1007/978-1-4614-7657-3_19
8. Koo TK, Li MY. A Guideline of Selecting and Reporting Intraclass Correlation Coefficients for Reliability Research. J Chiropr Med. 2016;15(2):155. doi:10.1016/J.JCM.2016.02.012
9. Tetteh G, Efremov V, Forkert ND, et al. DeepVesselNet: Vessel Segmentation, Centerline Prediction, and Bifurcation Detection in 3-D Angiographic Volumes. 2019.
Figures