4893
Detecting Residual Iron Contrast after Ferumoxytol Infusion in Cerebral Vasculature Using High-Resolution SWI at 7T1NYU Grossman School of Medicine, New York, NY, United States, 2Wayne State University, Detroit, MI, United States
Synopsis
Ultra-small superparamagnetic iron oxides (USPIO) enhanced MRI has shown its great potential in detecting vascular abnormality in the brain on T2*-weighted sequences for better showing both macro- and micro-vasculature. In this study, we investigated the quantitative phase changes after Ferumoxytol infusion and examined its residual contrast in brain vasculature at 3-, 7- and 14-day follow-up SWI scans. To quantitatively measure the Ferumoxytol-induced susceptibility, the veins parallel to the main field were chosen for measurement. After measuring the intensity on high-pass filter phase images, the paired t-test showed a significant difference between pre-contrast and post-3d values from the follow-up visits.
INTRODUCTION:
Ultra-small superparamagnetic iron oxides (USPIO) enhanced MRI has shown its great potential in detecting vascular abnormality in the brain on T2*-weighted sequences for better showing both macro- and micro-vasculature 1-3. However, it is not clear how long this contrast enhancement can last and be detected in the vascular system. In this study, we investigated the quantitative phase changes after Ferumoxytol infusion and examined its residual contrast in brain vasculature at 3-, 7- and 14-day follow-up SWI scans.METHODS:
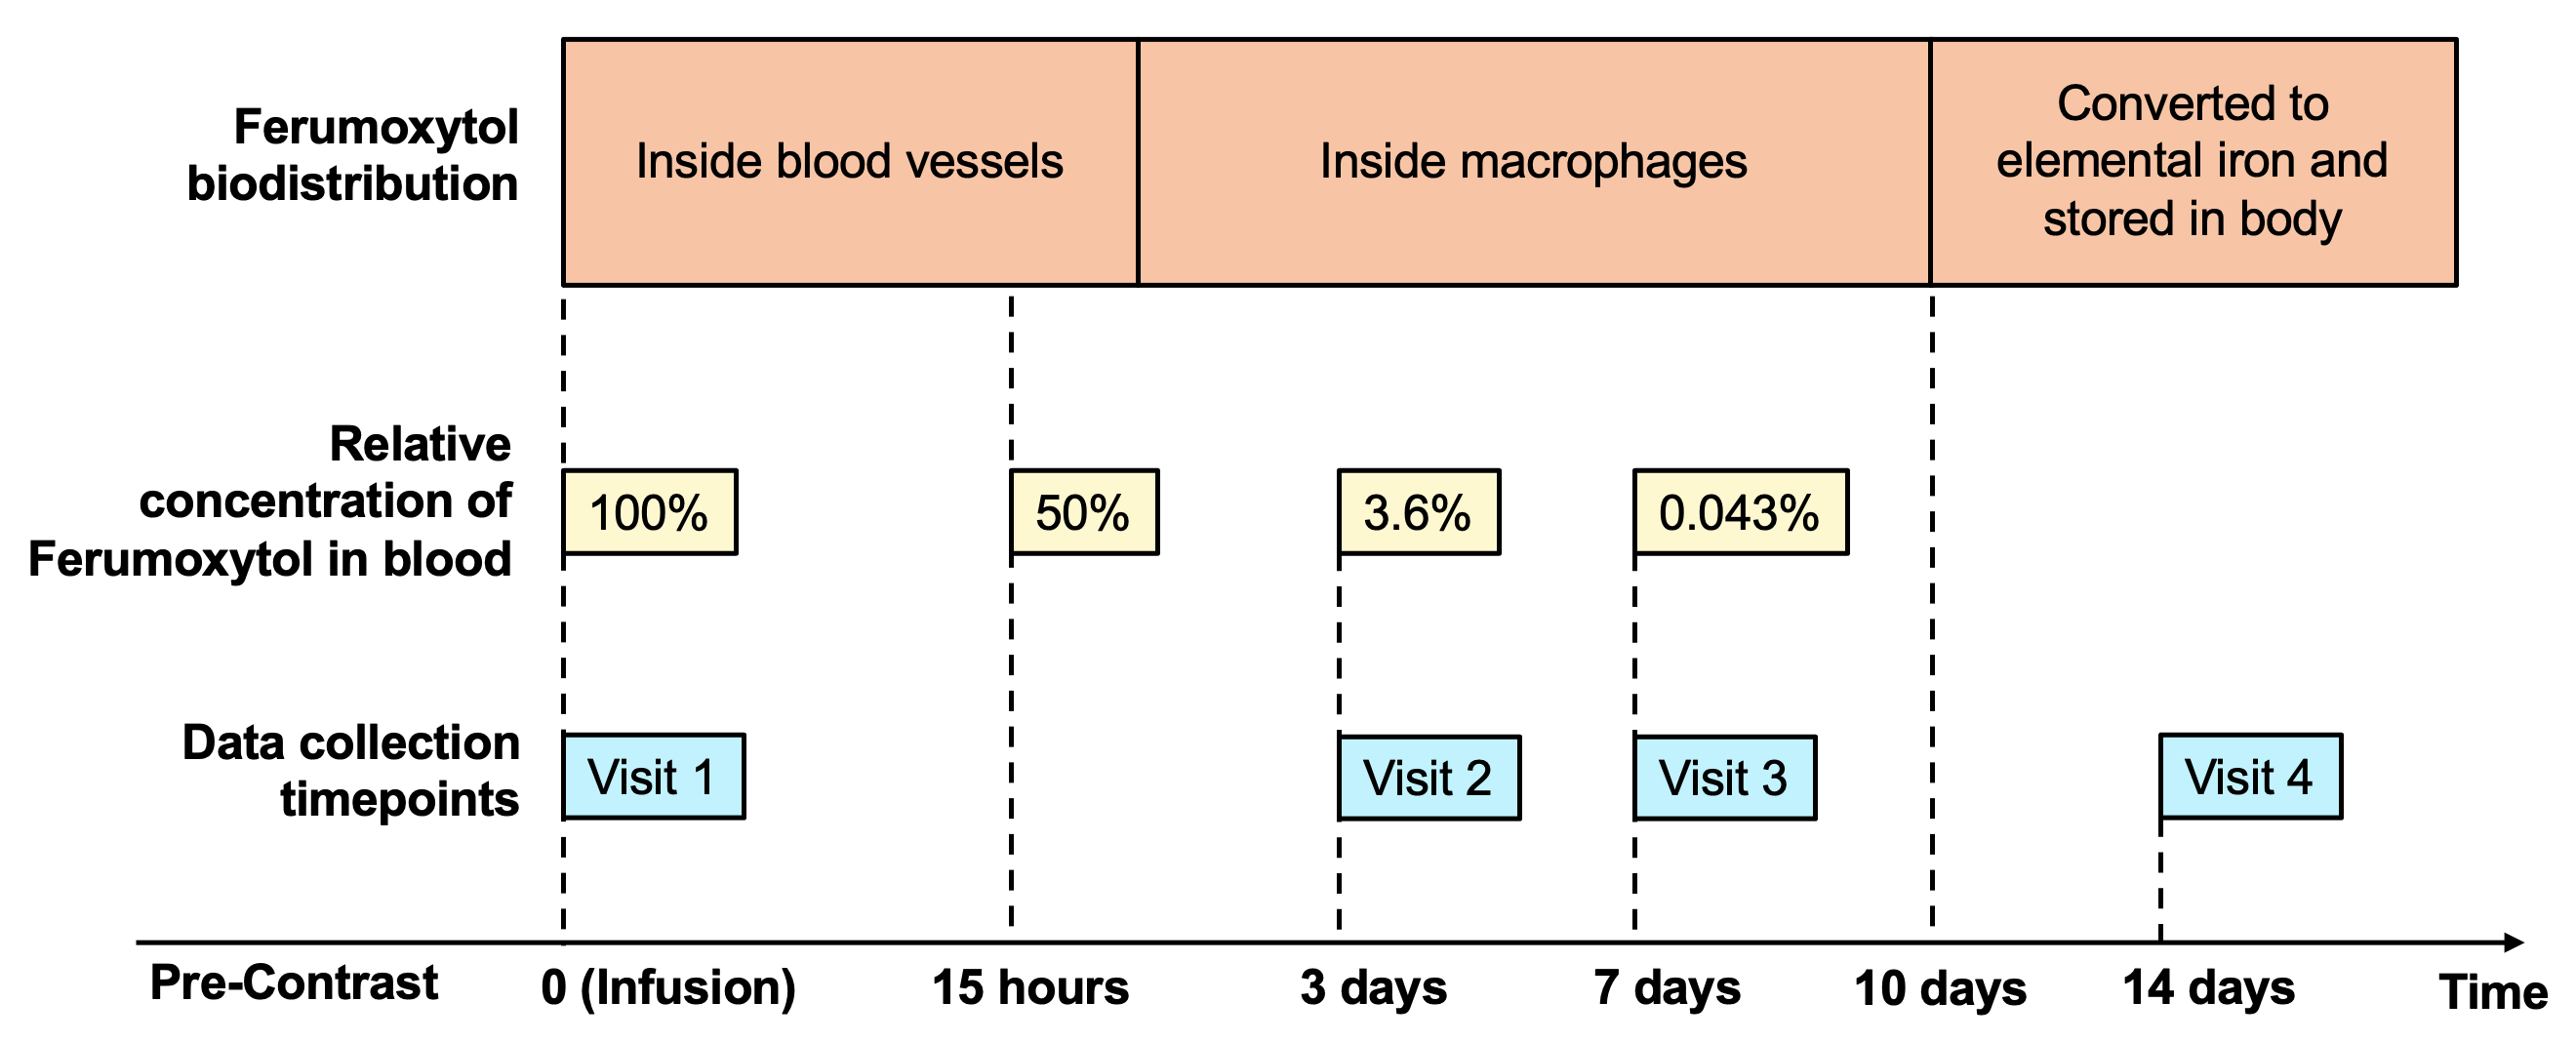
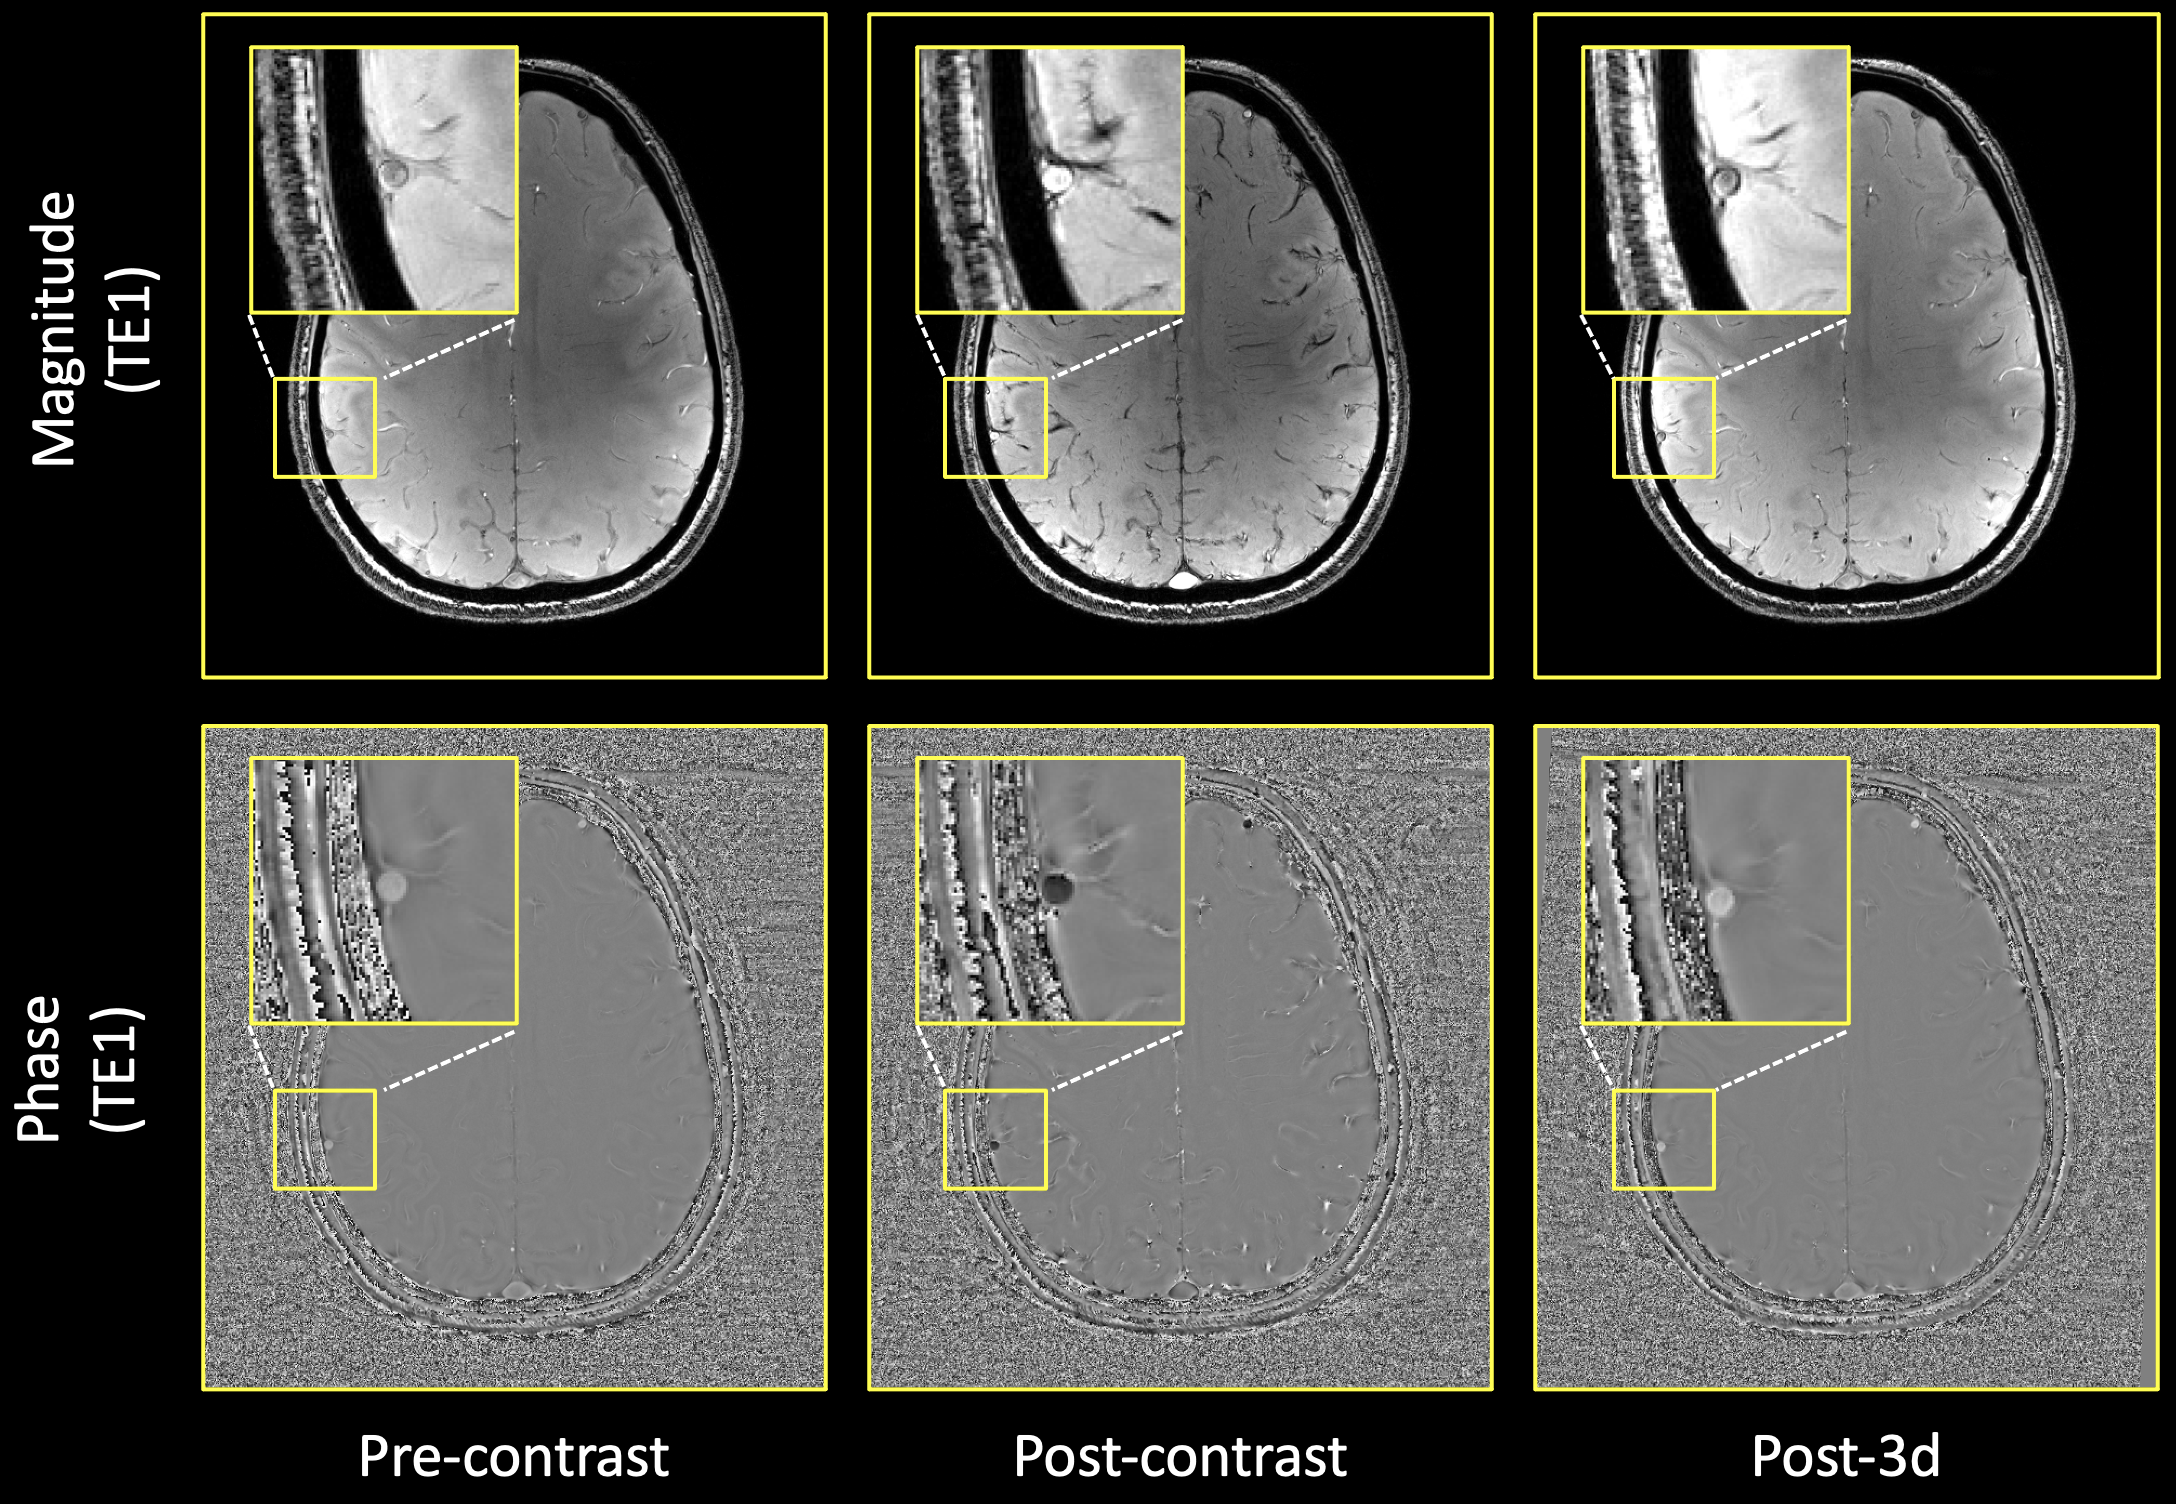
6 healthy subjects (age 22-70) were scanned under a 7T MRI scanner using a high-resolution (0.25×0.25×1 mm3) dual-echo (TE: 7.5 ms and 15 ms) SWI sequence at 5 timepoints spanned across 2 weeks. Ferumoxytol, which is an FDA approved USPIO for human use, was administered through intravenous slow infusion over 15 minutes at a dosage of 3 mg/kg. As shown in Figure 1, each subject underwent a baseline pre-Ferumoxytol SWI and post-Ferumoxytol SWI at the first visit and then performed at 3 further visits at 3 days, 7 days and 14 days after infusion for assessing the residual contrast in brain vasculature using the same sequence. T2-weighted and T1-MPRAGE were also performed as anatomical imaging. The timeline is designed with consideration of the biodistribution of Ferumoxytol and its intravascular half-life (15 hours)5 (Figure 1) and its extravascular distribution (e.g., in liver) with much longer time period6. The minimum intensity projection (mIP) of 6 slices was used to visually represent the brain vasculature on the SWI data. To quantitatively measure the Ferumoxytol-induced susceptibility, the veins parallel to the main field were chosen for measurement7 to avoid the magnetic dipole induced phase variations from angled blood vessels. The first echo was used because it was flow compensated in the read and slice directions. To remove the background phase, a 96x96 high-pass filter was used on the phase image. Post and post-3d data were co-registered to the pre-contrast data using SPM12. ROIs were drawn on individual images with reference to the co-registered images for more accurate measurement. After drawing 20 ROIs per subject, paired t-test was used to compare the pre- and other post-contrast data. The measurement was made on the phase images, which have high fidelity regarding the susceptibility quantification.RESULTS:
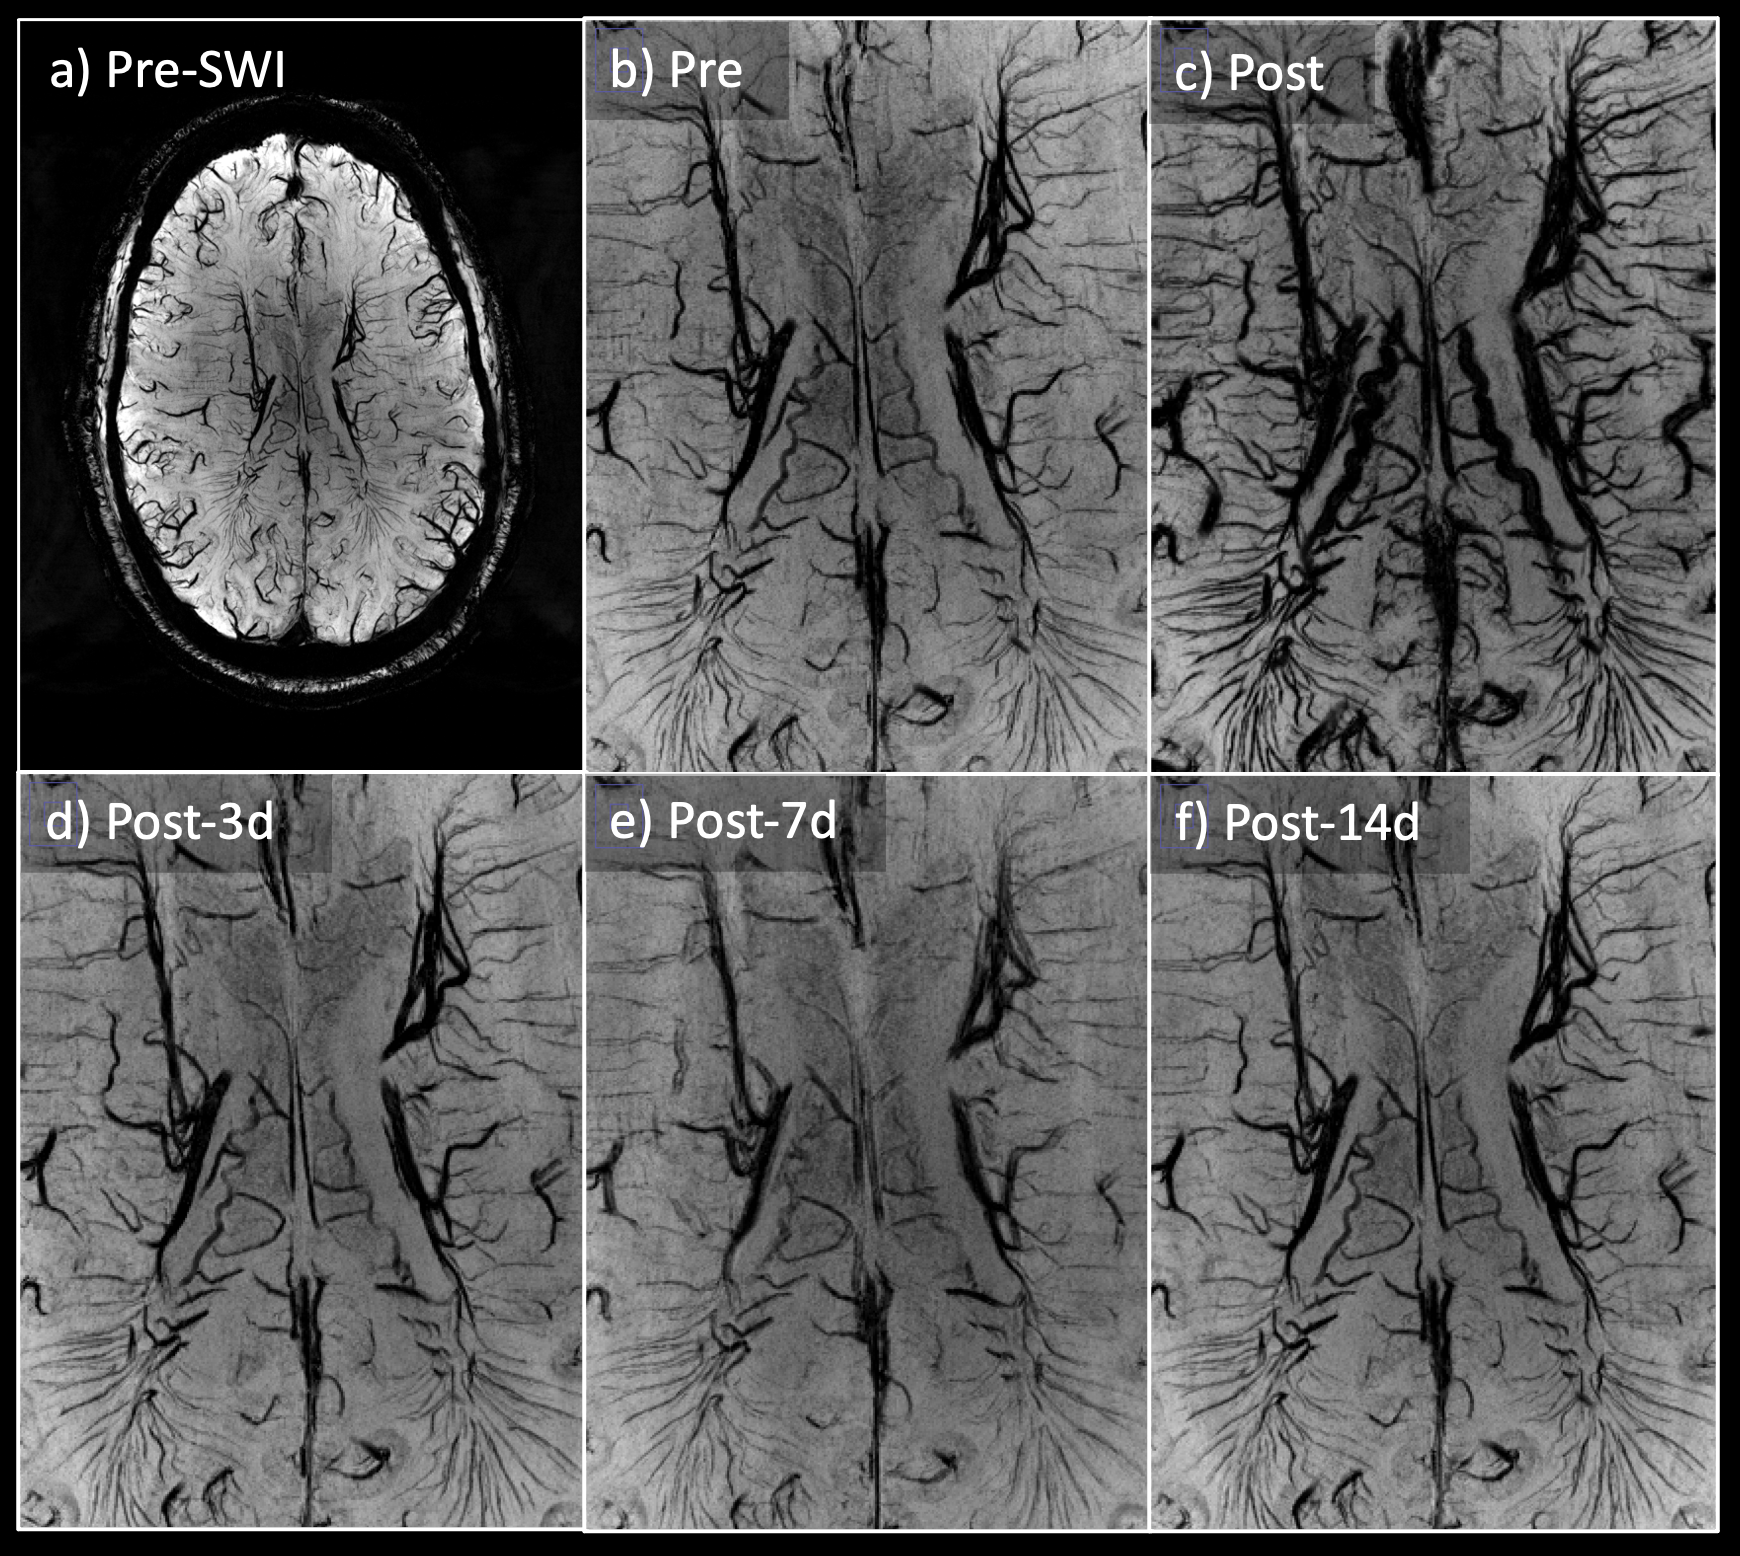
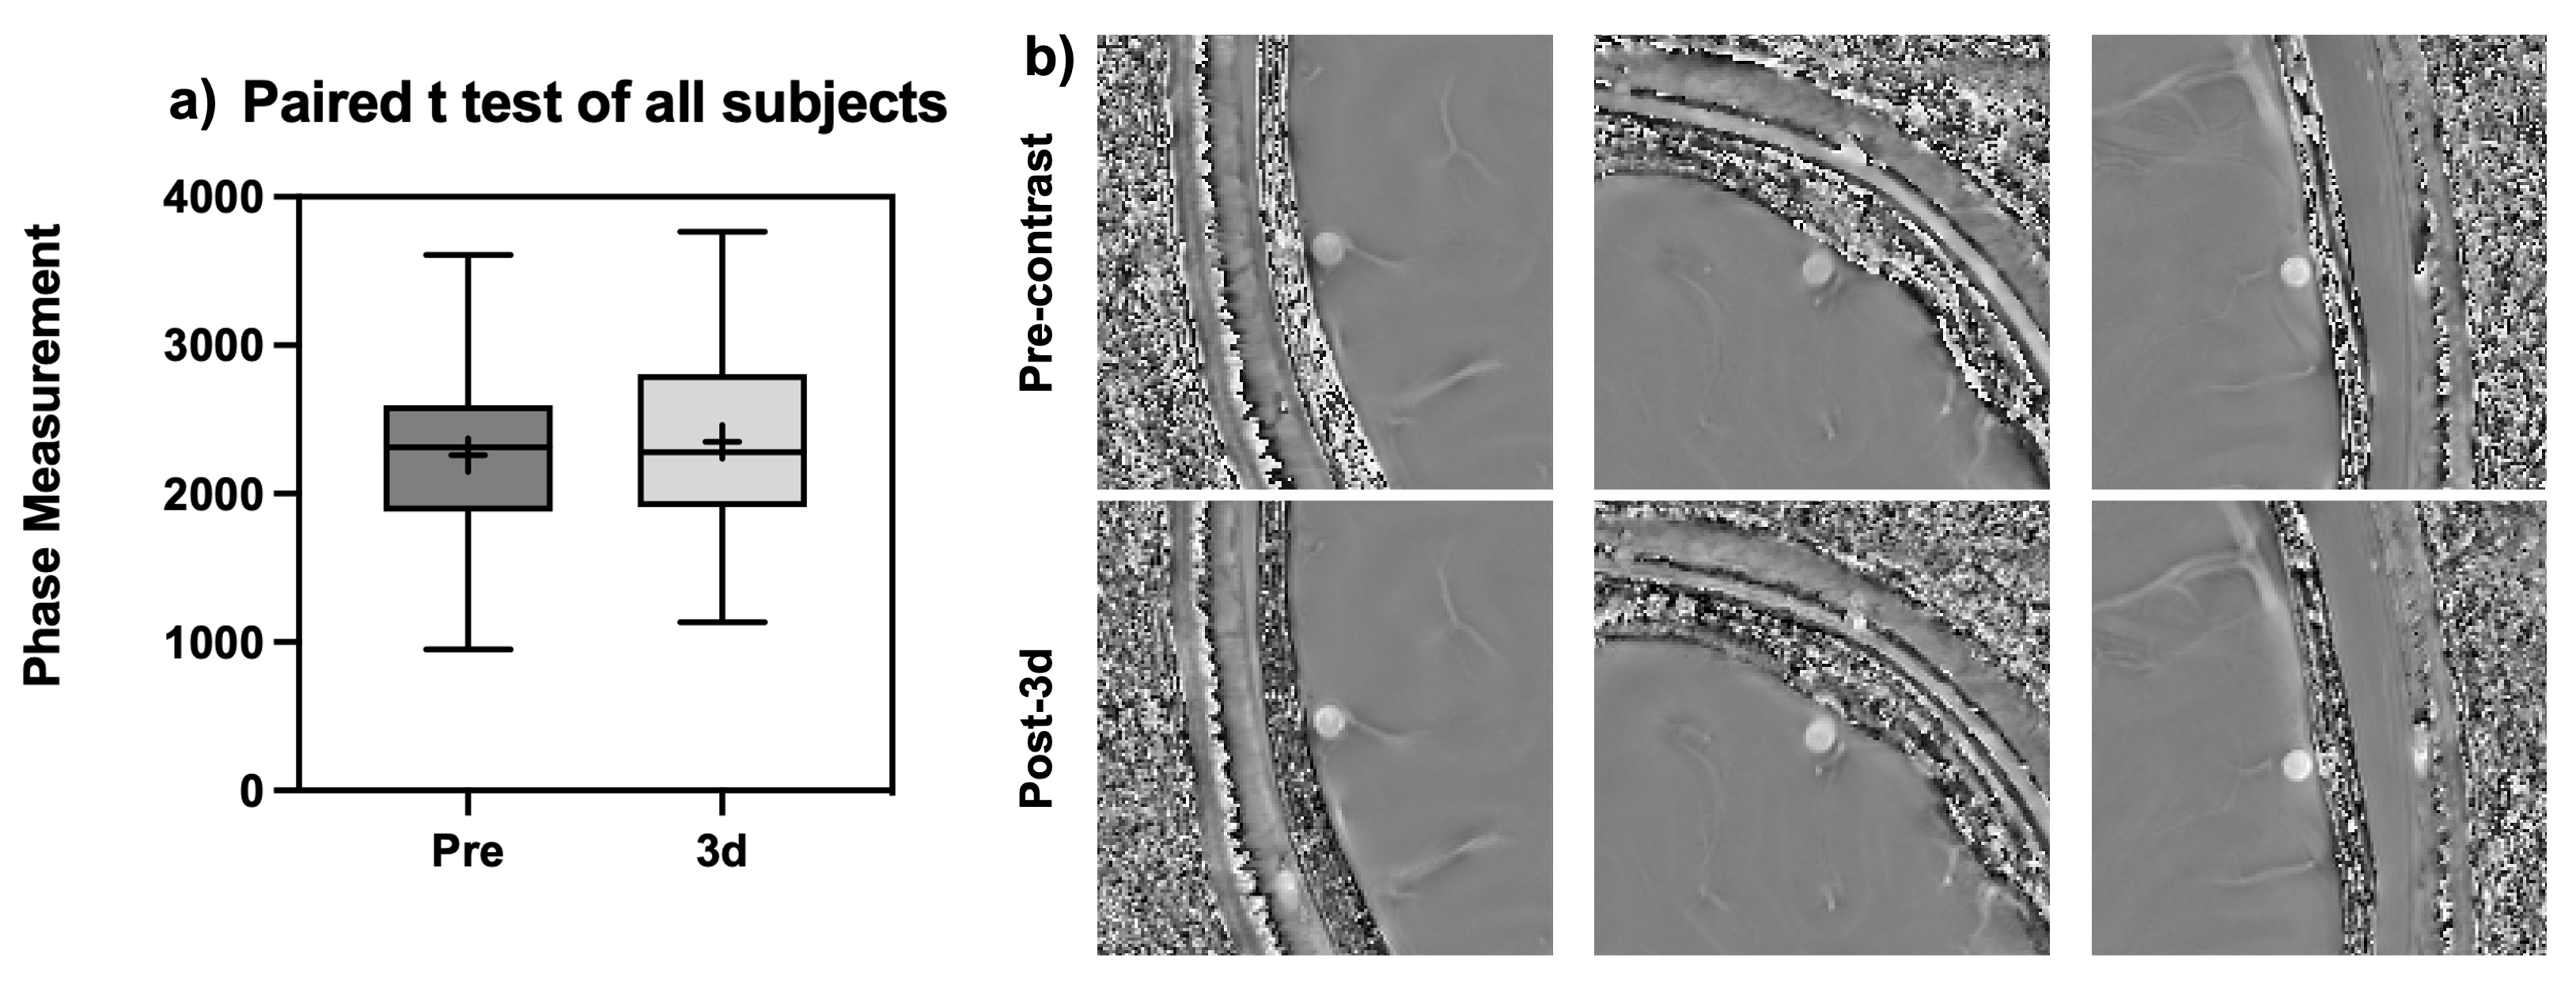
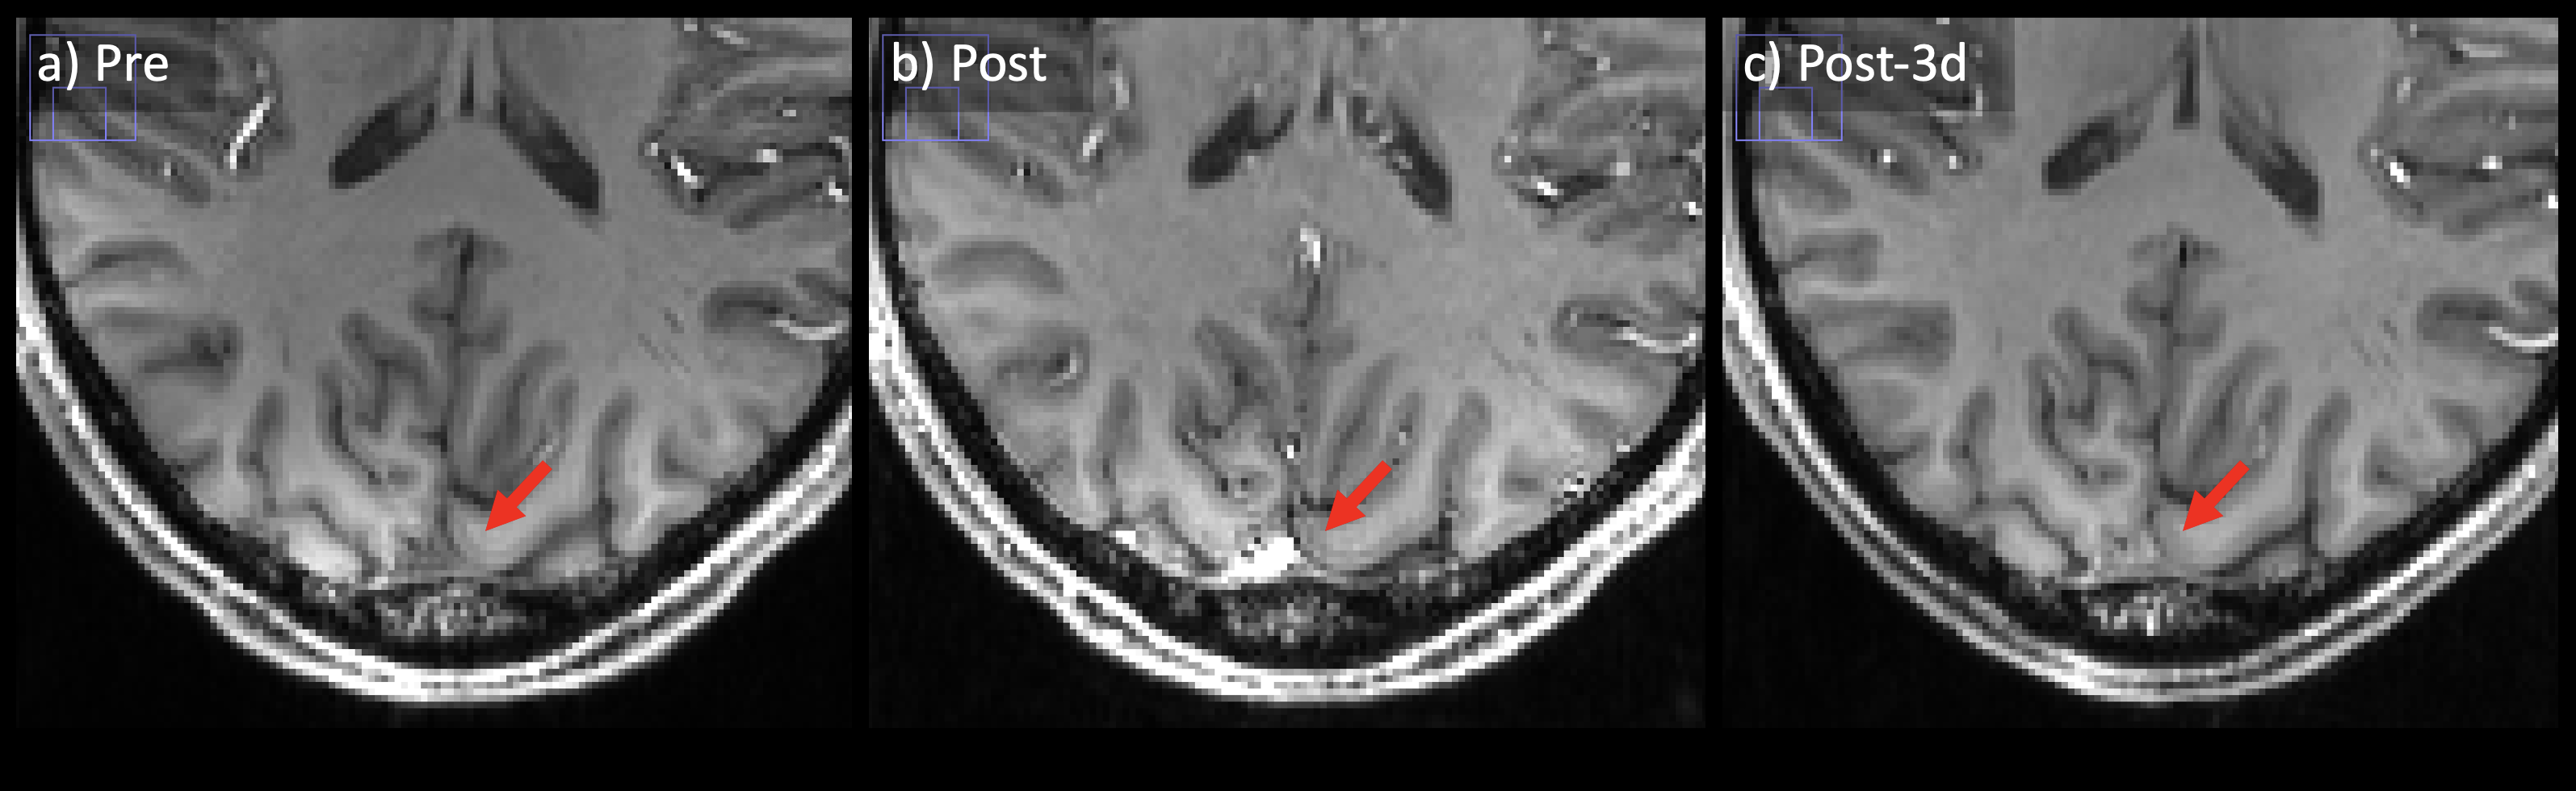
With the infusion of Ferumoxytol, more vascular structures were visually enhanced compared to pre-contrast data (Figure 2). Arteries were shown in the second echo, which were previously unseen without the contrast. Veins showed significant blooming effect, especially in the second echo. There is significant improvement for micro-vasculature to be seen on postcontrast SWI. Such USPIO-induced vascular contrast showed significantly reduced on the images from the follow-up visits by visual inspection (Figure 2). Comparing pre-contrast and post-3d images, it is visible that the vessels are slightly darker at post-3d. After measuring the intensity on high-pass filter phase images (Figure 3), paired t-test was used to compare pre-contrast and post-contrast values from the follow-up visits. Taking all six subjects, there was a significant difference between pre-contrast and post-3d data (p = 0.03) showing slightly higher phase values on post-3d data (Figure 4). There was no significant difference between the pre-contrast value and post-7d and post-14d values. T1-MPRAGE images also showed visible difference between pre-contrast and post-3d data. It is shown that at superior sagittal sinus, post-3d images are brighter than the pre-contrast images (Figure 5).DISCUSSION AND CONCLUSION:
Imaging small brain vessels can be made possible by introducing Ferumoxytol contrast agent. The change in susceptibility values of these vessels provided largely improved contrast in high-resolution SWI images. Ferumoxytol can also increase the susceptibility of the faster blood flow in arteries, providing more opportunities for artery imaging. The enhancement of micro-vasculature provided potential for imaging vascular abnormalities that are otherwise difficult to detect. The method of measuring phase intensity as a direct representation of susceptibility is reliable. It was showed there is residual Ferumoxytol left at 3 days after the initial infusion. Theoretically, there should be 3.6% of initial Ferumoxytol left in blood, according to the half-life of 15 hours. This is consistent with our result. The small amount of residual iron is detectable using high-resolution SWI imaging. It should be noted that the residue might interfere with other clinical MRI scans, thus should be avoided unless for intended purposes.Acknowledgements
This study was funded by National Institute of Health grants (RF1 NS11041, R56 AG060822, R01 NS108491, R13 AG067684, P30 AG066512). This study is also supported by Alzheimer’s Association (AARG-17-533484).References
1. Christen T, Ni W, Qiu D, Schmiedeskamp H, Bammer R, Moseley M, et al. High-resolution cerebral blood volume imaging in humans using the blood pool contrast agent ferumoxytol. Magn Reson Med 2013;70:705–10. doi:10.1002/mrm.24500.
2. Liu S, Brisset JC, Hu J, Haacke EM, Ge Y. Susceptibility weighted imaging and quantitative susceptibility mapping of the cerebral vasculature using ferumoxytol. J Magn Reson Imaging 2018;47:621–33. doi:10.1002/jmri.25809.
3. Liu S, Buch S, Chen Y, Choi H-S, Dai Y, Habib C, et al. Susceptibility-weighted imaging: current status and future directions. NMR Biomed 2017;30:e3552. doi:10.1002/nbm.3552.
4. Nguyen KL, Yoshida T, Kathuria-Prakash N, Zaki IH, Varallyay CG, Semple SI, et al. Multicenter Safety and Practice for Off-Label Diagnostic Use of Ferumoxytol in MRI. Radiology. 2019 Dec;293(3):554-564. doi: 10.1148/radiol.2019190477.
5. Storey P, Lim RP, Chandarana H, Rosenkrantz AB, Kim D, Stoffel DR, Lee VS. MRI assessment of hepatic iron clearance rates after USPIO administration in healthy adults. Invest Radiol. 2012 Dec;47(12):717-24. doi: 10.1097/RLI.0b013e31826dc151.
6. Sehgal V, Delproposto Z, Haacke EM, Tong KA, Wycliffe N, Kido DK, Xu Y, Neelavalli J, Haddar D, Reichenbach JR. Clinical applications of neuroimaging with susceptibility-weighted imaging. J Magn Reson Imaging. 2005 Oct;22(4):439-50. doi: 10.1002/jmri.20404.
Figures