4892
Predicting Hematoma Expansion after Spontaneous Intracranial Hemorrhage Through a Magnetic Resonance-Based Radiomics Model
1Canon Stroke and Vascular Center, Buffalo, NY, United States, 2Jacobs School of Medicine and Biomedical Sciences, Buffalo, NY, United States, 3Department of Neurosurgery, University at Buffalo, Buffalo, NY, United States, 4Department of Bioinformatics, University at Buffalo, Buffalo, NY, United States, 5Department of Biomedical Engineering, University at Buffalo, Buffalo, NY, United States, 6Department of Biomedical Engineerinng, University at Buffalo, Buffalo, NY, United States
Synopsis
Intracranial hemorrhage (ICH) is bleeding within the cranium and occurs within the brain tissue, ventricles, and intracranial space. Hematoma expansion following an ICH has been related to increased mortality and morbidity inpatients. To detect ICH patients at risk, machine learning models can be used to predict whether or not hematoma expansion will occur. This study aims to assess the feasibility of machine learning prediction models using a radiomics approach. The highest sensitivity results indicated as 95% confidence intervals are 0.68 ± 0.004 and 0.72 ± 0.004, were achieved by support vector machine and logistic regression classifier models, respectively.
Introduction
In the United States, spontaneous intracranial hemorrhage (ICH) is the deadliest stroke subtype with a 44% mortality rate within 30 days of symptom onset. More than 75% of ICH patients are either deceased or have a severe disability at 6 months following the initial presentation.1 Approximately 33% of these patients continue to bleed during hospitalization and demonstrate significant hematoma expansion (HE).2 Once HE occurs, treatment options are limited and a poor functional outcome is often seen. Due to this, HE is seen as a vital predictor of poor prognosis in ICH patients, but early identification of patients at the highest risk of HE remains a challenge.Radiomics is a data mining tool that extracts features from medical imaging for quantitative image feature analysis. It is based on the idea that medical images such as magnetic resonance imaging (MRI) scans contain information imperceivable by the human eye and therefore computerized mathematical analysis is necessary to predict disease state progression.3 This study aimed to investigate whether use of radiomic features in ICH patients from their initial MRI scans may provide a clinically relevant prognosis accuracy for HE.
Methods
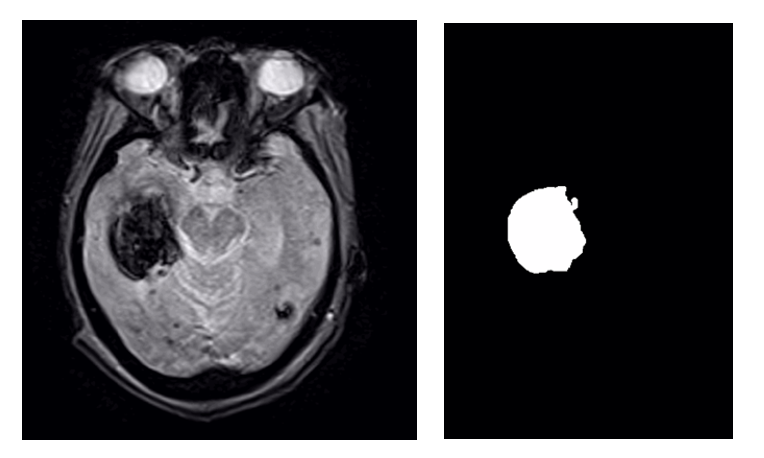
MRI data collection was conducted using a Vantage Titan 1.5 Tesla MRI unit (Canon Medical Systems Corporation, Otawara, Japan). T2* acquisition protocol was utilized with repetition and echo times of 20 ms and 434 ms, respectively. Image data was reconstructed in the axial plane with a matrix size of 224 pixels by 206 pixels, an in-plane resolution of 1.1 mm and a slice thickness of 5 mm.200 ICH patients (70 HE, 130 non-HE) who presented with stroke-like symptoms between August 2016 and December 2019 underwent T2* MRI and were evaluated for this study. HE was defined as a 33% or more volume increase or an increase in greater than 6 mL from the baseline MRI volume. Six supervised machine learning algorithms that applied the radiomic features were used for classification. These included Support Vector Machine (SVM), Naïve Bayes (NB), Decision Tree (DT), Random Forest (RF), Logistic Regression (LR), and K-Nearest Neighbor (KNN). Data augmentation was performed by mirroring each MRI image over the two-dimensional vertical axis to increase the dataset size, therefore improving performance metrics. A training:testing split of 80:20 and 20 iterations of Monte Carlo cross-validation were also performed to prevent overfitting and assess network variability, respectively. Generating a region of interest (ROI) around the hemorrhagic region was the first step to begin radiomic feature extraction. The central hematoma slice was determined in each MRI scan by calculating hematoma area for each axial slice and selecting the slice that contained the largest area. The hemorrhage labels were manually generated using 3D Slicer’s (Kitware, Chapel Hill, North Carolina) volume rendering and ROI modules.
Segment-based feature extraction was performed by calculating single values per feature for the hemorrhagic mask using Python's Pyradiomics package. We followed the guidelines proposed by the Image Biomarker Standardization Initiative (IBSI) for image biomarker standardization in medical imaging.4 Feature extraction was customized by using Lasso regression to remove irrelevant features and select features that are strongly correlated to expansion prediction within the MRI data. Based on this approach, a total of 99 features were extracted, but only 3 shape-based features, 1 first-order statistics feature, and 2 gray-level cooccurrence matrix features were chosen to be used as inputs to the six classifier models.
Results
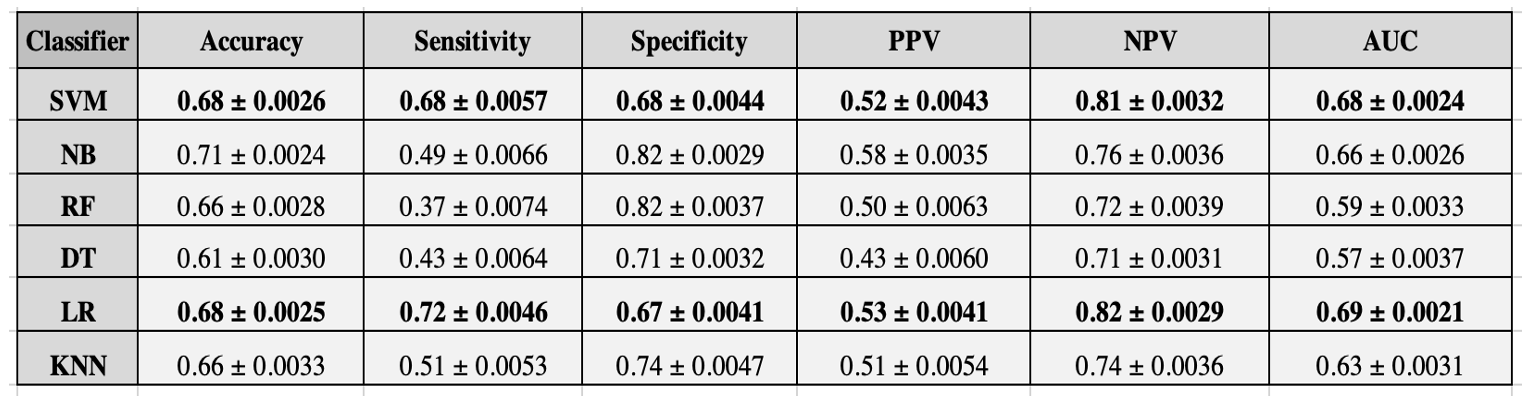
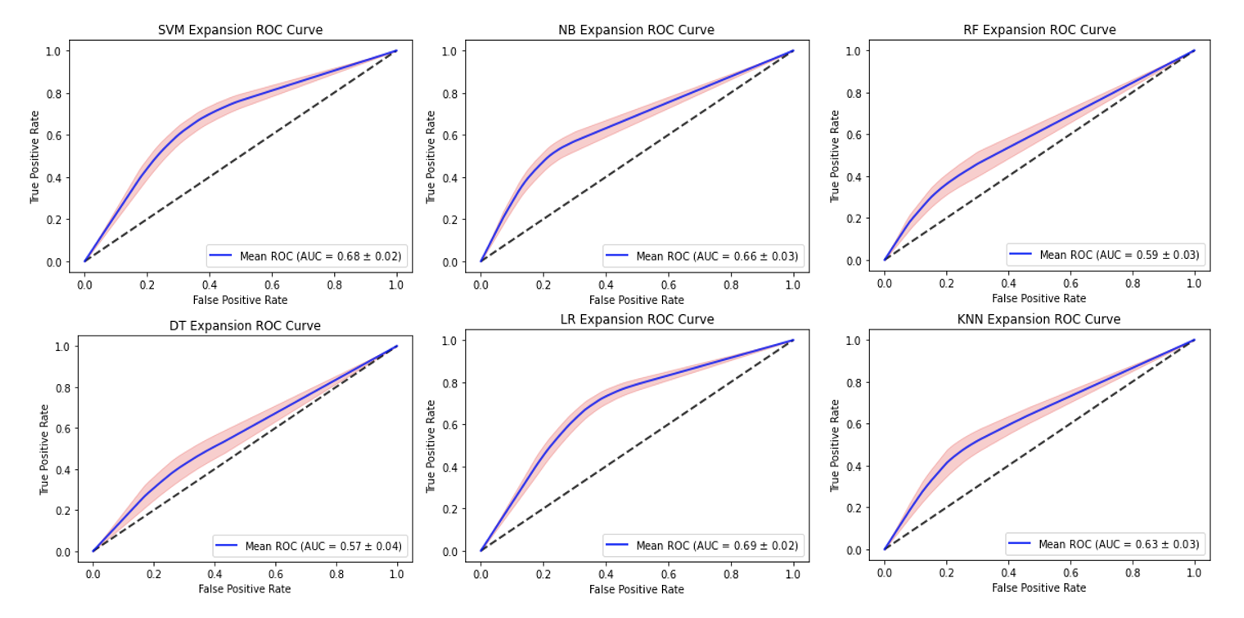
The results of this study are indicated as 95% confidence intervals as seen in Table 1. They indicate the accuracy, sensitivity, specificity, positive predictive value (PPV), negative predictive value (NPV), and area under the receiver operating characteristic (ROC) curve (AUC) for all six of the classifier models. The ROC curves for each classifier are shown in Figure 2.Discussion
It was seen that the highest sensitivities among all six classifiers were the SVM and LR models, 0.68 and 0.72, respectively. While the accuracy performance is the best for the NB, 0.71, this is solely due to the high specificity metric, 0.82. For this specific prediction model, we aimed to have similar sensitivity and specificity metrics as seen with the SVM model as this indicates that the network is not skewed in one direction based on the number of cases it is seeing in the HE and non-HE cohorts. However, a higher sensitivity metric is still preferred over a higher specificity metric as seen in the LR model since it indicates a more cautious approach which is needed to intervene when a patient is likely to undergo HE. We demonstrated on a single center and single manufacturer, that HE prognosis with clinically relevant accuracies may be achieved. For future work, we will focus on the reproducibility of these algorithms across a large multi-site cohort to determine the feasibility of implementing this approach into a clinical setting.5Conclusion
In conclusion, this prediction model using a radiomics based approach shows that machine learning is able to predict HE by extracting radiomic features from MRI scans of ICH patients. The SVM and LR classifier models have the capability to play a major role in determining risk stratification for ICH patients with possible HE.Acknowledgements
No acknowledgement found.References
1. Flaherty ML, Beck J. Surgery for intracerebral hemorrhage: moving forward or making circles? Stroke. 2013 Oct;44(10):2953-4. doi: 10.1161/STROKEAHA.113.002533. Epub 2013 Aug 27. PMID: 23982715.
2. Zheng, Y., Hu, Q., Manaenko, A., Zhang, Y., Peng, Y., Xu, L., Tang, J., Tang, J., & Zhang, J. H. (2015). 17β-Estradiol attenuates hematoma expansion through estrogen receptor α/silent information regulator 1/nuclear factor-kappa b pathway in hyperglycemic intracerebral hemorrhage mice. Stroke, 46(2), 485–491. https://doi.org/10.1161/STROKEAHA.114.006372
3. Griethuysen, J. J. M., Fedorov, A., Parmar, C., Hosny, A., Aucoin, N., Narayan, V., Beets-Tan, R. G. H., Fillon-Robin, J. C., Pieper, S., Aerts, H. J. W. L. (2017). Computational Radiomics System to Decode the Radiographic Phenotype. Cancer Research, 77(21), e104–e107. `https://doi.org/10.1158/0008-5472.CAN-17-0339 <https://doi.org/10.1158/0008-5472.CAN-17-0339>`_
4. Van Timmeren, J., Cester, D., Tanadini-Lang, S. et al. Radiomics in medical imaging—“how-to” guide and critical reflection. Insights Imaging 11, 91 (2020). https://doi.org/10.1186/s13244-020-00887-2
5. Niha Beig, Kaustav Bera, Pallavi Tiwari, Introduction to radiomics and radiogenomics in neuro-oncology: implications and challenges, Neuro-Oncology Advances, Volume 2, Issue Supplement_4, December 2020, Pages iv3–iv14, https://doi.org/10.1093/noajnl/vdaa148
Figures