4890
Predicting penumbral tissue death using intravoxel incoherent motion MRI in a canine large vessel occlusion model1University of Massachusetts Medical School, Worcester, MA, United States
Synopsis
In acute ischemic stroke due to large vessel occlusion (LVO), information about the penumbral tissue can be vital in making decisions on how to treat ischemic stroke patients in the clinic. This study investigated the use of intravoxel incoherent motion (IVIM) MRI in a canine LVO model to quantify the perfusion information in penumbral tissue prior to infarction. The IVIM parameters were assessed to predict the onset of penumbral tissue death. Of the 3 IVIM parameters, f showed the best utility in predicting penumbral tissue death.
Introduction
In acute ischemic stroke, the penumbra is the area surrounding the ischemic region. Depending on the progression of the stroke, information about the penumbra can be vital in making decisions on how to treat ischemic stroke patients in the clinic. Patients that arrive at the hospital outside a 6-hour window often require additional imaging before intervention, and recent works have shown that the existence of robust collaterals can reduce the overall change in infarct size from admission to post-treatment1. Intravoxel incoherent motion (IVIM)2 MRI is a diffusion-weighted (DW) MRI technique that can measure microvascular perfusion likely driven by these collaterals, and may allow for better prediction of which tissue will infarct before successful intervention can be achieved. This can allow for better patient selection and type of intervention to be performed. In this study, we used a canine large vessel occlusion (LVO) model3 to quantify the perfusion information in the penumbral tissue prior to infarction using IVIM parameters in an effort to assess whether the IVIM parameters can predict the onset of penumbral tissue death.Methods
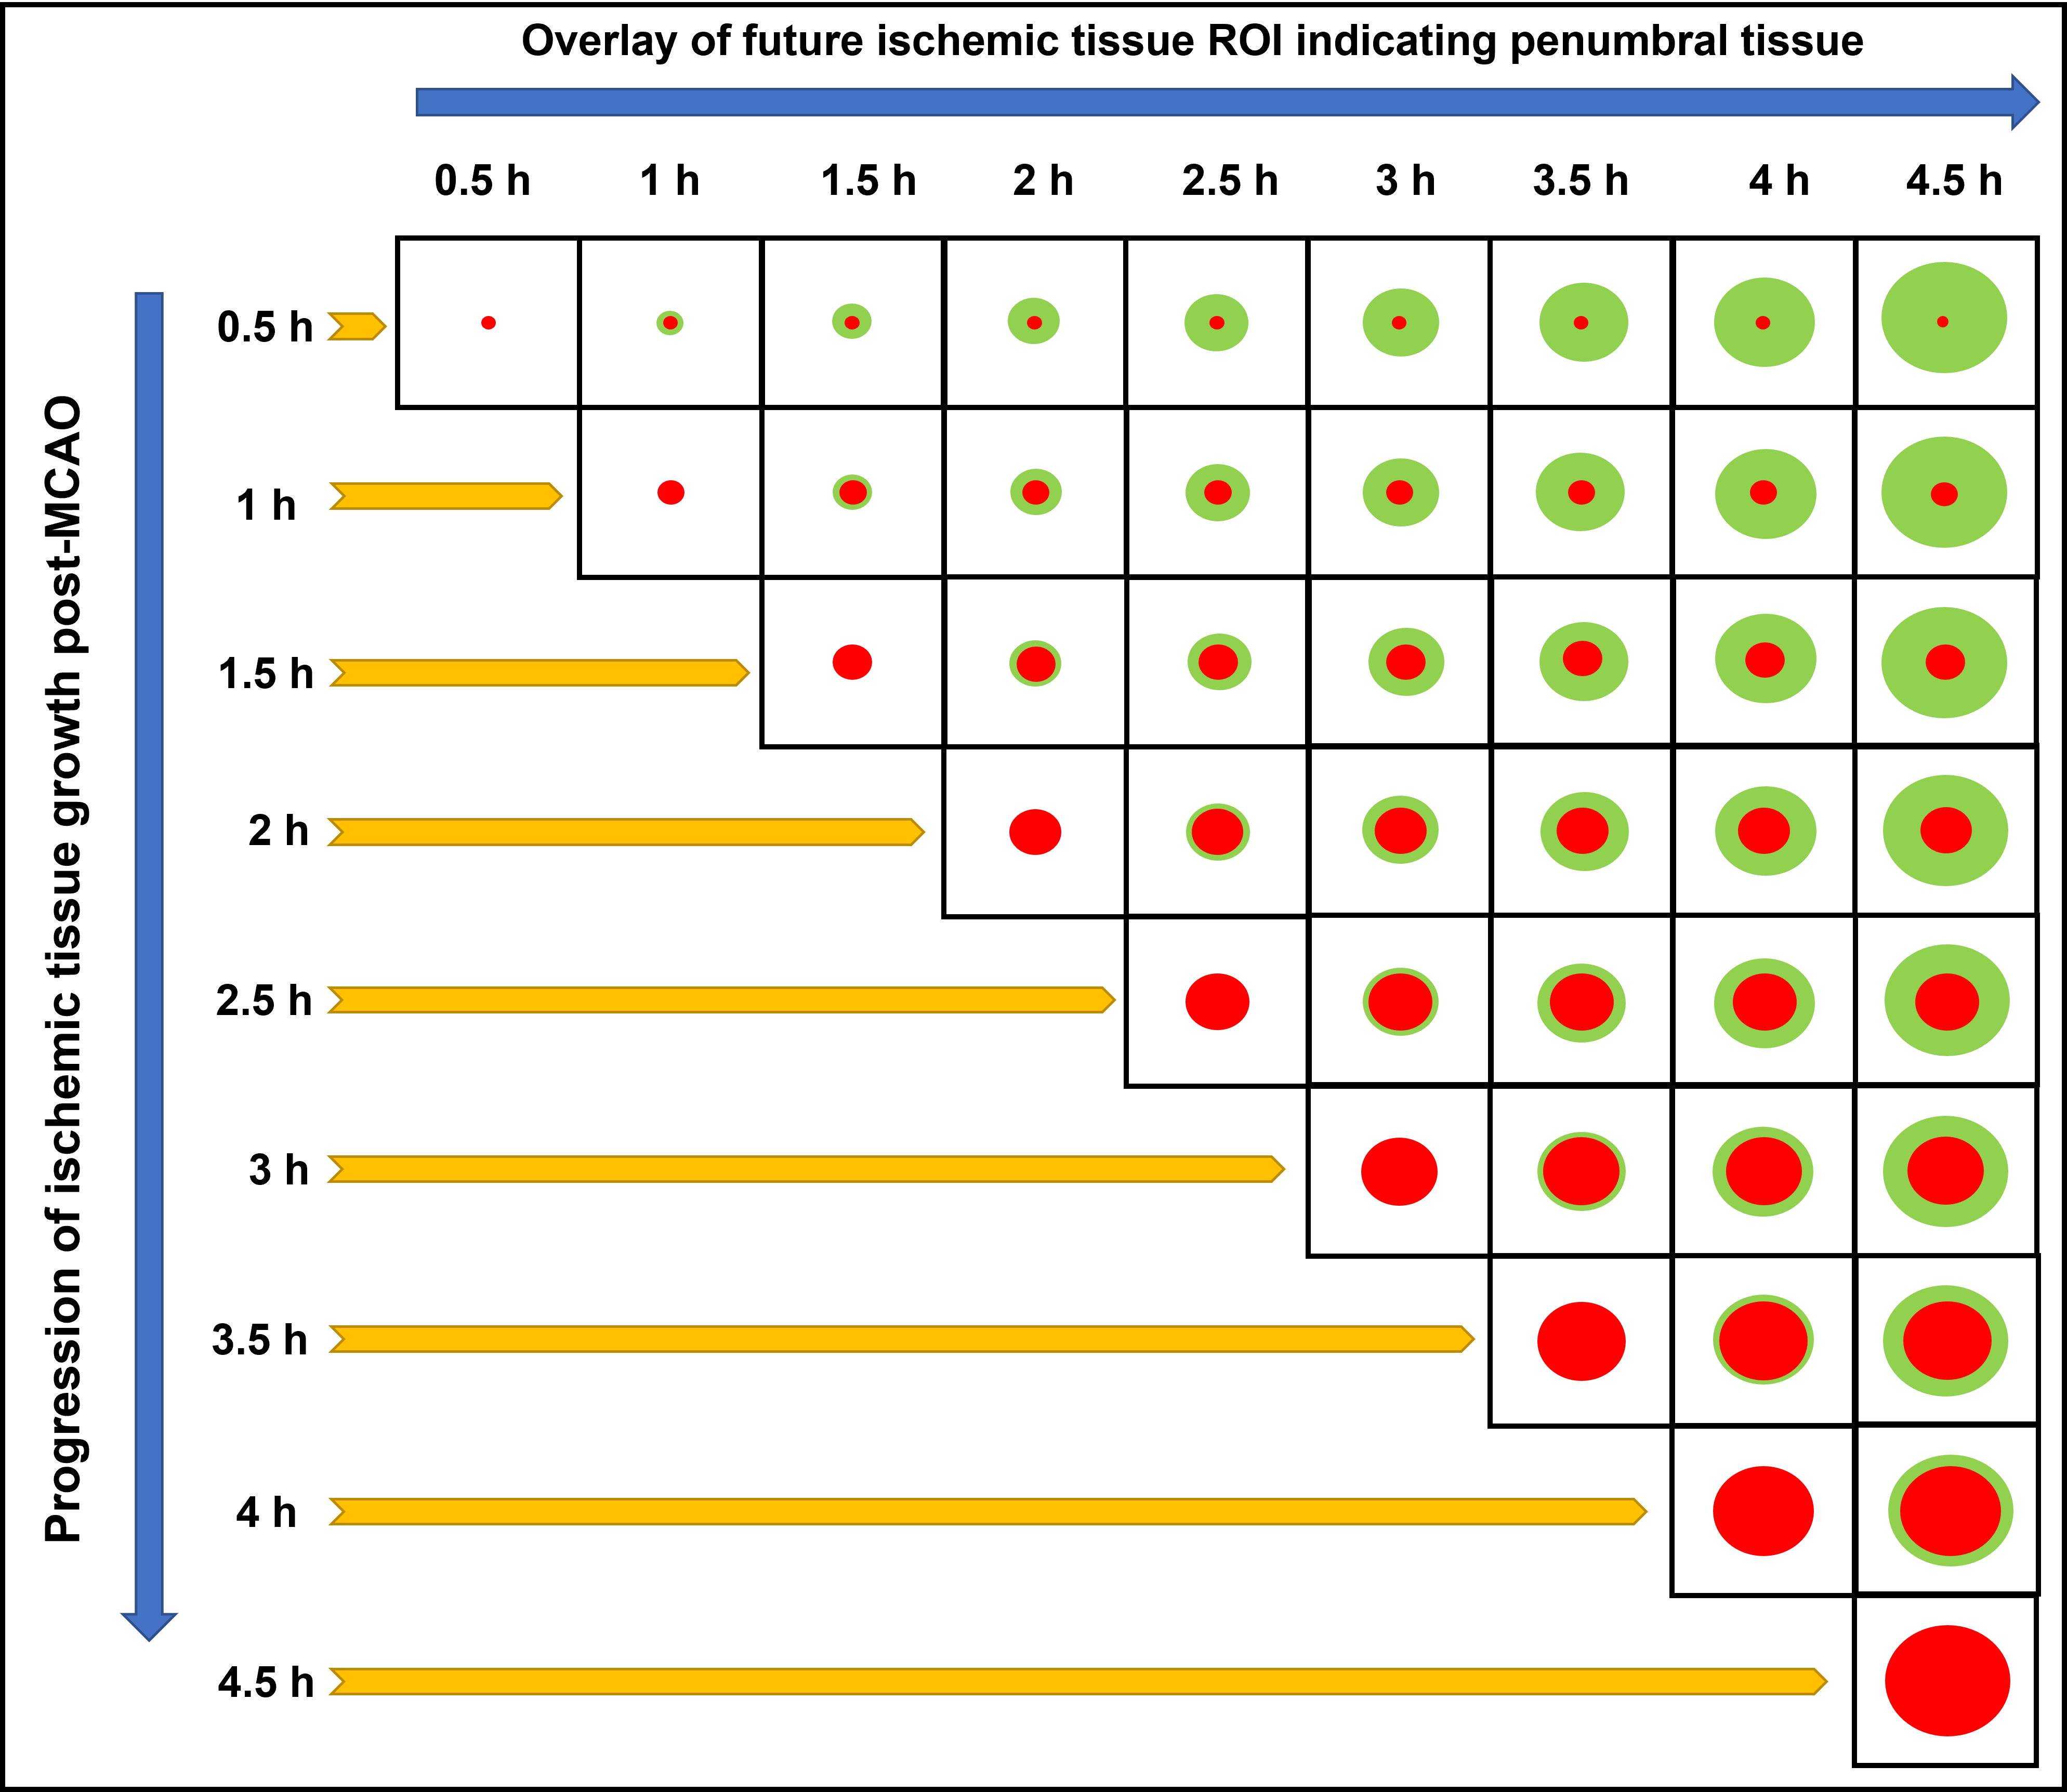
An autologous clot was injected into the middle cerebral artery (MCA) of 9 dogs to cause an occlusion and subsequent infarction as previously described4. After confirming the MCA occlusion (MCAO) using angiography, each dog was imaged using MRI. Imaging protocol included PW-MRI (TR/TE = 1500/20.1ms, FA = 40o, 60 dynamics, matrix = 320×320), which was performed during administration of 0.2 mmol/kg of Magnevist at ~30 min post-MCAO, and DW-MRI (TR/TE 2600/76ms, FA = 90o, 3-gradient direction b-values = 0, 50, 100, 150, 200, 250, 300, 500, 700, and 900 s/mm2, NEX = 6, matrix = 144×144), which was performed immediately after PW-MRI and every 30 min up to 4.5 h post-MCAO. Each dog received an oxygen carrier drug, which involved an intravenous bolus at ~45 min post MCAO followed by slow infusion for ~2 h. Histology was performed post-mortem using triphenyltetrazolium chloride (TTC) to confirm the brain infarct region. IVIM analysis was performed in a two-step fitting approach5 using:S(b)/S0=(1-f)e-bD + fe-b(D*+D)where S(b) is the signal intensity at the respective b value, S0 is the signal at b = 0, f is the perfusion fraction, D is the molecular diffusion coefficient, and D* is the pseudo-diffusion coefficient related to microvascular perfusion. Infarct region of interest (ROI) were based on ADC maps where ADC values less than 0.533 × 10⁻³ mm2/s was considered as infarcted tissue. The ROIs from later timepoints were superimposed on earlier timepoints to delineate the penumbra region in all animals (Fig. 1). The time taken by the ADC values of the penumbra region tissue to reduce to 0.533 × 10⁻³ mm2/s was considered as the time prior to penumbral death. Contralateral ROIs were also selected for normal tissue assessment. Analysis of variance (ANOVA) for mixed models was used to determine if there was a significant change in the IVIM parameters between the penumbra and normal tissue. One-way ANOVA was used to assess changes in the penumbra IVIM parameters across the timepoints.
Results and Discussion
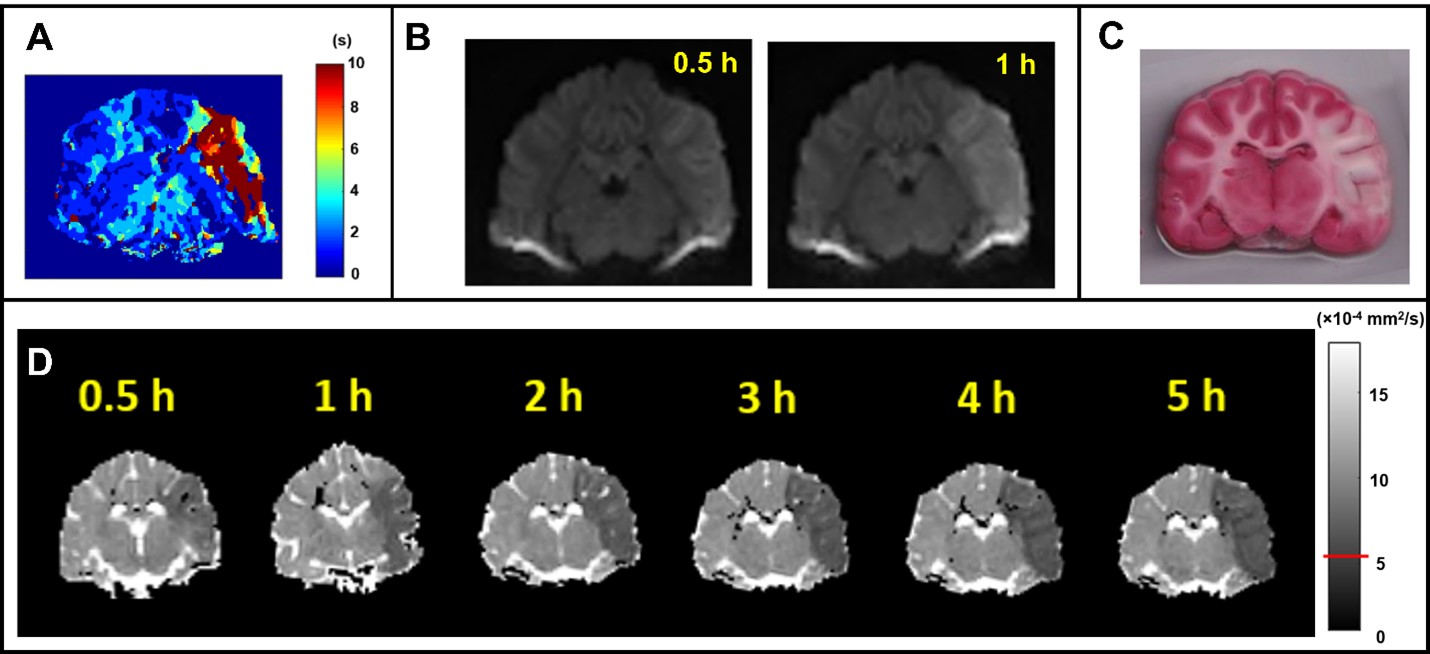
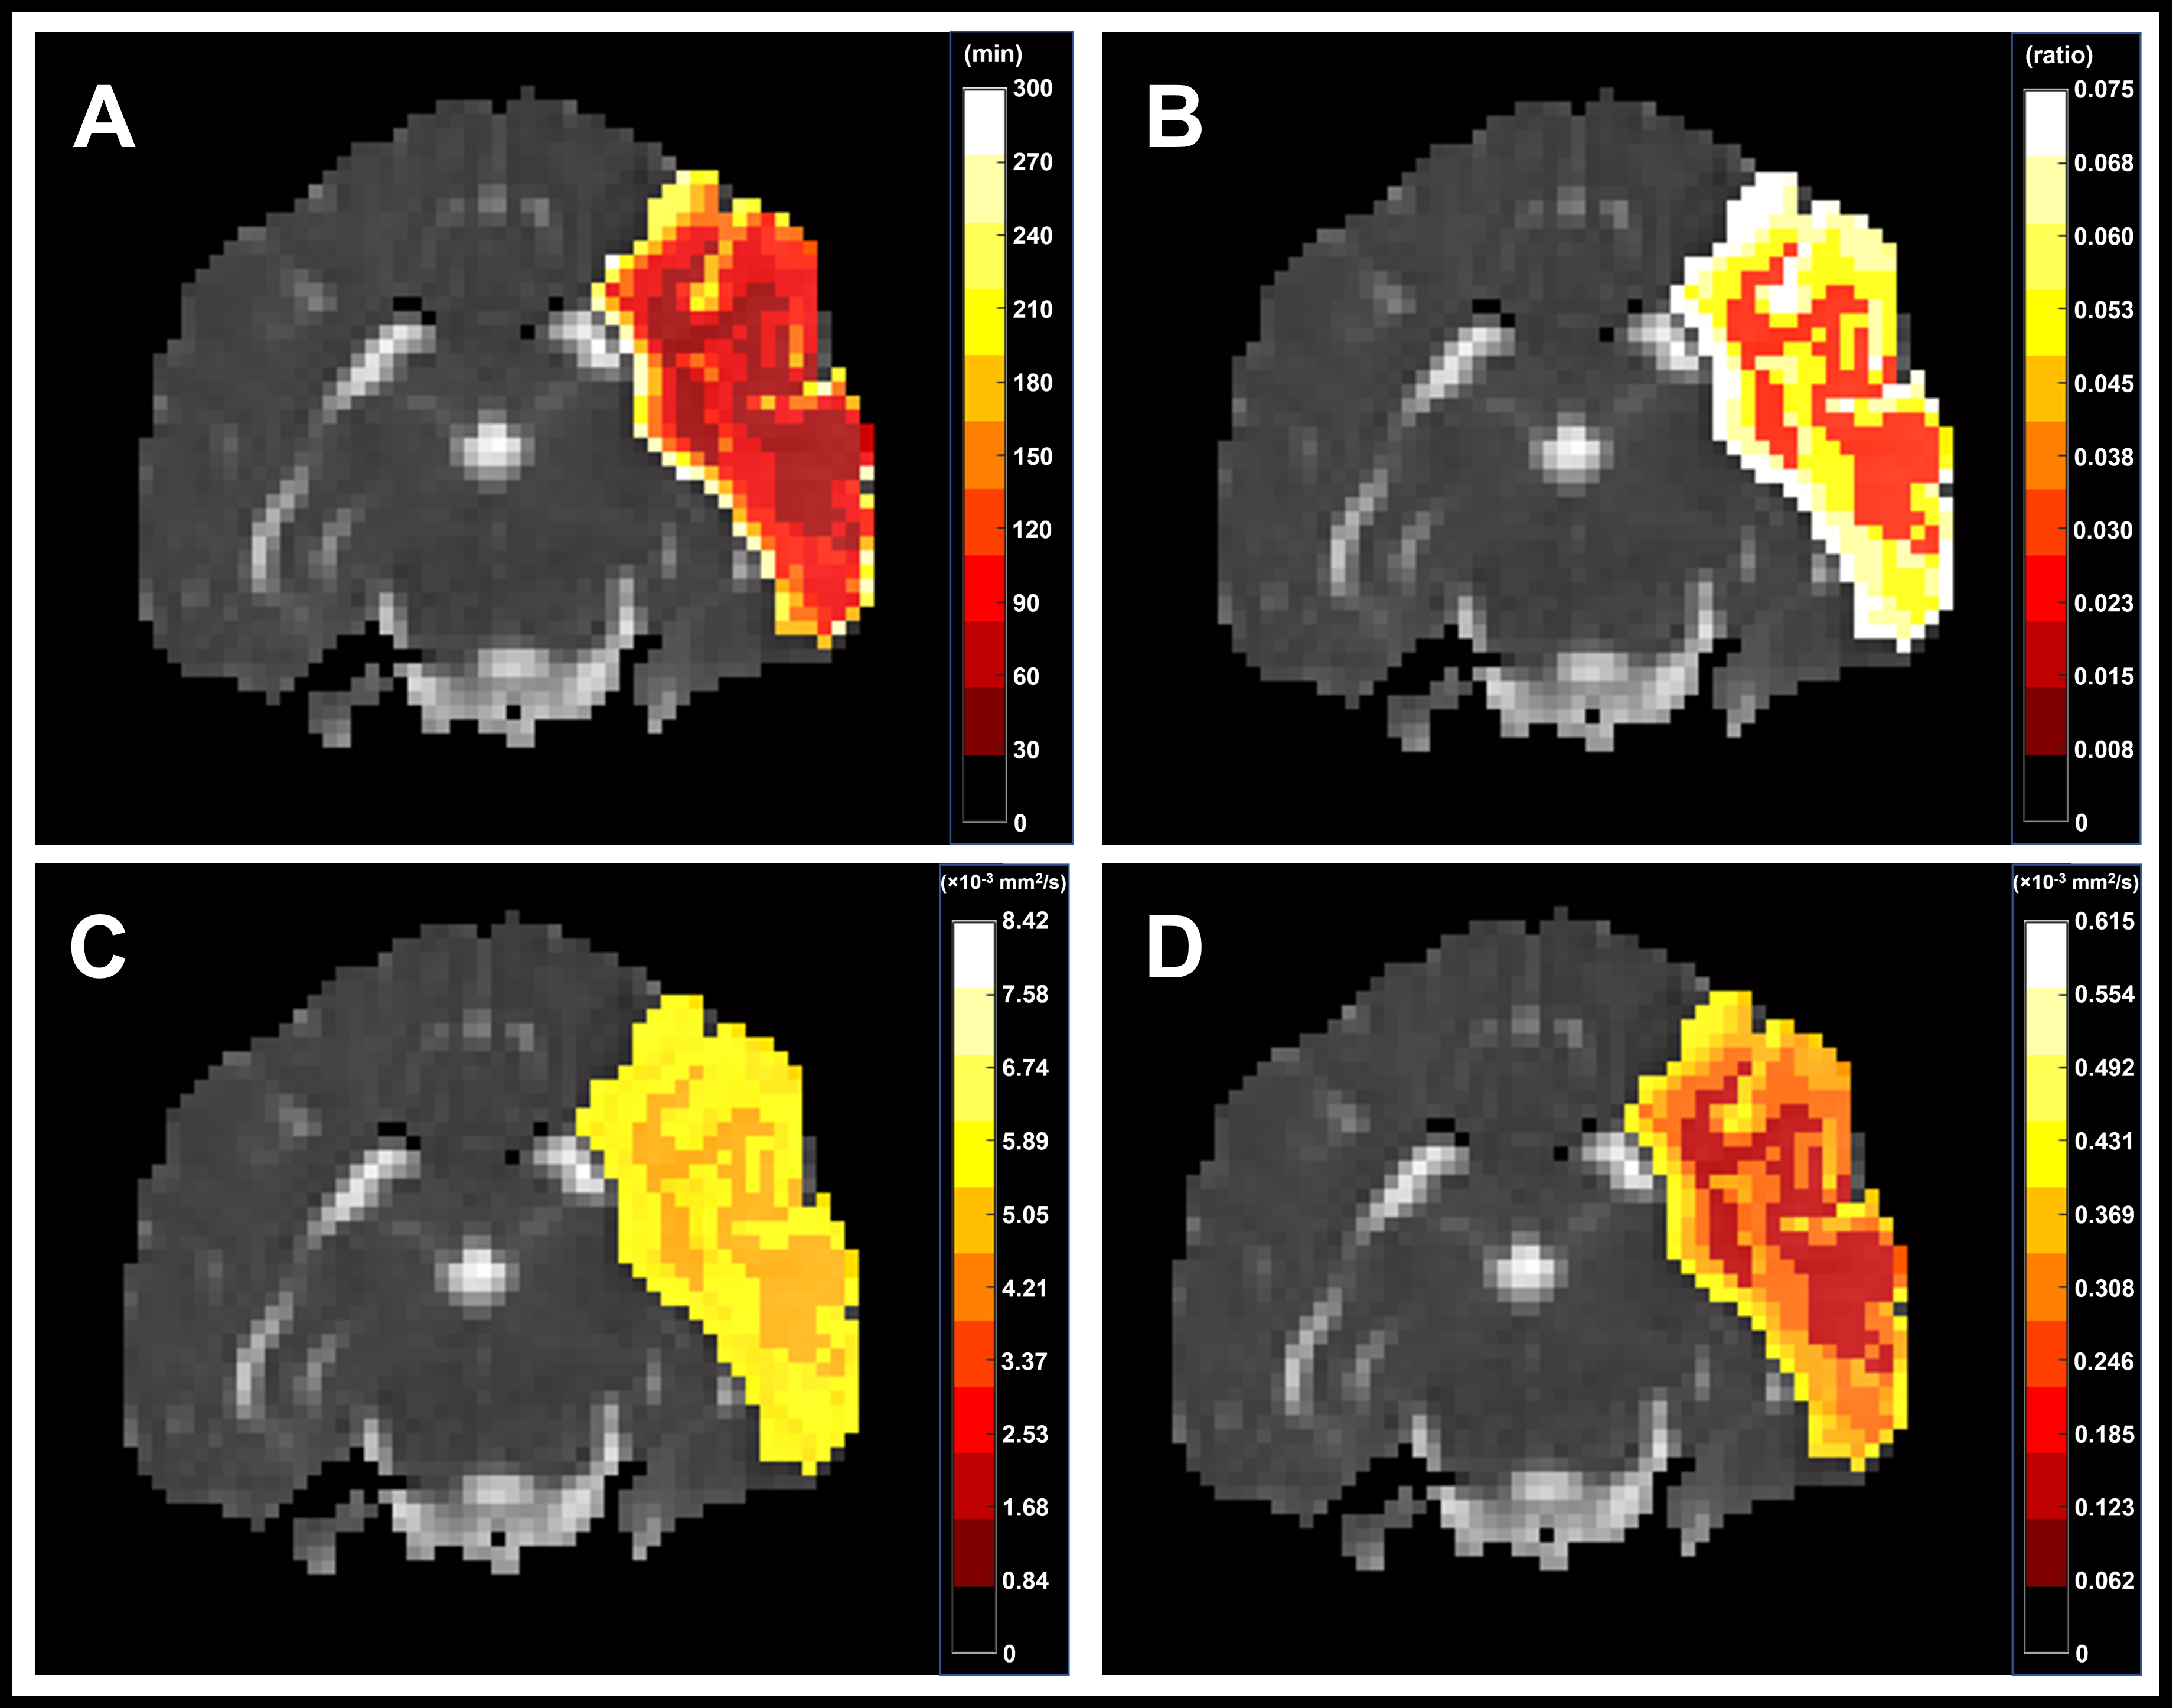
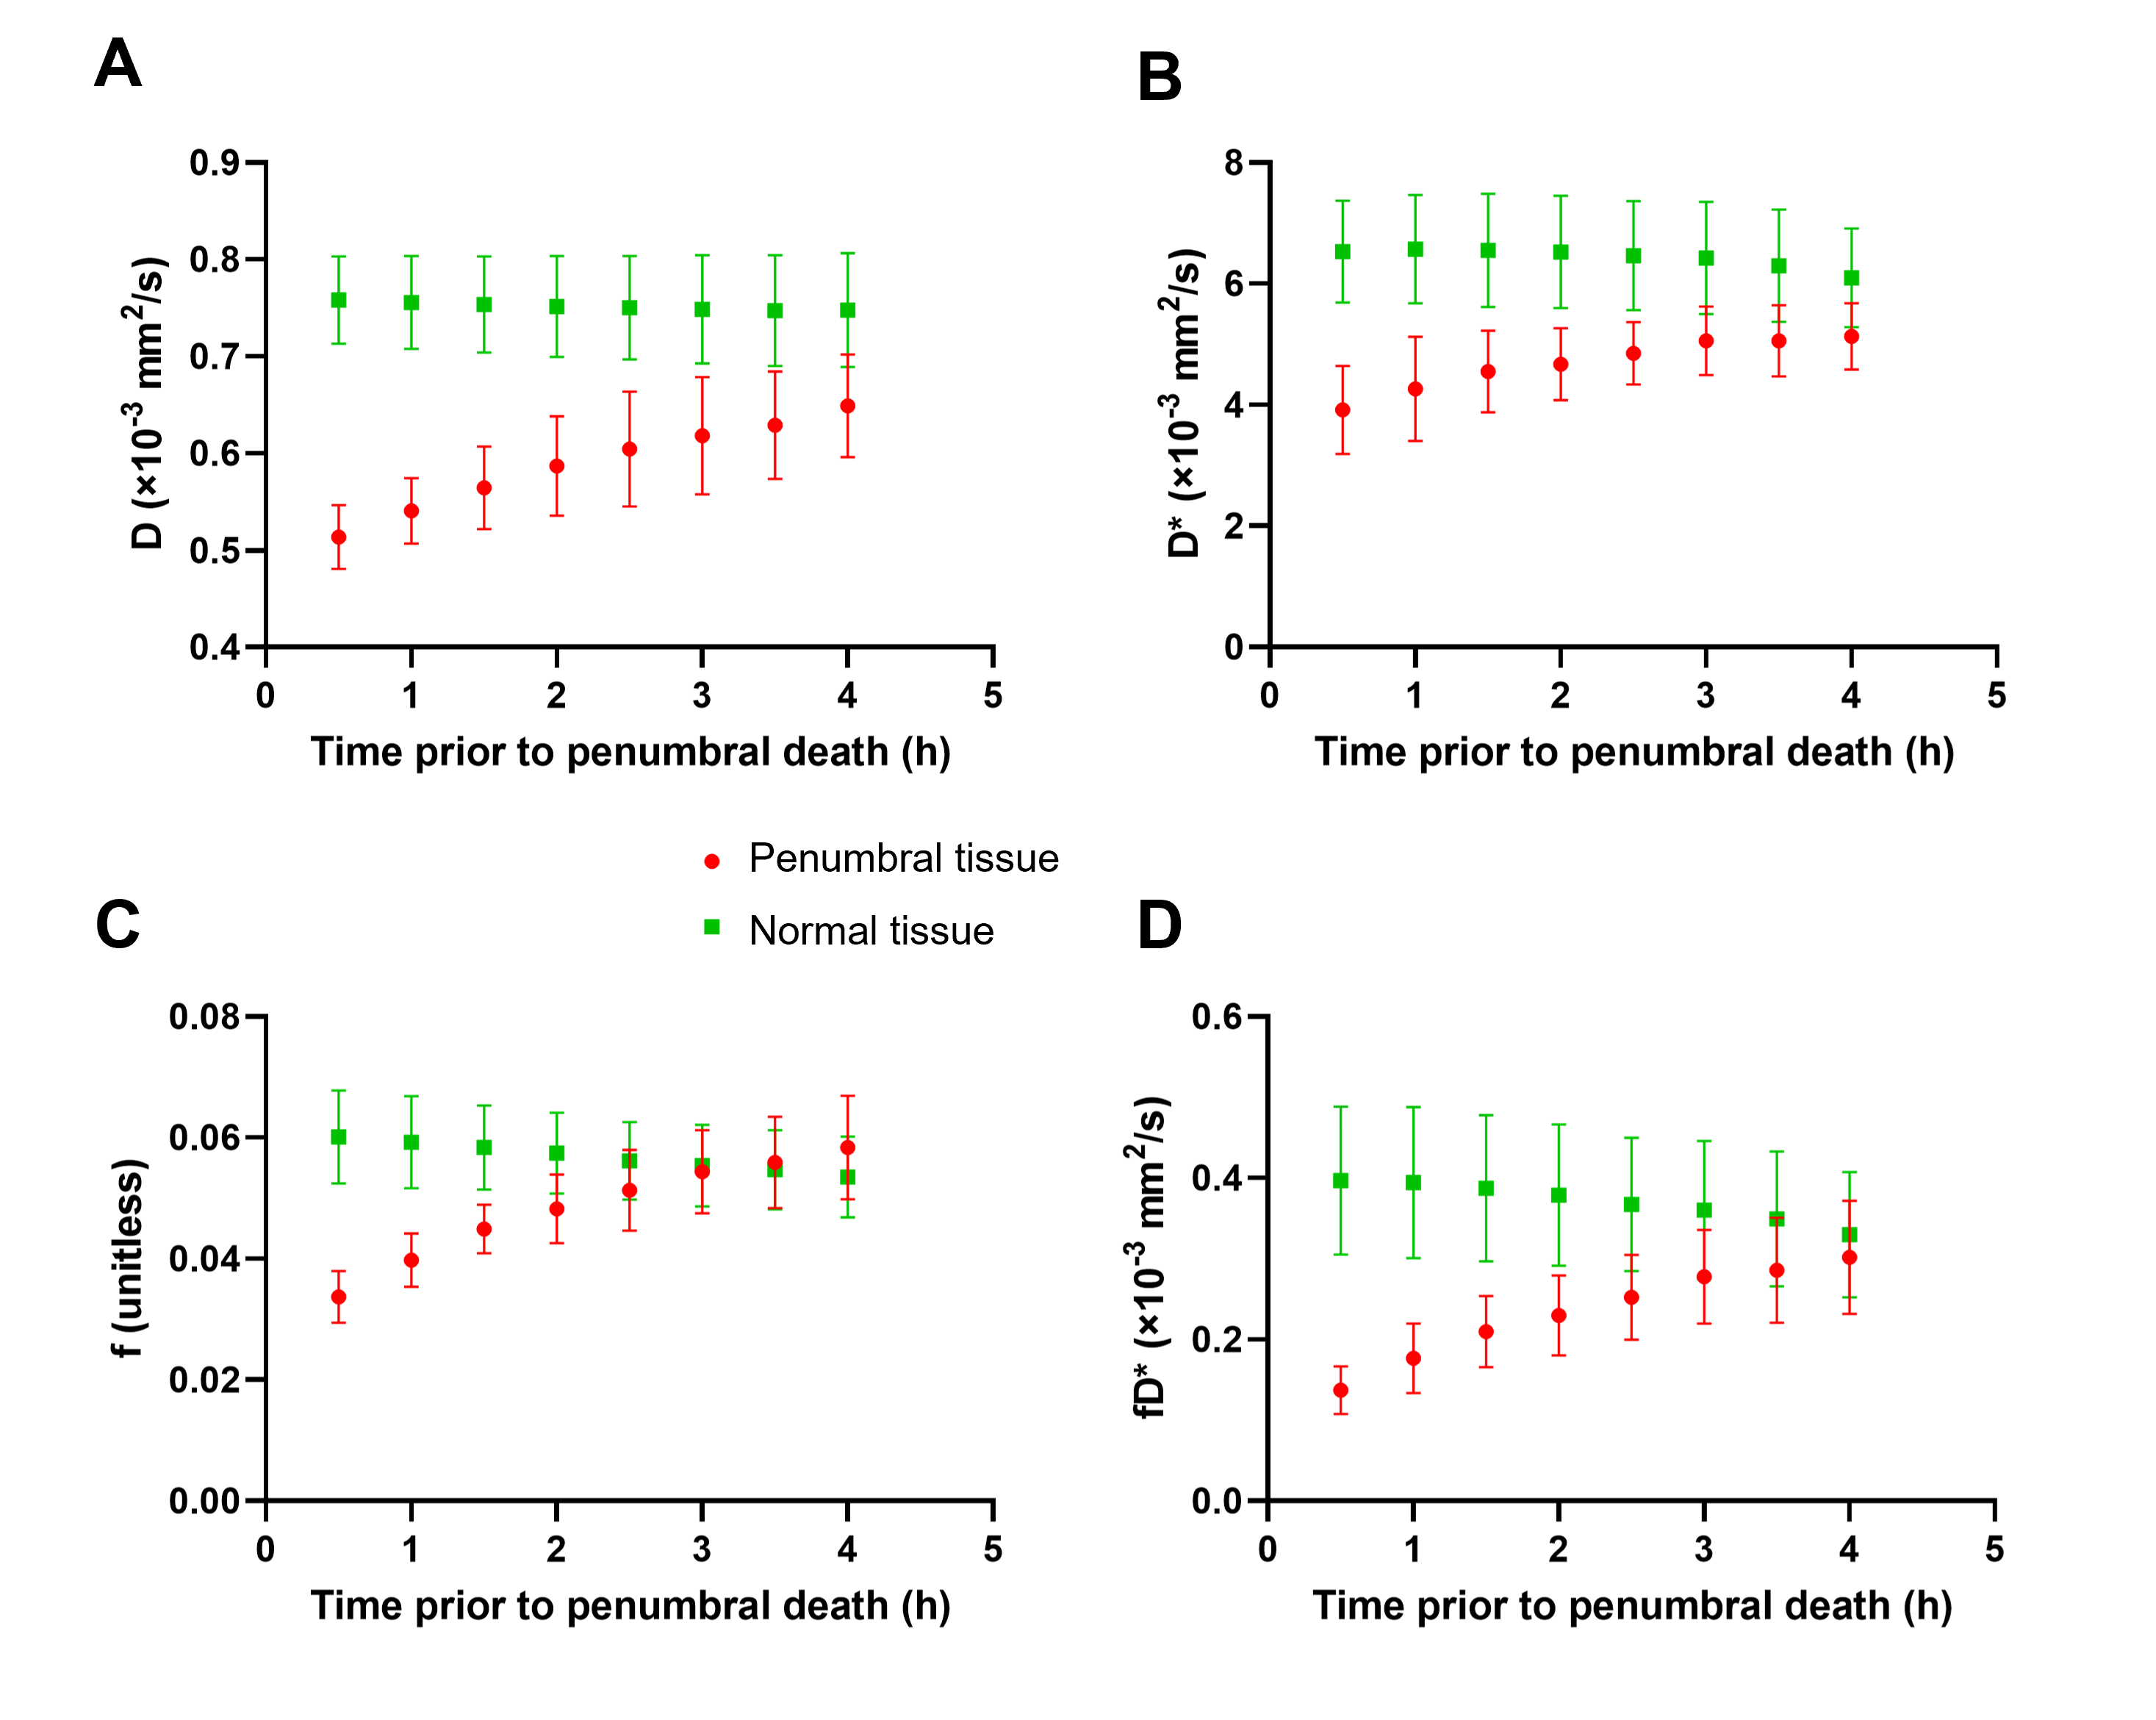
All 9 dogs developed large infarcts in the brain. Figure 2 shows a representative animal with an infarct region as indicated in the PW-MRI, DW-MRI, histology and ADC maps. Figure 3 shows a good utility of the IVIM parameters in predicting the final infarct pattern seen in the ADC map (Fig. 3A), which shows the time needed for the ADC intensity threshold to reach 0.533 × 10⁻³ mm2/s. Figures 3BCD show the f, D*, and fD* values, respectively, in the penumbral region at the first 0.5 h timepoint, where f and fD* show a good prediction of the infarct progression (Fig. 3A). Figure 4 shows the quantification of all the IVIM parameters in the penumbra and normal tissue region grouped by time prior to penumbral death. The normal tissue shows a horizontal line indicating minimal changes whereas the penumbra tissue shows a decrease in all IVIM parameters as the penumbra tissue gets closer to penumbral death. Interestingly, f shows a bimodal pattern in its decline where the slope between 4 h and 2 h is relatively horizontal indicating continued perfusion of tissue, while between 2 h and 0.5 h, the slope is greater indicating a rapid decline in the local perfusion leading to penumbral death. More notedly, f shows a steeper decline in the 2 h to 0.5 h window compared to the other parameters.Conclusion
Recently, IVIM technique in stroke patients has been promising in the assessment of cerebral perfusion5-6. Our study further emphasizes the utility of IVIM parameters in predicting the timeline of decline in the penumbral tissue. These results support the theory that f is a good surrogate for cerebral blood volume measured using dynamic susceptibility imaging5. This information can be vital in patient selection and type of intervention to be performed.Acknowledgements
This work was funded by NINDS 5R44NS076272-03. The content is solely the responsibility of the authors and does not represent the official views of the NIH.References
1. Leibeskind DS, Saber H, Xiang Bm et al. Collateral Circulation in Thrombectomy for Stroke After 6 to 24 Hours in the DAWN Trial. Stroke. 2021; doi: 10.1161/STROKEAHA.121.034471.
2. Le Bihan D, Breton E, Lallemand D et al. MR imaging of intravoxel incoherent motions: applications to diffusion and perfusion in neurologic disorders. Radiology. 1986;161:401-407.
3. Kang BT, Lee JH, Jung DI et al. Canine model of ischemic stroke with permanent middle cerebral artery occlusion: clinical and histopathological findings. J Vet Sci. 2007;8:369-376.
4. Shazeeb MS, King RM, Brooks OW et al. Infarct Evolution in a Large Animal Model of Middle Cerebral Artery Occlusion. Transl Stroke Res. 2019;doi: 10.1007/s12975-019-00732-9.
5. Zhu G, Federau C, Wintermark M et al. Comparison of MRI IVIM and MR perfusion imaging in acute ischemic stroke due to large vessel occlusion. Int J Stroke. 2019; doi: 10.1177/1747493019873515.
6. Federau C, Wintermark M, Christensen S et al. Collateral blood flow measurement with intravoxel incoherent motion perfusion imaging in hyperacute brain stroke. Neurology. 2019; 92(21):e2462-e2471.
Figures