4888
Contrast-free MR Angiography and Venography for Visualization of Iliac Vein Compression Syndrome in less than 10 minutes1Radiology, UC San Diego, San Diego, CA, United States, 2Bioengineering, UC San Diego, San Diego, CA, United States, 3Canon Medical Systems Corp., Tochigi, Japan, 4Surgery, UC San Diego, San Diego, CA, United States
Synopsis
Iliac vein compression syndrome, known as May-Thurner syndrome (MTS), is a condition when the right common iliac artery constrains the flow in the left common iliac vein. Currently, ultrasound and CT venography (CTV) are the imaging modalities of choice for the diagnosis. We propose a framework to visualize iliac vein and artery utilizing contrast free MR venography and MR angiography in less than 10 minutes.
Introduction
May-Thurner Syndrome (MTS) is described as a condition when the left common iliac vein is compressed against the lumbar vertebrae by the overlying right common iliac artery, which can result in substantial complications such as deep venous thromboses (1). A prompt diagnosis is of paramount importance as thromboses may cause severe systemic complications (pulmonary embolism). MTS is rarely diagnosed, yet studies have demonstrated its presence in over 20% of the population (2). Typically, the evaluation of patients with MTS comprises of venous duplex ultrasound scan and CT venography (CTV) with radiation exposure and iodine contrast administration. However, both methods have their limitations. Ultrasound studies despite being noninvasive are constrained by the deep location of the veins in the pelvis which are difficult to visualize (3). The results of CTV are highly dependent on cardiac output, size of the intravenous line, concentration of contrast media at the abdominal region, rate of injection, as well as degree of fibrosis that may obscure the underlying structure. Moreover, CTV is subjective to safety concerns due to long radiation exposure and a high dose of contrast medium necessary for the abdominal exam. Recently, several studies have recommended using MRV for the accurate diagnostics of MTS (4, 5). Here we present contrast-free MR venography (MRV) and angiography (MRA) techniques with a total scan time of under 10 minutes allowing for accurate 3D visualization of the iliac arteries and veins.Methods
Four male volunteers (40 ± 19 years) were scanned on a clinical 3T scanner (Vantage Galan 3T, Canon Medical Systems, Japan) after obtaining IRB-approved written informed consent. Images were acquired using body and spine SPEEDER coils. The scanning protocol was comprised of two imaging series (i) non-contrast MRA was obtained with Fresh Blood Imaging technique (6, 7) (TE / TR = 30 / 2RR intervals, NEX = 1, FA = 90°, FOV = 42×33 cm, matrix size 652×512, 100 slices, 2.6 mm thick, parallel imaging SPEEDER factor = 4) with cardiac gating, (ii) for the iliac vein we utilized 2D time-of-flight MRV (TE /TR = 6.8 / 22 ms, NEX = 1, FA = 60°, FOV = 40×30 cm, matrix size 512×384, 100 4-mm thick slices with a 1.5-mm gap, parallel imaging SPEEDER factor = 3) images were collected in the axial orientation with respiratory bellows. Upon completion of the scan, images were geometrically matched using direction cosine matrices and coordinates of the vertices read from the DICOM header, then resampled to the highest native resolution. A Hessian-based filter (8) was applied to boost the contrast for the vessel-like structures in both (i and ii) image sets allowing for fully automatic segmentation of the iliac artery and vein. Derived 3d structures of common iliac arteries and iliac veins were visualized in Matlab R2021b.Results
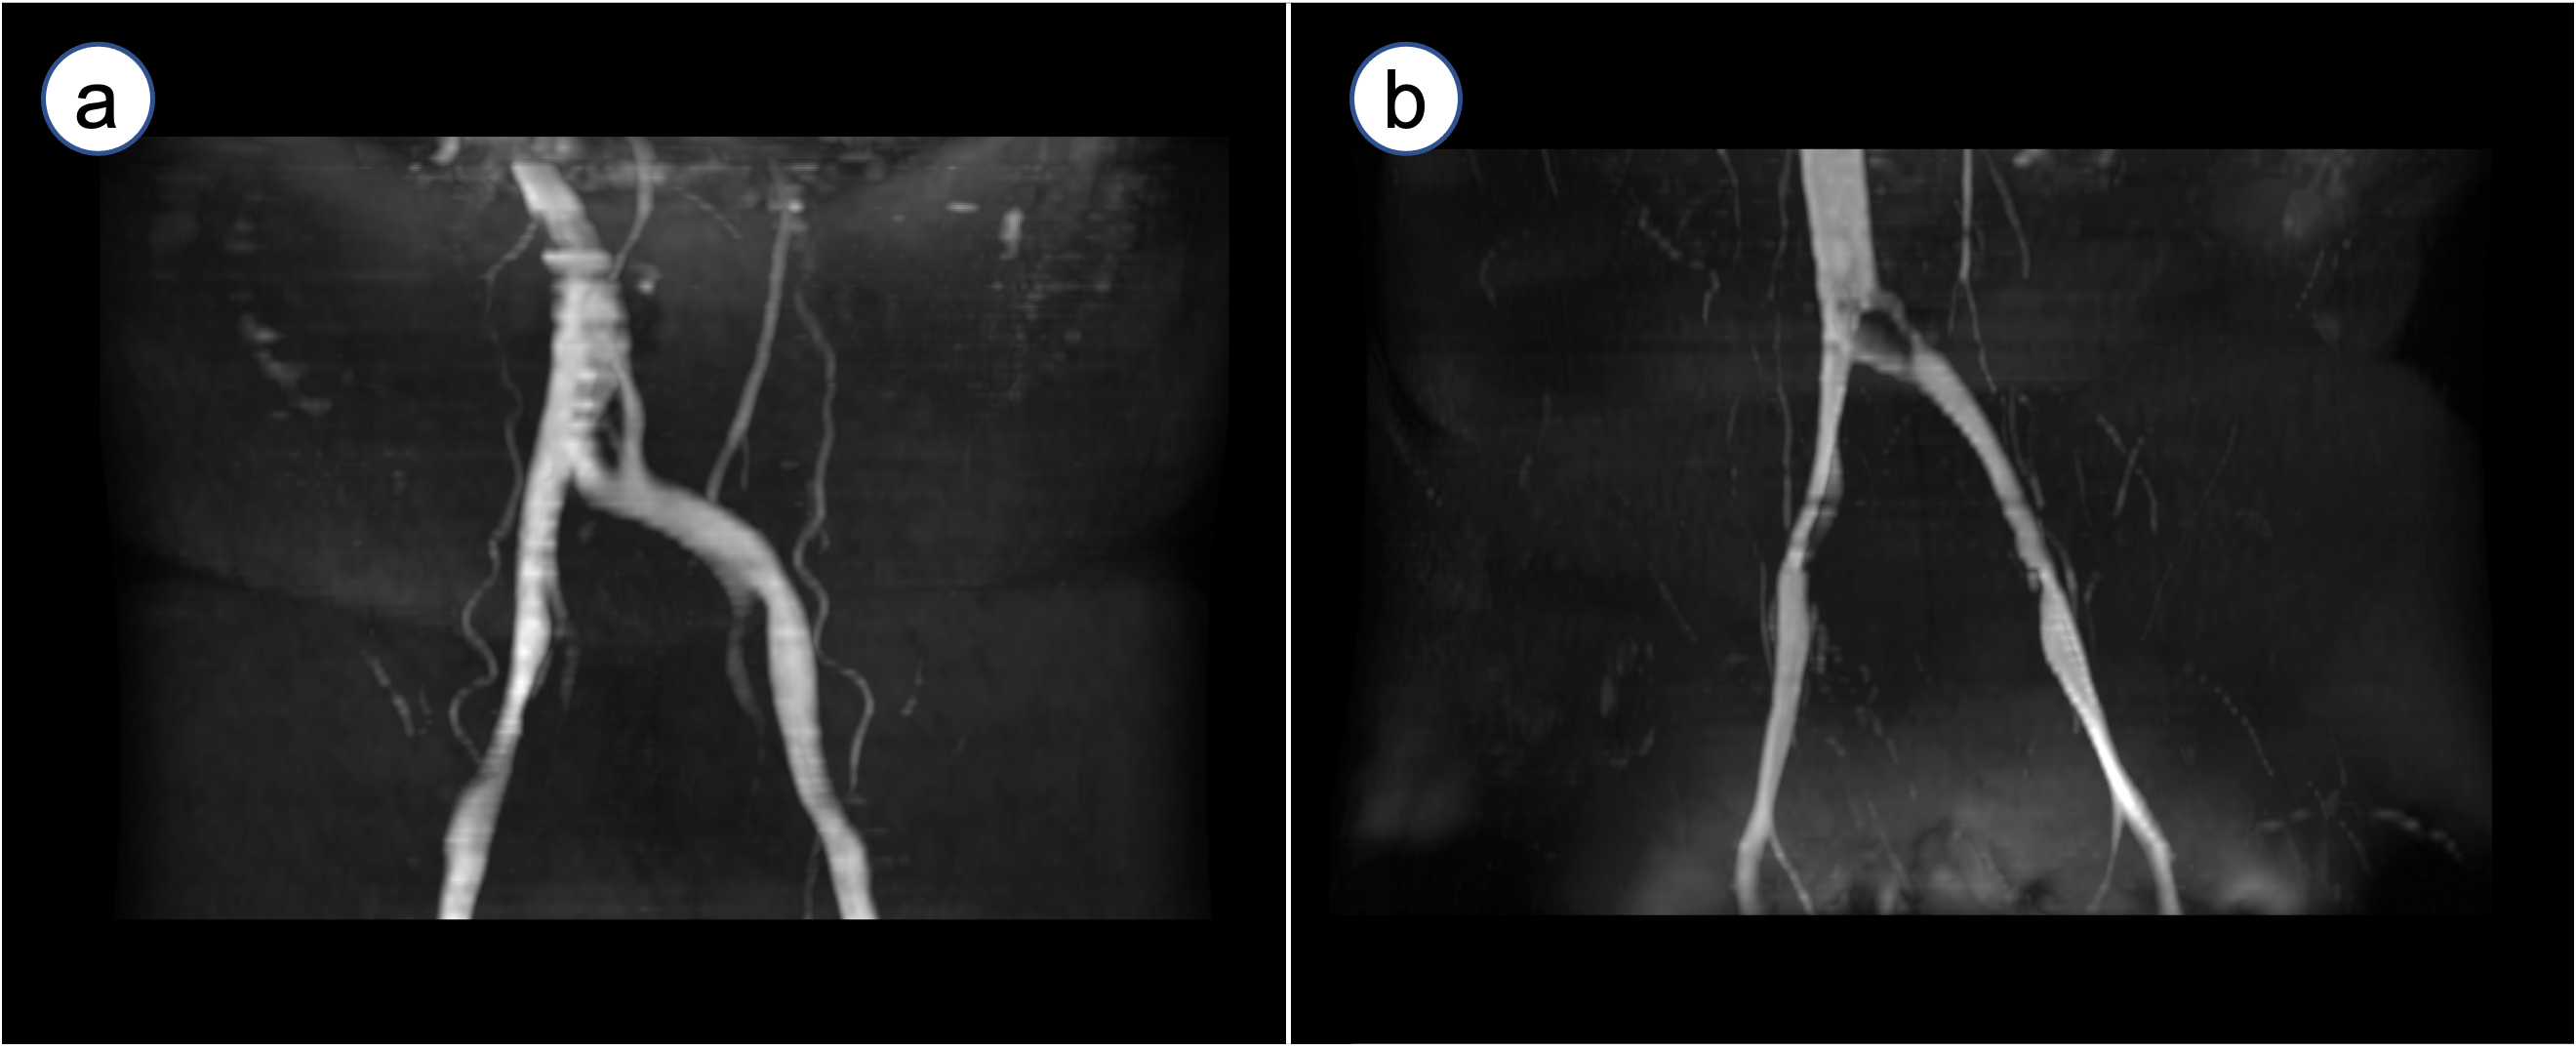
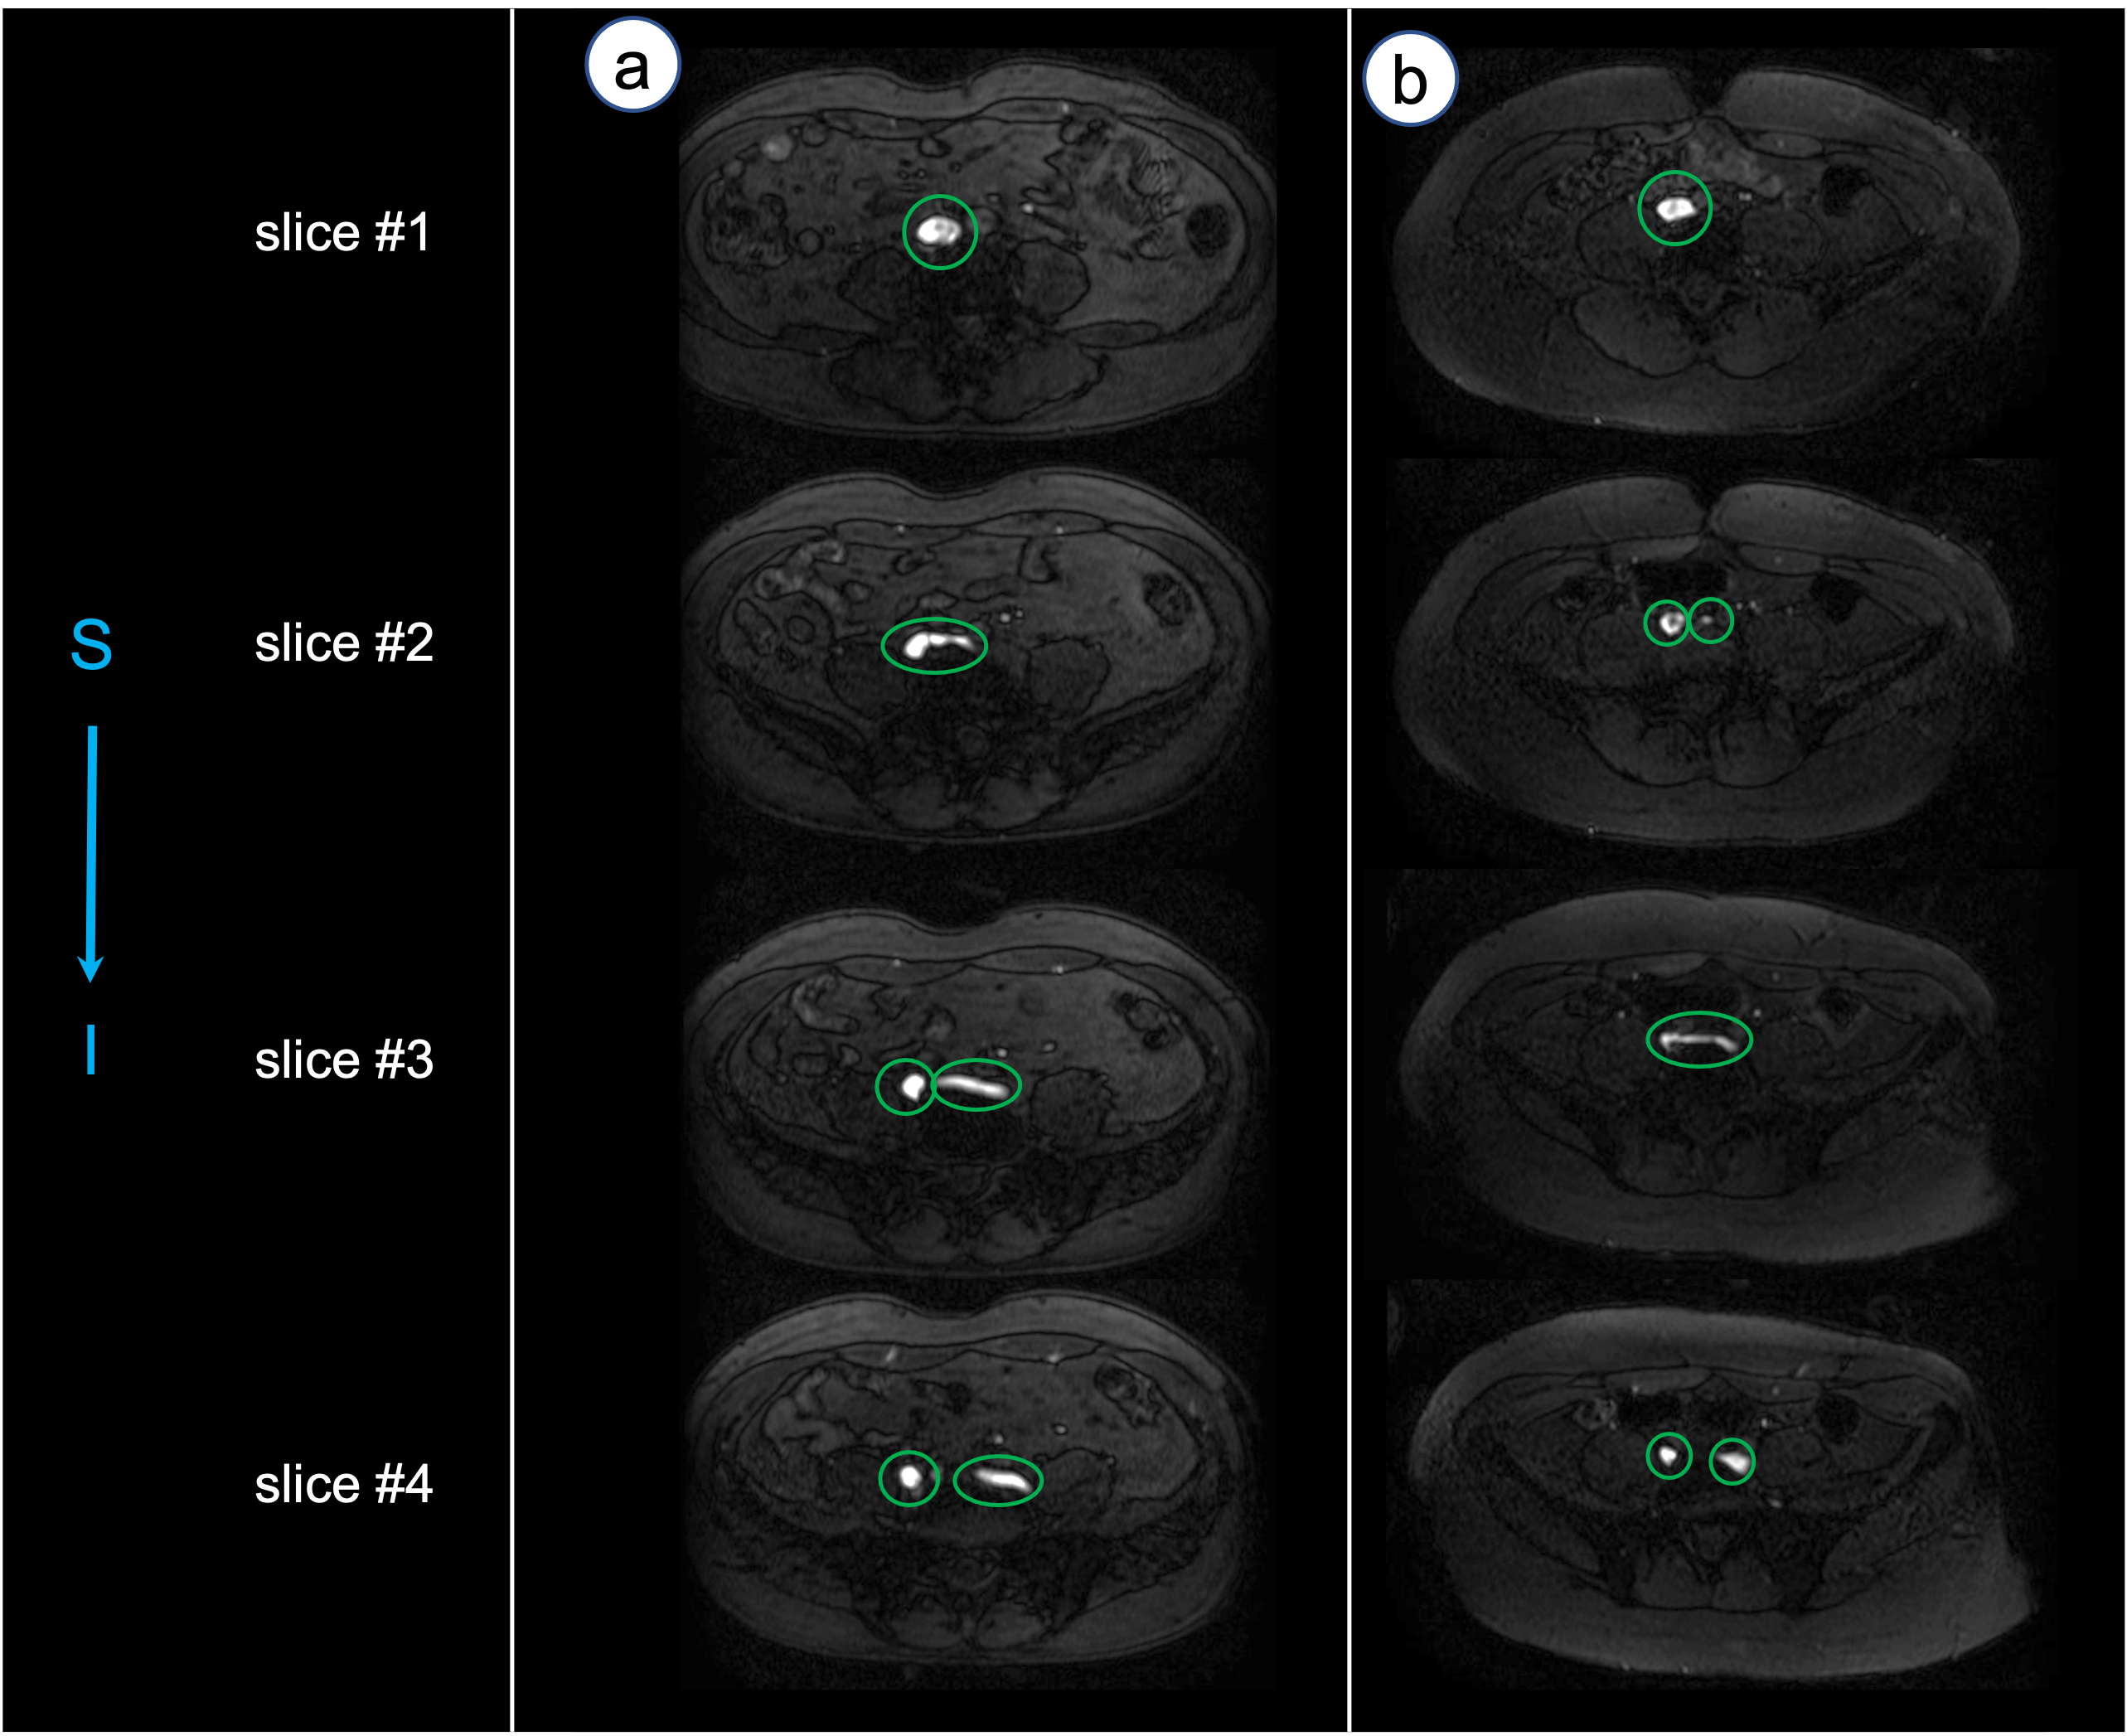
Figure 1 shows the coronal reformatted view of the maximum intensity projection reconstruction for the 2D TOF image series. The left common iliac vein of the first subject in a) appears undeformed, while the subject in b) has a dark region at the left common iliac vein near the bifurcation point. In Figure 2, 4 consecutive axial slices (TOF images) for the same subjects as in Figure 1, show a potentially blocked or hypointense portion of the vein on one of the volunteers. Combined visualization of common iliac veins and arteries for the subjects from Figures 1 and 2 is presented in Figure 3. This visualization provides an unambiguous view of the anatomy depicting arteries and veins.Discussion
A combination of non-contrast MRV and MRA demonstrated in this study offers a viable alternative to a “golden standard” ultrasound and CTV techniques which are currently the most popular choice in diagnostics of the May-Thurner syndrome. Compared to CTV, our proposed MR techniques are noninvasive, non-radiation, and non-contrast, while in contrast to the ultrasound, it provides a higher level of details and is more robust in capturing the condition of deep veins. The MR technique still has some challenges such as turbulent flow in the vein (9) that in some cases may result in the corrupt MRV image. Also, scan time of the MRA can be further reduced by introducing faster sampling schemes such as centric ky - kz FBI or bSSFP.Conclusions
In this study, contrast-free MRA and MRV technique for visualization of the common iliac vein compression was demonstrated. Further studies will be performed to optimize imaging sequences for further reduction of scan time and assess the degree of stenosis and the hemodynamic effects of iliac vein compression compared with the results of ultrasound and CTV.Acknowledgements
Authors acknowledge the grant support from Canon Medical Systems Corp., Japan.References
1. R. May, J. Thurner, Angiology. 8, 419–427 (1957).
2. M. Peters et al., Bayl Univ Medical Cent Proc. 25, 231–233 (2017).
3. L. Oğuzkurt et al., Diagnostic Interventional Radiology Ankara Turk. 13, 152–5 (2007).
4. E. J. Zucker et al., Cardiovasc Diagnosis Ther. 6, 519–532 (2016).
5. L. M. Wolpert et al., Vasc Endovasc Surg. 36, 51–57 (2002).
6. M. Miyazaki et al., J Magn Reson Imaging. 12, 776–783 (2000).
7. M. Miyazaki et al., Radiology. 227, 890–896 (2003).
8. T. Jerman et al., Ieee T Med Imaging. 35, 2107–2118 (2016).
9. C. Simon et al., J Vasc Surg. 30, 950–953 (1999).
Figures