4883
Multi-delay pCASL with optimal post-labeling delay times by incorporating ATT probability distribution improves accuracy of CBF measurement1USC Stevens Neuroimaging and Informatics Institute, Keck School of Medicine, University of Southern California, Los Angeles, CA, United States, 2Division of Biokinesiology and Physical Therapy, Ostrow School of Dentistry, University of Southern California, Los Angeles, CA, United States
Synopsis
The accuracy of CBF measurement in multi-delay ASL relies on the design of optimal PLDs. In this study, we optimized PLDs in 3D pCASL using a previously proposed optimization framework based on the Cramer-Rao lower bound optimization by incorporating different ATT prior distributions including in-vivo Gaussian distribution and uniform distribution. Evenly spaced PLDs were also applied for comparison. Both simulation and in vivo data suggest that optimal PLDs using in vivo ATT Gaussian distribution offer the best performance in terms of the accuracy of CBF estimation.
INTRODUCTION
Arterial spin labeling (ASL) with a single post-labeling delay (PLD) has been recommended for CBF measurement in the ASL consensus paper1 due to its simplicity of protocol setting and superior SNR. However, the interpretation of CBF abnormality is sometimes problematic especially in the cases with prolonged arterial transit time (ATT). Multi-delay ASL allows for tracing labeled blood through the cerebral vasculature into the tissue, which can generate CBF and ATT maps simultaneously according to the general kinetic model. The accuracy of CBF and ATT measurements depends on the design of PLDs. To date, PLDs are generally designed empirically. In this study, we aim to optimize PLDs in multi-delay ASL by considering a prior ATT distribution to improve the accuracy of CBF measurement. Both simulation and in-vivo experiments were performed to evaluate the performance of optimal PLD protocols with different ATT distributions on CBF accuracy.METHODS
Design of optimal multi-PLD protocols:In-vivo ATT probability distribution was generated from the multi-delay pCASL data of 18 healthy volunteers with PLDs of 300/800/1300/1800/1800/2300/2300ms. The histogram of ATT values across subjects followed a Gaussian distribution (Figure 1), which was used as ATT Gaussian distribution for PLD optimization.
An optimization framework based on the Cramer-Rao lower bound (CRLB) optimization2,3 was applied to generate optimal PLDs for a 6 min acquisition with 42 control/label pairs. Two ATT distribution functions were applied in the optimization framework, including the in-vivo Gaussian probability distribution and a uniform probability distribution in an ATT range of 100ms ≤ATT≤ 2200ms10. An evenly-spaced PLD design as a third ATT model was included for comparison. The optimization framework takes the weight of ATT prior distribution function (ATT model), the number of PLDs (NPLDs), and the number of averages (Nave) as inputs to compute optimal PLDs that satisfy the lowest theoretical Cramér‐Rao lower bound. To evaluate the performance of different optimal PLD sets, Monta Carlo (MC) simulation was performed. The parameters used for ASL modeling are listed in Table 1 of Figure 1. The general kinetic model4 was used for CBF and ATT estimations. The root mean square error (RMSE) of the estimations was calculated for comparison.
In-vivo MRI experiments:
All MRI experiments were performed on a Siemens Prisma 3T scanner using a 32-channel head coil. Four healthy participants were imaged using multi-delay pCASL with a single-shot background suppressed 3D GRASE sequence. Six optimal PLD protocols based on the simulation results were tested. The common parameters included: FOV=220x220mm2, voxel size=3.4x3.4x5mm3; 20 slices, TE/TR=31/4500ms, labeling duration=1.5s, scan time=6.5 minutes. CBF and ATT maps were calculated from each ASL dataset. The CBF and ATT maps generated from all PLD protocols served as the ground truth. Voxels were excluded if the estimated ground truth values of ATT and CBF were ≥2.2s and ≥200 mL/100 g/min, respectively. To reduce the inter-subject variation, the relative RMSE (rRMSE) values by dividing absolute RMSE by the ground truth values in each subject were used for comparison.
RESULTS and DISCUSSION
A series of optimal PLD protocols with different combinations of NPLDs and Nave were generated using the three ATT distribution models. According to the MC simulation results, 6 PLD protocols including 6 PLDs with 7 averages, and 7 PLDs with 6 averages with the three ATT models, referred to as Gau-6-7, Gau-7-6, Uni-6-7, Uni-7-6, Eve-6-7, Eve-7-6, respectively, showed overall smaller RMSE in both ATT and CBF estimations across the ATT range than the other sets of optimal PLDs. The six PLD protocols (Table 2) were used for in vivo experiments. Figure 2 shows the CBF and ATT errors across the ATT range from the MC simulation data. Gau-6-7, Eve-6-7, and Eve-7-6 showed lower RMSEs in ATT estimation than the other protocols, and Gau-7-6 showed superior accuracy in CBF estimation with the lowest RMSE. Figure 3 displays the CBF, ATT, and error maps from one exemplary subject. All six protocols offer a reasonable qualitative agreement with the ground truth images. The mean RMSE in gray matter and RMSE across ATT from the same subject are plotted in Figure 4. Consistent to the MC simulation results, Gaussian model showed better accuracy in both CBF and ATT measurements. However, there are some discrepancies between simulation and in vivo data in ATT estimations using ATT uniform and evenly-spaced models. Figure 5 presents the average RMSEs in CBF and ATT across subjects. There is a strong correspondence in CBF estimation between the MC simulation and in-vivo data. The optimal PLD protocol using ATT Gaussian model presented better CBF accuracy than those with the other two ATT models. However, there were no consistent findings in ATT estimation across subjects with the three ATT distribution models, which may be attributed to the variations in ATT distribution across subjects, small sample size, or the contamination of macrovascular signals14.CONCLUSION
Optimal PLDs were generated using an CRLB based optimization framework by incorporating ATT distribution, which were evaluated in both simulation and in vivo data. Our preliminary data suggests that the accuracy of CBF measurement is improved by optimizing PLDs using ATT prior Gaussian probability distribution. Future work is needed to further validate the optimal PLD protocols in a larger cohort and in patient populations.Acknowledgements
This work was supported by NIH grants K25 AG056594, R01NS118019, RF1AG072490, and BrightFocus foundation A20201411S.
References
1. Alsop DC, Detre JA, Golay X, Günther M, Hendrikse J, Hernandez‐Garcia L, Lu H, MacIntosh BJ, Parkes LM, Smits M, Van Osch MJ. Recommended implementation of arterial spin‐labeled perfusion MRI for clinical applications: A consensus of the ISMRM perfusion study group and the European consortium for ASL in dementia. Magnetic resonance in medicine. 2015 Jan;73(1):102-16.
2. Woods JG, Chappell MA, Okell TW. A general framework for optimizing arterial spin labeling MRI experiments. Magnetic resonance in medicine. 2019 Apr;81(4):2474-88.
3. Woods JG, Chappell MA, Okell TW. Designing and comparing optimized pseudo-continuous Arterial Spin Labeling protocols for measurement of cerebral blood flow. NeuroImage. 2020 Dec 1;223:117246.
4. Zun Z, Wong EC, Nayak KS. Assessment of myocardial blood flow (MBF) in humans using arterial spin labeling (ASL): feasibility and noise analysis. Magnetic Resonance in Medicine: An Official Journal of the International Society for Magnetic Resonance in Medicine. 2009 Oct;62(4):975-83.
5. Buxton RB, Frank LR, Wong EC, Siewert B, Warach S, Edelman RR. A general kinetic model for quantitative perfusion imaging with arterial spin labeling. Magnetic resonance in medicine. 1998 Sep;40(3):383-96.
6. Rao CR. Information and the accuracy attainable in the estimation of statistical parameters. InBreakthroughs in statistics 1992 (pp. 235-247). Springer, New York, NY.
7. Cramér H. Mathematical Methods of Statistics (PMS-9), Volume 9. Princeton university press; 2016 Jun 2.
8. Owen, D., Melbourne, A., Thomas, D., De Vita, E., Rohrer, J. and Ourselin, S., 2016, October. Optimization of arterial spin labelling using Bayesian experimental design. In International Conference on Medical Image Computing and Computer-Assisted Intervention (pp. 511-518). Springer, Cham.
9. Ashburner J, Barnes G, Chen CC, Daunizeau J, Flandin G, Friston K, Kiebel S, Kilner J, Litvak V, Moran R, Penny W. SPM12 manual. Wellcome Trust Centre for Neuroimaging, London, UK. 2014 Jun 26;2464.
10. Chen P, Zeng W, Chen M, Yu G, Wang Y. Modeling arterial travel time distribution by accounting for link correlations: a copula-based approach. Journal of Intelligent Transportation Systems. 2019 Jan 2;23(1):28-40.
11. Wong EC. An introduction to ASL labeling techniques. Journal of Magnetic Resonance Imaging. 2014 Jul;40(1):1-0.
12. Odudu A, Nery F, Harteveld AA, Evans RG, Pendse D, Buchanan CE, Francis ST, Fernández-Seara MA. Arterial spin labelling MRI to measure renal perfusion: a systematic review and statement paper. Nephrology Dialysis Transplantation. 2018 Sep 1;33(suppl_2):ii15-21.
13. Dai W, Robson PM, Shankaranarayanan A, Alsop DC. Reduced resolution transit delay prescan for quantitative continuous arterial spin labeling perfusion imaging. Magnetic resonance in medicine. 2012 May;67(5):1252-65.
14. Zhang LX, Woods JG, Okell TW, Chappell MA. Examination of optimized protocols for pCASL: Sensitivity to macrovascular contamination, flow dispersion, and prolonged arterial transit time. Magnetic Resonance in Medicine. 2021 May 19.
Figures
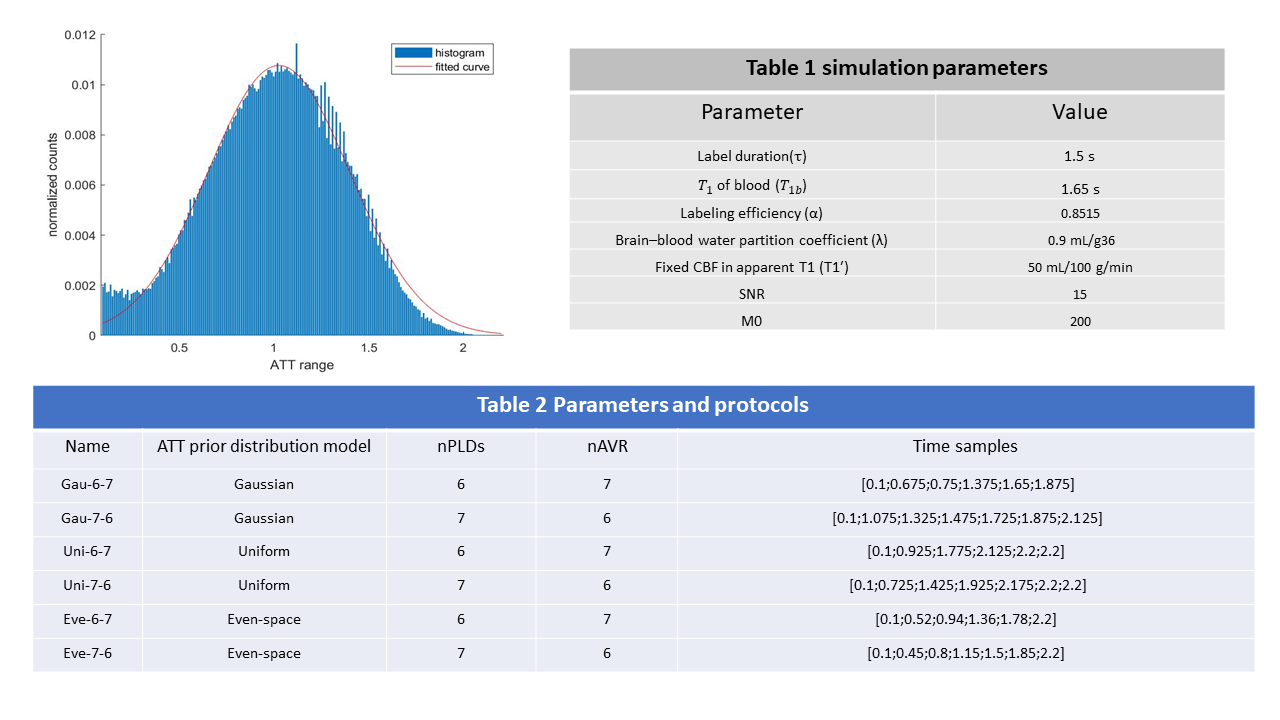
Figure 1 Left figure shows the histogram of ATT (the ATT values range from 100ms to 2200ms) distribution from 18 subjects with gaussian fitting; Table 1 lists the parameters used in ASL model simulation. Table 2 lists Optimal PLD protocols with the three ATT distribution models.
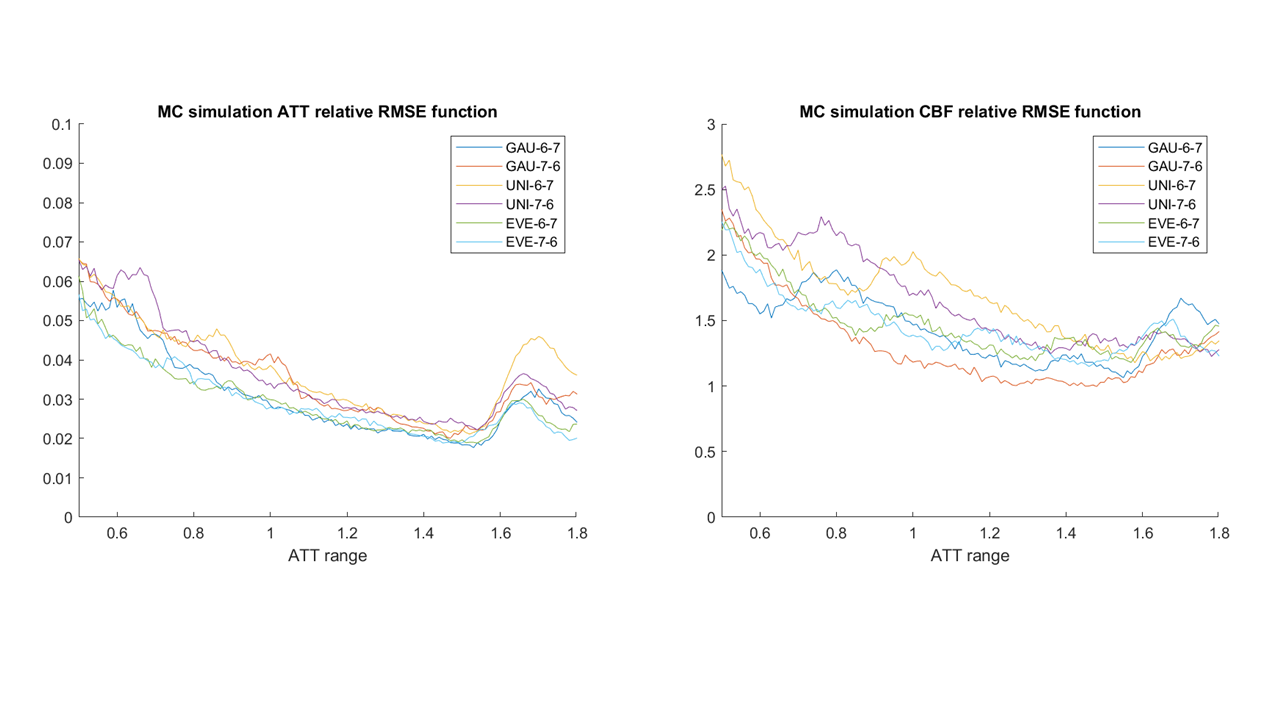
Figure 2 relative Root Mean Square Errors(rRMSEs) of ATT (left) and CBF (right) across ATT range from 500ms to 1800ms using the six protocols from the Monte Carlo simulations.
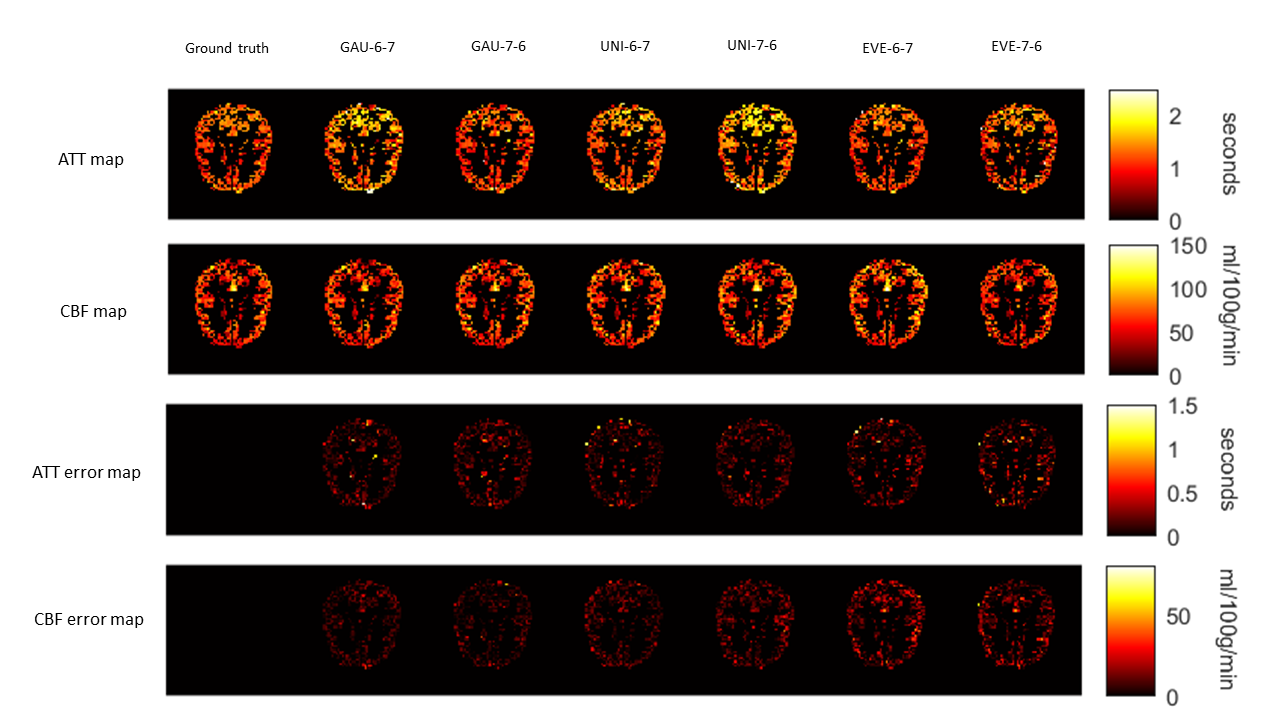
Figure 3 In vivo CBF and ATT maps and corresponding error maps with the six protocols from a single subject. The ground truth maps are shown on the left side.
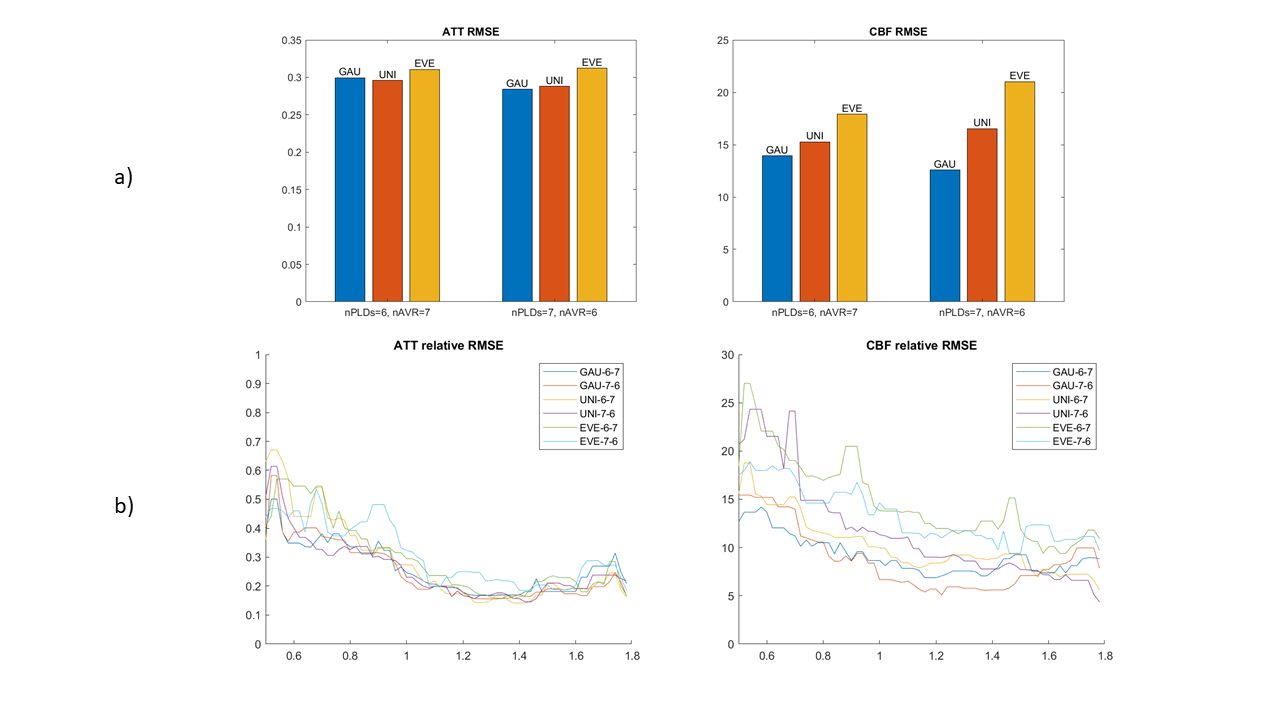
Figure 4 a) The mean rRMSE of gray matter ATT and CBF estimations from the same subject of Figure 3 using the six protocols. b) rRMSE across the ATT range. A mean filter with kernel = 5 was applied to smooth the rRMSE curves.
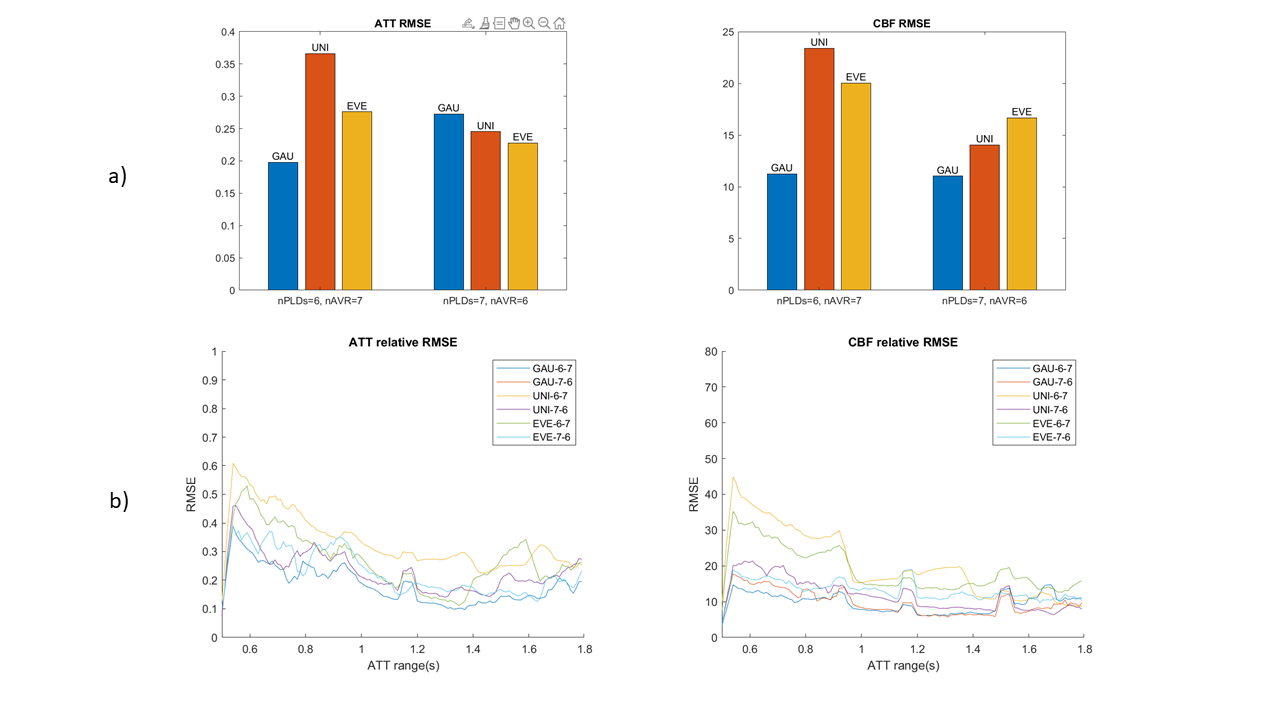
Figure 5 a) the averaged rRMSE of gray matter ATT and CBF across subjects. b) rRMSE curves across ATT range averaged by all subjects, smoothed by mean filter with kernel 5.