4882
Sinusoidal oxygen respiratory paradigm for perfusion MRI1Biomedical Engineering, University of Southern California, Los Angeles, CA, United States, 2Neuroscience Graduate Program, University of Southern California, Los Angeles, CA, United States, 3Amsterdam UMC, Amsterdam, Netherlands, 4University of Southern California, Los Angeles, CA, United States
Synopsis
Gadolinium-based Dynamic Susceptibility Contrast (DSC) MRI is a popular technique to measure brain perfusion. However, it requires the use of an invasive exogenous contrast agent which accumulates in tissue and impedes repeated measurements. To overcome the need of gadolinium injection, this study employed the noninvasive deoxygenated DSC (dDSC) technique and proposed a novel respiratory challenge paradigm which delivers a sinusoidally-modulated oxygen stimulus as an endogenous contrast to measure perfusion. We evaluated this paradigm on 10 healthy controls and compared cerebral blood flow against other perfusion MRI techniques such as gadolinium-based DSC and arterial spin labeling.
Introduction
Gadolinium-based Dynamic Susceptibility Contrast (DSC) is a popular imaging method to assess brain perfusion in cerebral pathologies such as stroke, brain tumors, and traumatic brain injuries.1-3 Despite its various clinical applications, DSC is limited by its reliance on exogenous gadolinium contrasts, which can accumulate in tissue and are associated with nephrogenic systemic fibrosis in the presence of renal failure.4,5 Respiratory challenges provide a safer, non-invasive alternative to gadolinium contrast in perfusion studies. Using transient hypoxia or hyperoxia to modulate the blood oxygen content, deoxygenation-based DSC (dDSC) can induce T2-weighted changes on the MRI signal, similar to the paramagnetic effects of gadolinium.6-8 Here, we introduce a novel dDSC respiratory challenge paradigm to induce sinusoidal fluctuations of deoxyhemoglobin concentration and assess its feasibility of estimating cerebral blood flow (CBF) in comparison with gadolinium-based DSC and ASL.Methods
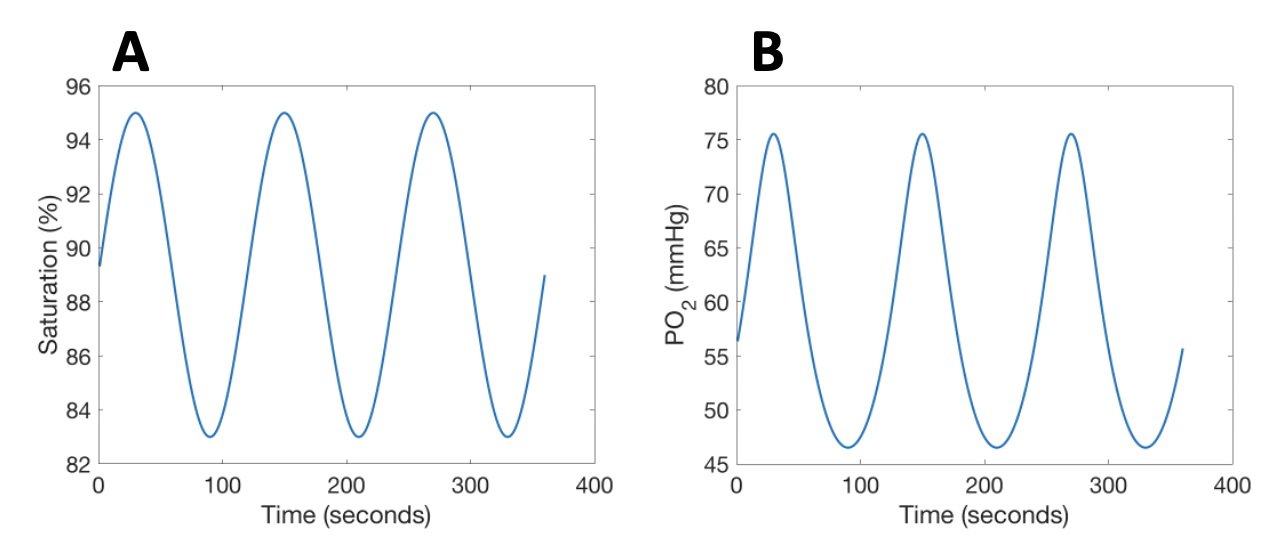
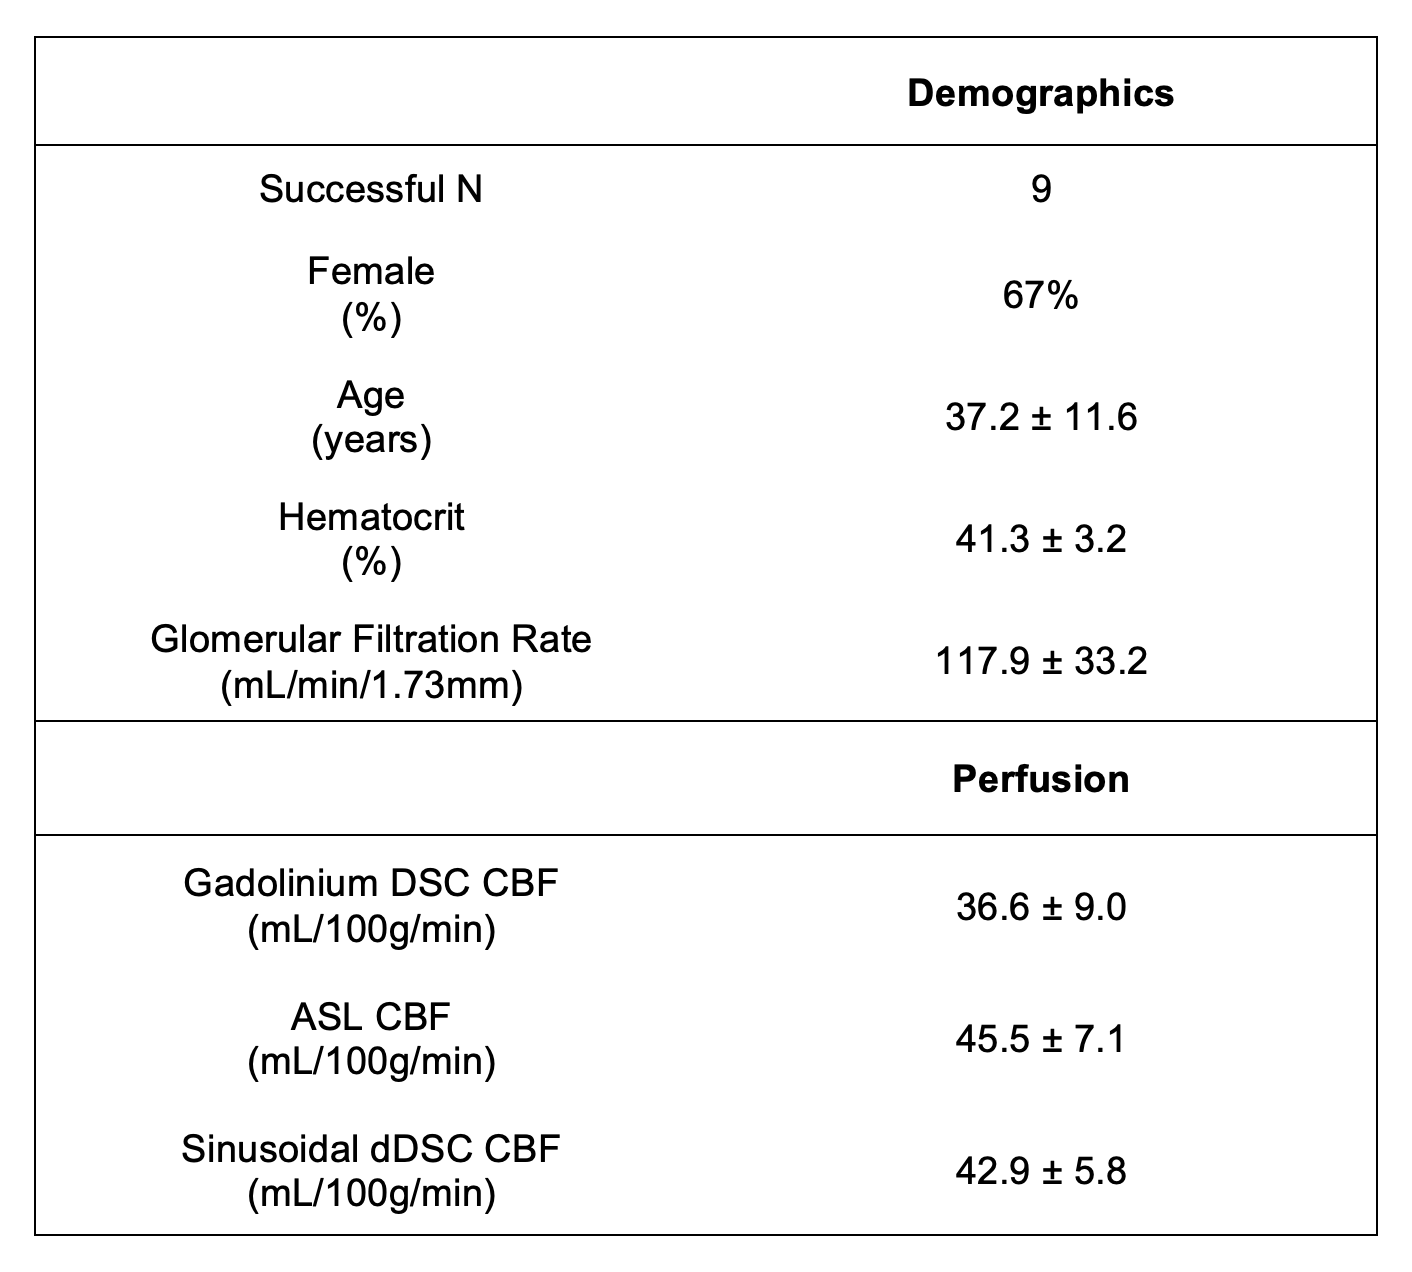
MRI: BOLD MRI was acquired on 10 healthy volunteers (6F:4M, age 37±11, Table 1) with 3T Philips Achieva: TE=30ms, TR=1500ms, resolution 2.5×2.5×2.5mm3. Images were motion-corrected, segmented into grey- (GM) and white matter (WM) and smoothed using 4mm Gaussian kernel. Signal from the middle cerebral artery (MCA) was isolated as the arterial input function (AIF). Regions of interest were derived from the USCBrain Atlas with modifications to the deep white matter structures where WM tracts were manually added.9 For ASL, a time-encoded pCASL sequence was used: TR/TE = 5040/16ms; Hadamard-8 matrix with seven blocks of 2000, 800, 500, 300, 250, 200 and 150ms, PLD = 100ms.Respiratory Protocol: Challenges were performed using a computer-controlled gas blender (RespirAct, Thornhill Research Inc, Toronto, Canada).10 A two-cycle SpO2 pattern of period 120s and amplitude 10% (saturations between 85–95%) was targeted (Figure 1A) by computing the required pO2 time series (Figure 1B) using the hemoglobin dissociation curve.11
Perfusion Processing: Concentration time curve signal is calculated as $$$C(t)=-\frac{1}{TE}ln(\frac{S(t)}{S_0})$$$, with baseline S0. CBF was calculated as deconvolution from the tracer kinetics model: $$$C_{tissue}(t)=AIF(t)\otimes(CBF\times R(t))$$$, where R(t) is the residue function,12 modeled as $$$R(t)=e^{-t/TT}$$$, with transit time TT. This model can be expressed in Fourier domain: $$$|\mathcal{F}(C_{tissue})|=\pi\times A_{AIF}\times (sinc((f-f_c)T)+sinc((f+f_c)T))\times CBF\times\frac{1}{\sqrt{TT^2+(2\pi f)^2}}$$$, with arterial signal amplitude AAIF, frequency fc, and rect windowing function of duration T.
Results
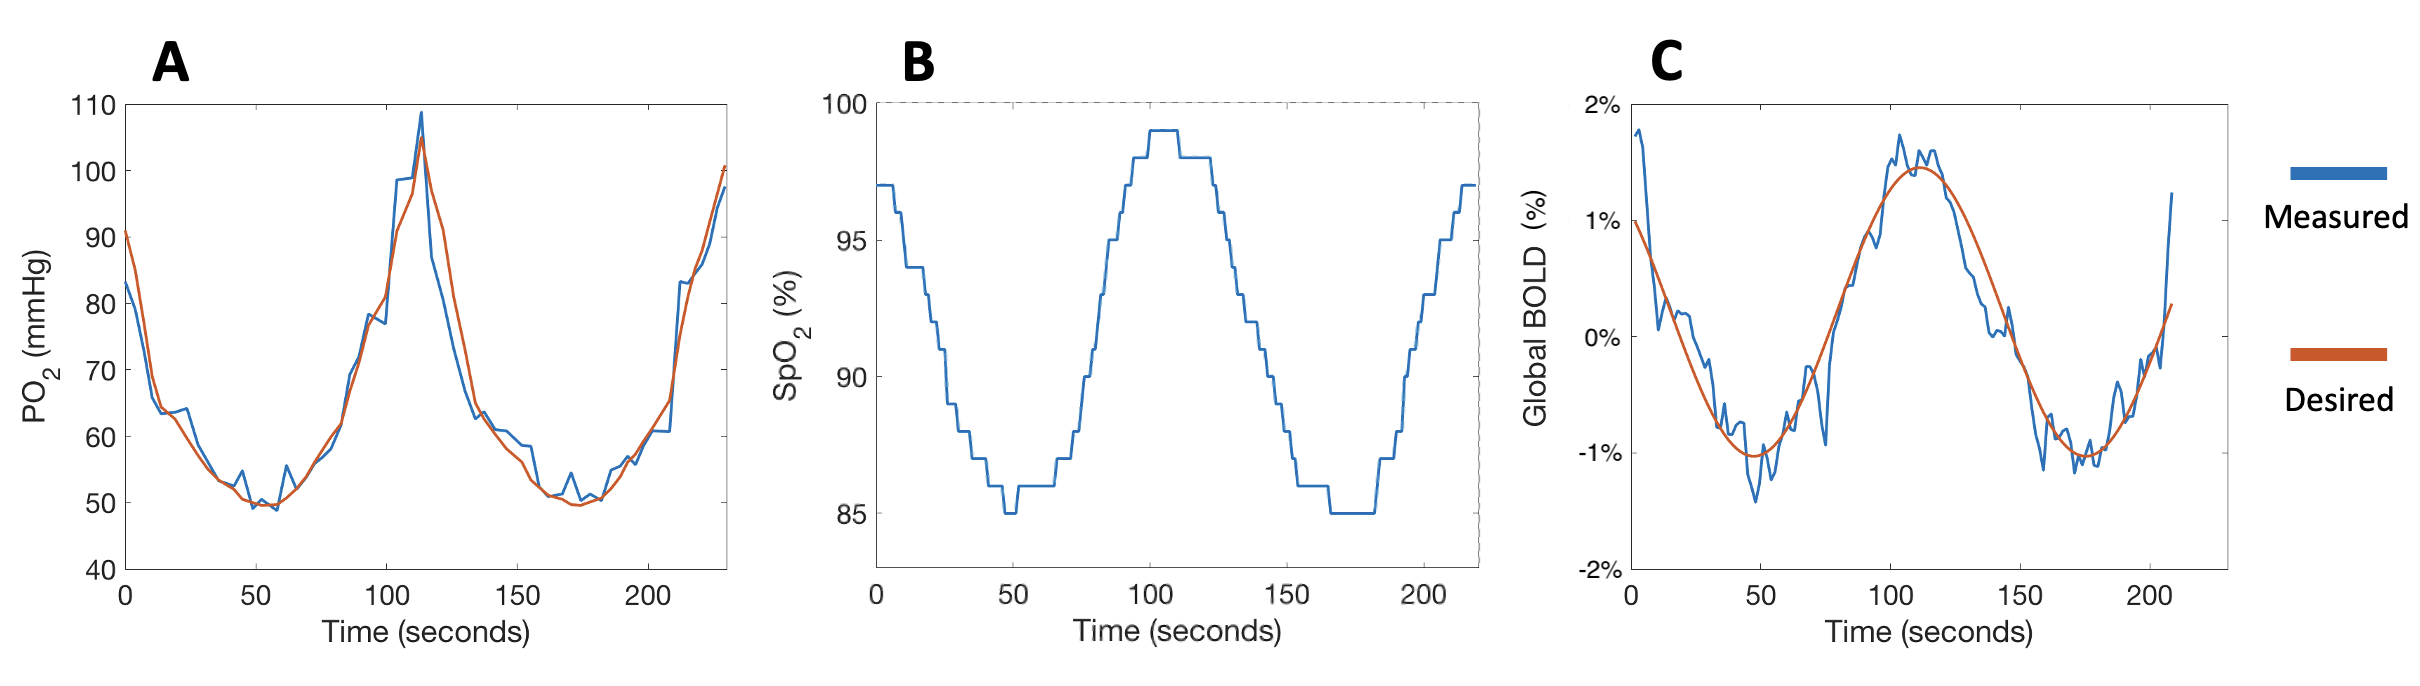
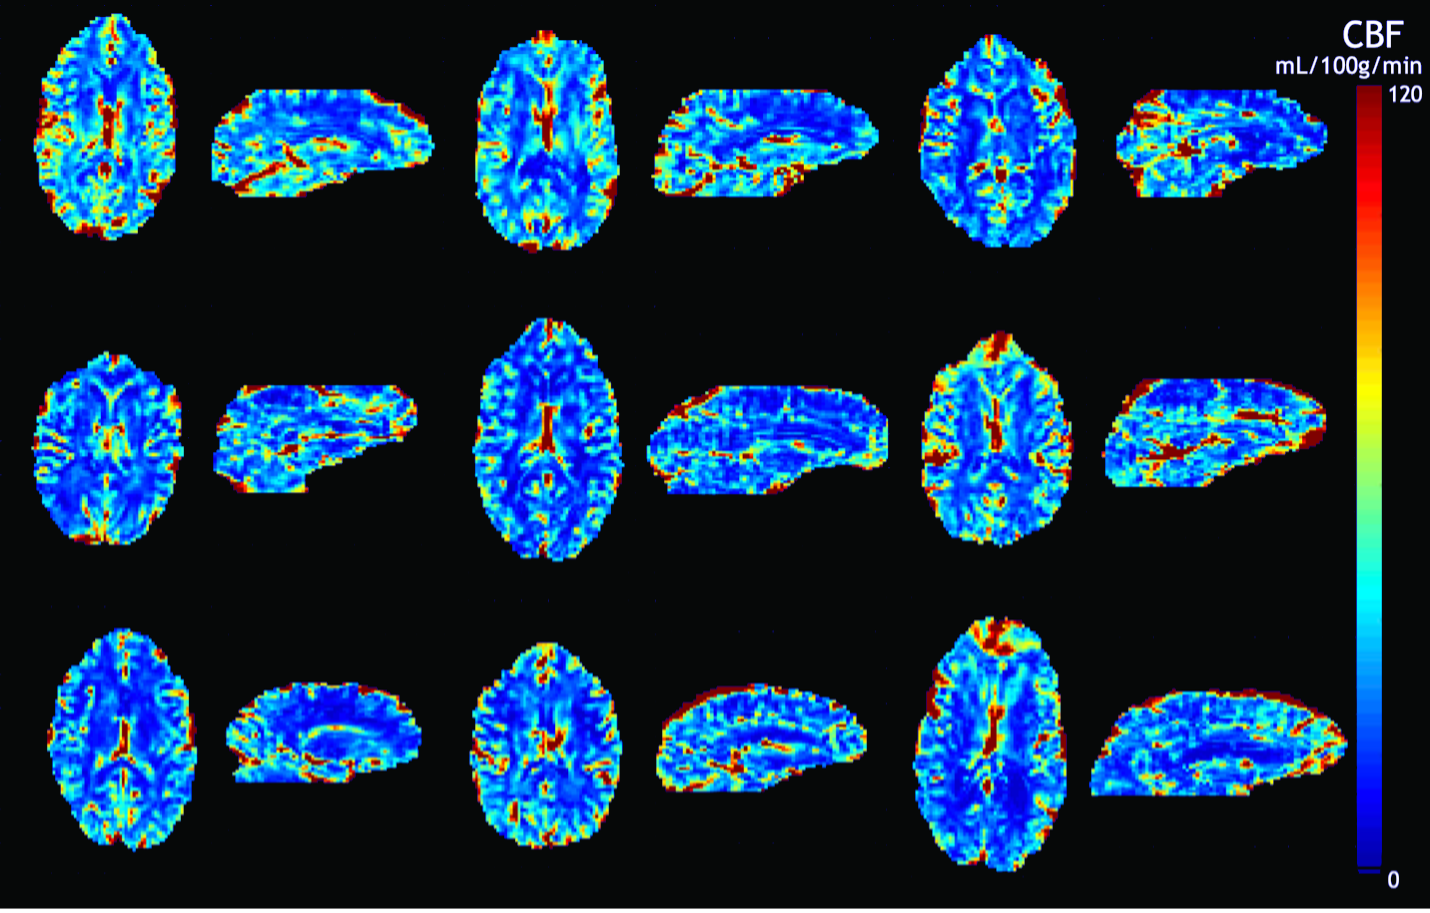
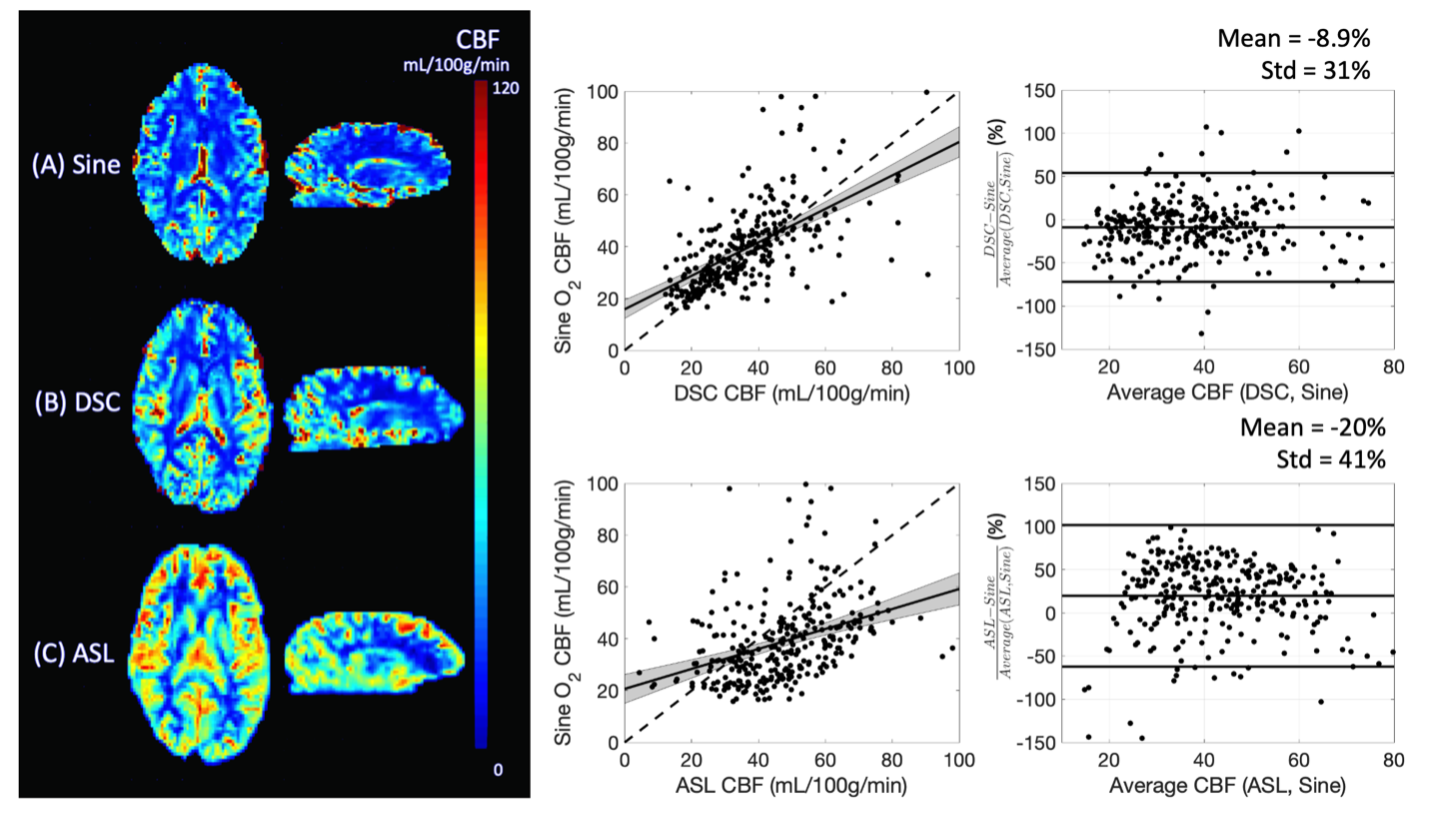
No subjects reported discomfort during the respiratory challenge. Table 1 details the demographics of our study cohort; one subject was excluded from our analysis due to gas leakage (subject had a beard). Measured end-tidal pO2, fingertip pulse oximetry SpO2 and global BOLD signal are shown in Figure 2 for a representative subject. Subjects demonstrated a global BOLD change amplitude of 0.8±0.2% due to the gas challenge, with larger effect size in GM (1.0±0.2%) compared to WM (0.6±0.1%, p<0.01).Mean sinusoidal dDSC CBF maps for each subject are shown in Figure 3, and the mean measurements using sinusoidal dDSC, gadolinium DSC and ASL for the cohort are detailed in Table 1. Baseline whole-brain CBF measured by sinusoidal dDSC was systematically higher compared to gadolinium-based DSC technique (p<0.01), with bias of 6.3 mL/100g/min and limits of agreement of 9.1 mL/100g/min in our cohort. On the other hand, dDSC CBF was unbiased compared to ASL and had limits of agreement of 8.5 mL/100g/min. CBF maps, scattergram and Bland-Altman analyses for one representative subject derived from the 3 methods are shown in Figure 4, suggesting good regional agreement between dDSC and gadolinium-based DSC but underestimation in GM perfusion compared to ASL.
Discussion
Here, we used a computer-controlled gas blender to modulate end tidal O2 partial pressures in a periodic pattern to produce sinusoidal oscillations in oxygen saturation and BOLD signal in the brain, which could easily be transformed into CBF measurements using modified tracer kinetic modeling. CBF maps generated for each subject showed good regional agreement between dDSC, gadolinium-based DSC and ASL. Moreover, CBF values were within acceptable range of the literature.13The advantage of using a sinusoidal signal instead of transient hypoxia pulses6,7 lies in the simplification of the CBF calculation and a continuous “duty-cycle” for improved signal to noise. Traditional gadolinium-based DSC and transient hypoxia dDSC requires deconvolution of the arterial input function from cerebral tissue signal, which is vulnerable to noise. Alternatively, the sine wave paradigm simplifies this deconvolution into a division in the Fourier domain at the specific frequency of the sine wave input to calculate CBF.
The lower CBF yielded by gadolinium-based dDSC compared to both sinusoidal dDSC and ASL was likely due to suboptimal injection rates of the gadolinium contrast (power injector was unavailable). Alternatively, we cannot exclude the possibility of hypoxia-mediated hyperemia, as the sine wave SpO2 target was centered at 90% (lower compared to normal values of 98% in healthy controls) and prolonged exposure to hypoxia have shown to increase baseline blood flow as compensation for lower blood oxygen content.14 However, we consider these systematic biases acceptable since clinicians rely on relative perfusion differences between diseased and normal-appearing cerebral tissue rather than absolute CBF.
In conclusion, this study proposed the use of sinusoidally-modulated fluctuations in oxygen saturation as a safe alternative to invasive gadolinium injection in perfusion MRI experiments. Future work is required to validate this perfusion technique in more subjects in addition to assessing its clinical utility in subjects with ischemic strokes or brain tumors.
Acknowledgements
The authors would like to thank Dr. Ashley Stokes and colleagues for the generous release of the DSC imaging sequence and processing script. This work was supported by National Heart, Lung, and Blood Institute (grant 1U01-HL-117718-01, 1R01-HL136484-01A1), the National Center for Research (5UL1-TR000130-05) through the Clinical Translational Science Institute at Children’s Hospital Los Angeles, the National Institutes of Health (grant R01-NS074980), and the National Institute of Neurological Disorders and Stroke (grant 1F31NS106828‐01A1). Chau Vu was supported by the Core Pilot Program and a Research Career Development Fellowship from the Saban Research Institute at Children’s Hospital Los Angeles. Philips Healthcare provided support for protocol development and applications engineering on a support-in-kind basis.References
1. Yamada K, Wu O, Gonzalez RG, et al. Magnetic resonance perfusion-weighted imaging of acute cerebral infarction: effect of the calculation methods and underlying vasculopathy. Stroke. 2002;33:87-94.
2. Young GS. Advanced MRI of adult brain tumors. Neurol Clin. 2007;25:947-973.
3. Beaumont A, Fatouros P, Gennarelli T, Corwin F, Marmarou A. Bolus tracer delivery measured by MRI confirms edema without blood-brain barrier permeability in diffuse traumatic brain injury. Acta Neurochir Suppl. 2006;96:171-174.
4. Agarwal R, Brunelli SM, Williams K, Mitchell MD, Feldman HI, Umscheid CA. Gadolinium-based contrast agents and nephrogenic systemic fibrosis: a systematic review and meta-analysis. Nephrol Dial Transplant. 2008;24(3):856-863. doi:10.1093/ndt/gfn593
5. Murata N, Gonzalez-Cuyar LF, Murata K, et al. Macrocyclic and Other Non–Group 1 Gadolinium Contrast Agents Deposit Low Levels of Gadolinium in Brain and Bone Tissue. Invest Radiol. 2016;51(7):447-453.
6. Vu C, Chai Y, Coloigner J, Nederveen AJ, Borzage M, Bush A, Wood JC. Quantitative perfusion mapping with induced transient hypoxia using BOLD MRI. Magn Reson Med. 2021 Jan;85(1):168-181. doi: 10.1002/mrm.28422. Epub 2020 Jul 27. PMID: 32767413; PMCID: PMC7728454.
7. Poublanc J, Sobczyk O, Shafi R, Sayin ES, Schulman J, Duffin J, Uludag K, Wood JC, Vu C, Dharmakumar R, Fisher JA, Mikulis DJ. Perfusion MRI using endogenous deoxyhemoglobin as a contrast agent: Preliminary data. Magn Reson Med. 2021. doi: 10.1002/mrm.28974.
8. MacDonald ME, Berman AJL, Mazerolle EL, Williams RJ, Pike GB. Modeling hyperoxia-induced BOLD signal dynamics to estimate cerebral blood flow, volume and mean transit time. Neuroimage. 2018 Sep;178:461-474. doi: 10.1016/j.neuroimage.2018.05.066. Epub 2018 May 29. PMID: 29852282.
9. Joshi AA, Choi S, Chong M, Sonkar G, Gonzalez-Martinez J, Nair D, Wisnowski JL, Haldar JP, Shattuck DW, Damasio H, Leahy RM (2020) “A Hybrid High-Resolution Anatomical MRI Atlas with Sub-parcellation of Cortical Gyri using Resting fMRI” bioRxiv 2020.09.12.294322.
10. Slessarev M, Han J, Mardimae A, et al. Prospective targeting and control of end-tidal CO2 and O2 concentrations. J Physiol. 2007;581(Pt 3):1207-1219. doi:10.1113/jphysiol.2007.129395
11. Kaufman DP, Kandle PF, Murray I, Dhamoon AS. Physiology, Oxyhemoglobin Dissociation Curve. 2021 Aug 6. In: StatPearls [Internet]. Treasure Island (FL): StatPearls Publishing; 2021 Jan. PMID: 29762993.
12. Østergaard L. Principles of cerebral perfusion imaging by bolus tracking. J Magn Reson Imaging. 2005;22(6):710-717. doi:10.1002/jmri.20460
13. GRANDIN C, BOL A, SMITH A, MICHEL C, COSNARD G. Absolute CBF and CBV measurements by MRI bolus tracking before and after acetazolamide challenge: Repeatabilily and comparison with PET in humans. Neuroimage. 2005;26(2):525-535. doi:10.1016/j.neuroimage.2005.02.028
14. Xu F, Liu P, Pascual JM, Xiao G, Lu H. Effect of Hypoxia and Hyperoxia on Cerebral Blood Flow, Blood Oxygenation, and Oxidative Metabolism. J Cereb Blood Flow Metab. 2012;32(10):1909-1918. doi:10.1038/jcbfm.2012.93
Figures