4881
Customized whole-brain covering GRASE in multi-delay pCASL for distinct contrasts and adequate SNRs in hemodynamic parameter mappings1UIH America, Inc., Houston, TX, United States, 2United Imaging Healthcare, Shanghai, China
Synopsis
We report that manipulation of GRASE readout with SORT view-ordering in multi-delay ASL on either gradient echo trains for adjusted spatial resolutions or FSE train for modulated T2-blurring can significantly alter the perfusion hemodynamic parameter mapping contrasts among tissues and among cerebral lobes under different pathways of blood circulation, and can meanwhile regulate the SNRs of the maps. Among the performed GRASE designs, the readout with moderate spatial resolution and segmented kz is recommended for sharp GM/WM contrasts in CBF and ATT maps in conjunction with distinct contrast between anterior and posterior circulations in the ATT map, with adequate SNRs.
Introduction
Multi-delay ASL has been applied to the human brain research with the ability of quantifying perfusion hemodynamic parameters including cerebral blood flow (CBF) and arterial transit time (ATT). The influence of flexible designs of the commonly used 3D GRASE in multi-delay ASL on the quantification has not been explicitly investigated. The manipulation of the readout sequence allows adjustments of EPI factor, echo train length (ETL) of fast spin echo (FSE), and acquisition segmentation along phase-encoding dimension(s). These variations directly dictate echo-train duration (ETD) and spatial resolution, both of which may induce variations in mapping the hemodynamic parameters. Besides, for multi-delay ASL, the motion-sensitized module for vessel suppression largely diminishes signal-to-noise ratios (SNRs) of the acquired perfusion signals and the low SNRs are carried over to the hemodynamic parameter maps. Thus, the SNRs need to be assessed while manipulating GRASE for varied spatial resolutions. Here, the influence of the important designs for whole brain-covering GRASE readout is evaluated with healthy volunteers. With an EPI factor for moderate in-plane spatial resolution and a split of FSE train for segmented kz acquisition, sharper gray matter (GM)/white matter (WM) contrast in both CBF and ATT maps along with greater distinction reflecting anterior and posterior circulations in the ATT maps can be simultaneously achieved in adequate SNRs. This customized configuration is favored for quantification accuracy.Methods
Separate off-resonance and T2 (SORT)1 view-ordering was employed in the 3D GRASE sequence to arrange echo signals from EPI and FSE trains respectively along different phase-encoding dimensions (i.e., ky and kz), as demonstrated in Figure 1a. The 3D GRASE readout preceded with the pCASL preparation, background suppression pulses, and the vessel suppression module was performed with four healthy volunteers (33.25 ± 7.18 y/o) at 3.0 T using a uMR 790 scanner (United Imaging Healthcare). Sequential multi-delay ASL acquisition with five post-labeling delays (PLDs) ([500:500:2500] ms) and two averages for each PLD was employed. The motion-sensitized module was applied prior to the readout for vessel signal suppression. Field-of-views (FOVs) of 224×224 and 192×192 mm2 were set respectively for the two matrix sizes of 64×64 (regular resolution, RR) and 80×80 (high resolution, HR) with different EPI factors. Slice oversampling was 10% and partial Fourier along kz was ¾. 32 axial slices covered a whole brain. For each resolution, conjoint kz (one kz segment, S1) and segmented kz (two kz segments, S2) designs were examined, respectively. RR-S1, RR-S2, HR-S1, and HR-S2 denote the four readouts/datasets. Bandwidth was 2600 Hz/pixel. The scanning durations were 6:26, 12:46, 6:33, and 12:58 min, respectively. The major scanning parameters are summarized in Figure 1b. For reference, a T1 FSE fluid-attenuated inversion recovery (FLAIR) sequence was scanned.The computations for the perfusion parameter quantification were conducted using the BASIL toolset2. The pristine images were fitted to the pCASL general kinetic model, as described below, based on the well-mixed single-compartment theories3,$$\Delta M(t) = \left\{\begin{array}{l}
0 & \quad \text{0<t<$\Delta$t}\\
2M{_0} {_b}fT{_1}{_a}{_p}{_p}e^{-\frac{{\Delta}t}{T{_1}{_b}}}\left(1-e^{-\frac{(t-{\Delta}t)}{T{_1}{_a}{_p}{_p}}}\,\right)& \quad \text{$\Delta$t}\leq\text{t}<\text{$\Delta$t}+\tau\\
2M{_0} {_b}fT{_1}{_a}{_p}{_p}e^{-\frac{{\Delta}t}{T{_1}{_b}}} e^{-\frac{(t-{\Delta t}-\tau)}{T{_1}{_a}{_p}{_p}}}\,\left(1-e^{-\frac{\tau}{T{_1}{_a}{_p}{_p}}}\right)& \quad \text{$\Delta$t}+\tau\leq\text{t} \,,\end{array}\right.$$
where ΔM(t) is the difference magnetization between control and label conditions, M0b is the equilibrium magnetization of arterial blood to be labeled, f is CBF, Δt is ATT, τ is labeling duration, T1b is the T1 relaxation time of the arterial blood, and T1app is the apparent T1 of tissue and is expressed as $$$\frac{1}{{T}{_1}{_a}{_p}{_p}}=\frac{1}{{T}{_1}}+\frac{f}{\lambda}\,,$$$ where T1 is the relaxation time of tissue and λ is brain-blood partition coefficient.
Results
Two exemplary slices from a subject are displayed in Figure 2. For the CBF maps, HR-S2 offers the greatest GM/WM contrast but suffers low SNR. RR-S2 shows comparably good GM/WM contrast with the highest SNR fidelity. For the ATT maps, RR-S2 provides the most distinct contrasts between GM and WM and between anterior and posterior circulation pathways, followed by HR-S2, whereas diminished SNR is inherited for HR-S2. The RR outperforms the HR readouts in both maps especially for GM abundant regions, for instance, clearer morphological characteristics emerge for the basal ganglia (Figs. 2c and 2d) with RR. Overall, RR-S2 exhibits outstanding contrasts and superior SNRs in both quantification maps over other readout designs. 15 slices by RR-S2 for a subject are displayed in Figure 3. The ATT and CBF quantification results for segmented GM and WM are analyzed and summarized in Figure 4 for the four subjects. It is straightforward to visualize that RR-S2 simultaneously gives rise to conspicuous GM/WM contrasts in CBF and ATT maps over others.Discussion and Conclusion
By manipulating GRASE acquisition in multi-delay ASL sequence with dual EPI factors for a switch for spatial resolution and dual FSE train lengths for T2-blurring modulation, the resulted ATT and CBF mappings are analyzed. Among the four readout designs, regular resolution with segmented kz acquisition (RR-S2) balances well between SNRs and contrasts, as can be evidently illustrated in both CBF and ATT maps. This customized GRASE sequence incorporated in multi-delay ASL is able to reliably inspect brain perfusion hemodynamics and is proposed for visualizing greatly enhanced tissue and perfusion circulation contrasts. The investigation contains scientific significance for amplified mapping contrasts and potentially accurate quantification of the important physiological parameters associated with cerebral blood perfusion, and thus is of notable value for clinical practice and research.Acknowledgements
No acknowledgement found.References
1. Mugler, J. P., 3rd. “Improved Three-Dimensional GRASE Imaging with the SORT Phase-Encoding Strategy.” Journal of Magnetic Resonance Imaging (1999).
2. Chappell, M. A., et al. “Variational Bayesian Inference for a Nonlinear Forward Model.” IEEE Transactions on Signal Processing (2009).
3. Buxton, R. B., et al. “A General Kinetic Model for Quantitative Perfusion Imaging with Arterial Spin Labeling.” Magnetic Resonance in Medicine (1998).
Figures
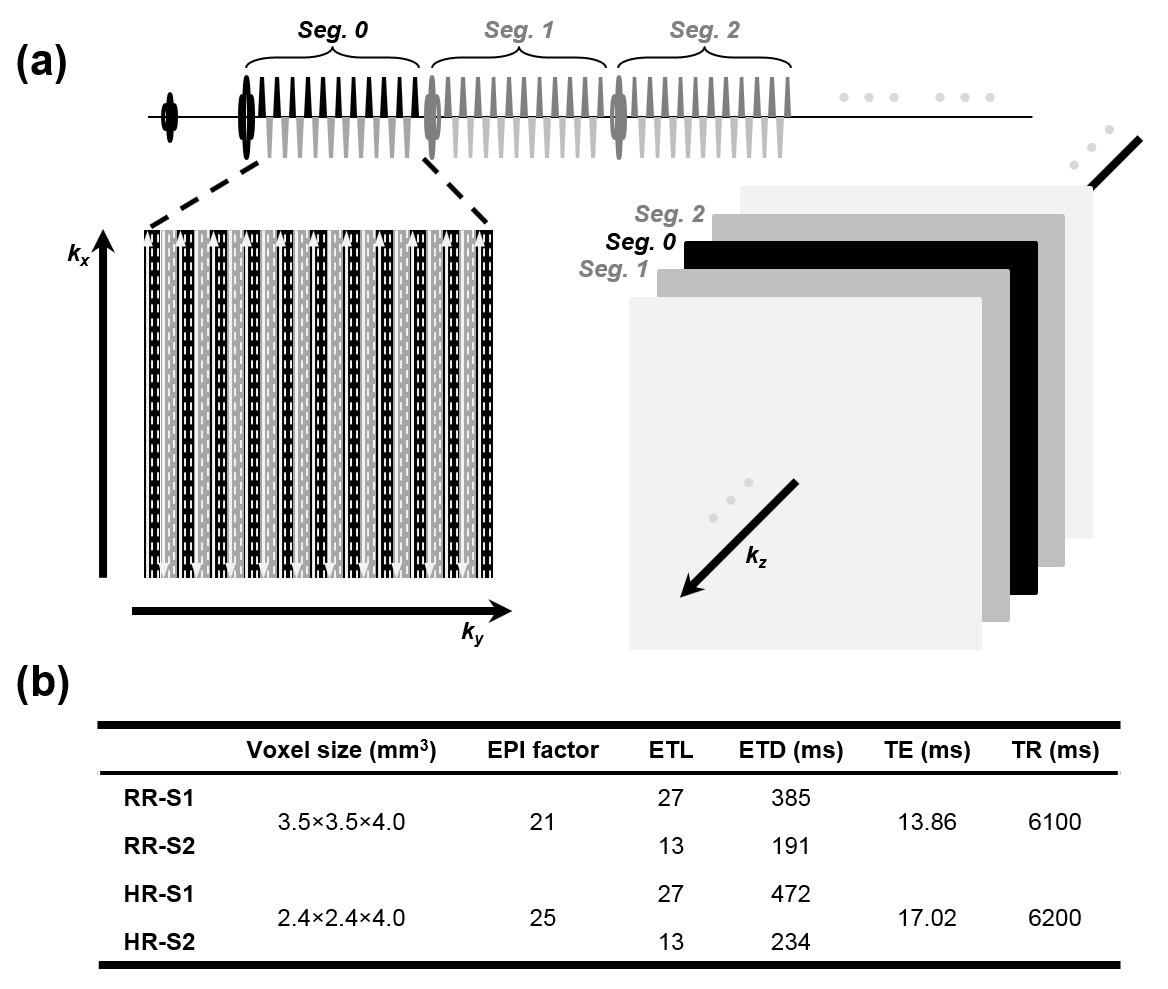
(a) All gradient echo signals from each FSE refocusing segment are bundled to fill the k-space lines at a single kz (in head-foot direction) partition and in an interleaved fashion along ky. Three ky shots are needed in this example. Bundles of echo signals from different FSE segments are respectively filled in a center-out way along kz. (b) Major sequence parameters for the four GRASE readouts.
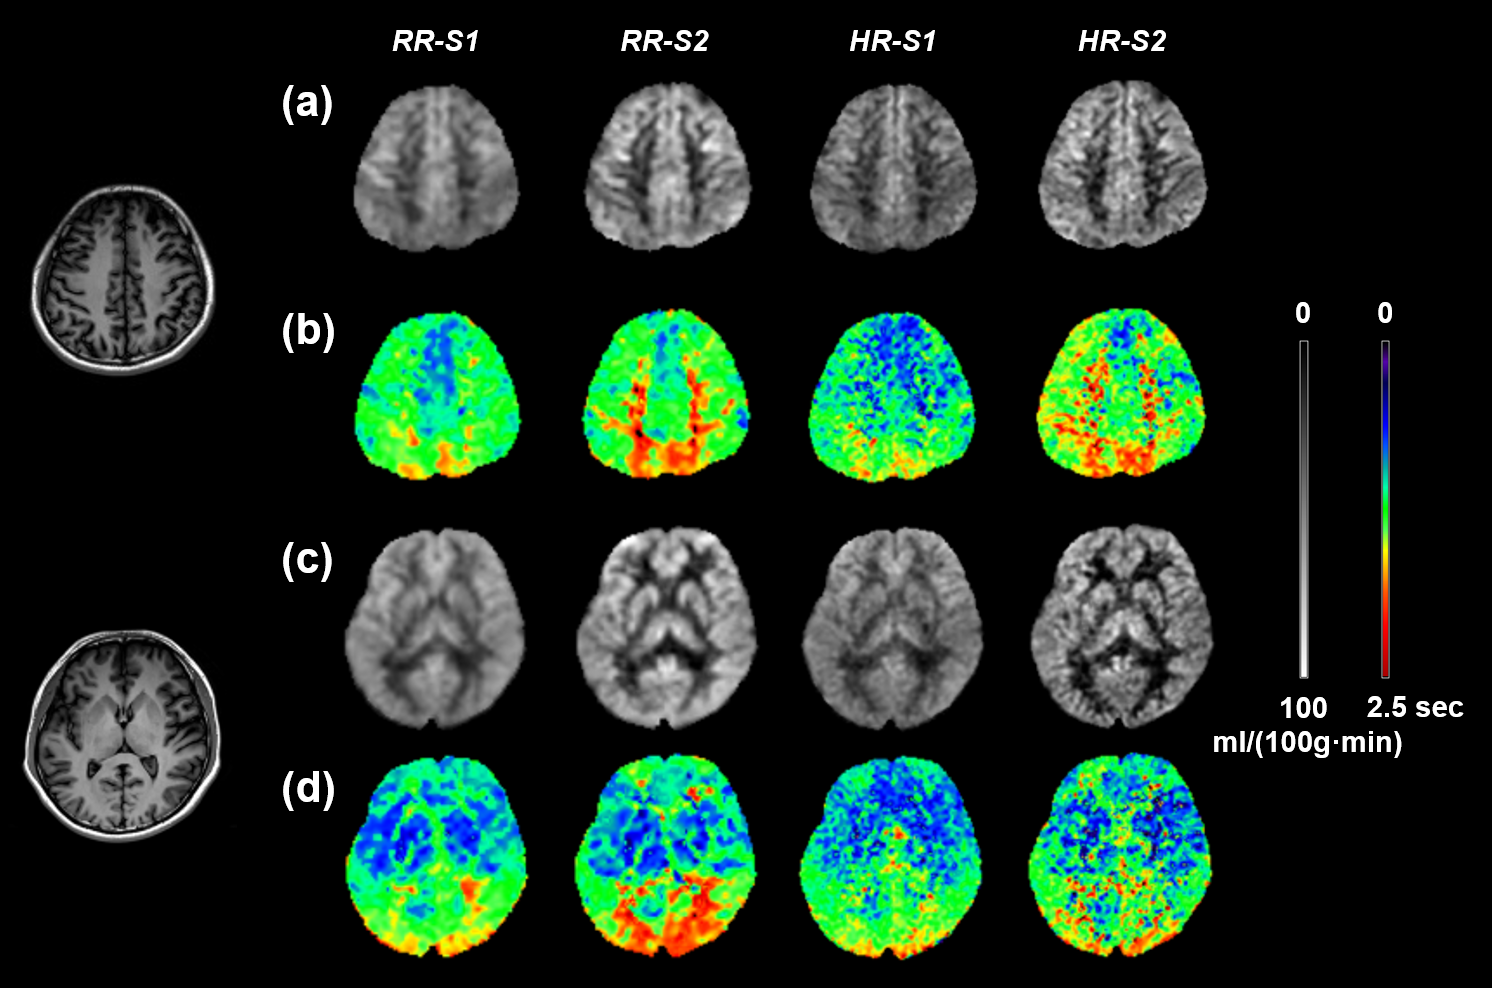
Left column: anatomical images of T1 FSE FLAIR for the two slices. Four GRASE readouts RR-S1, RR-S2, HR-S1, and HR-S2 are arranged from left to right for the CBF maps for the first slice (a) and second slice(c) and the ATT maps for the first slice (b) and second slice (d).
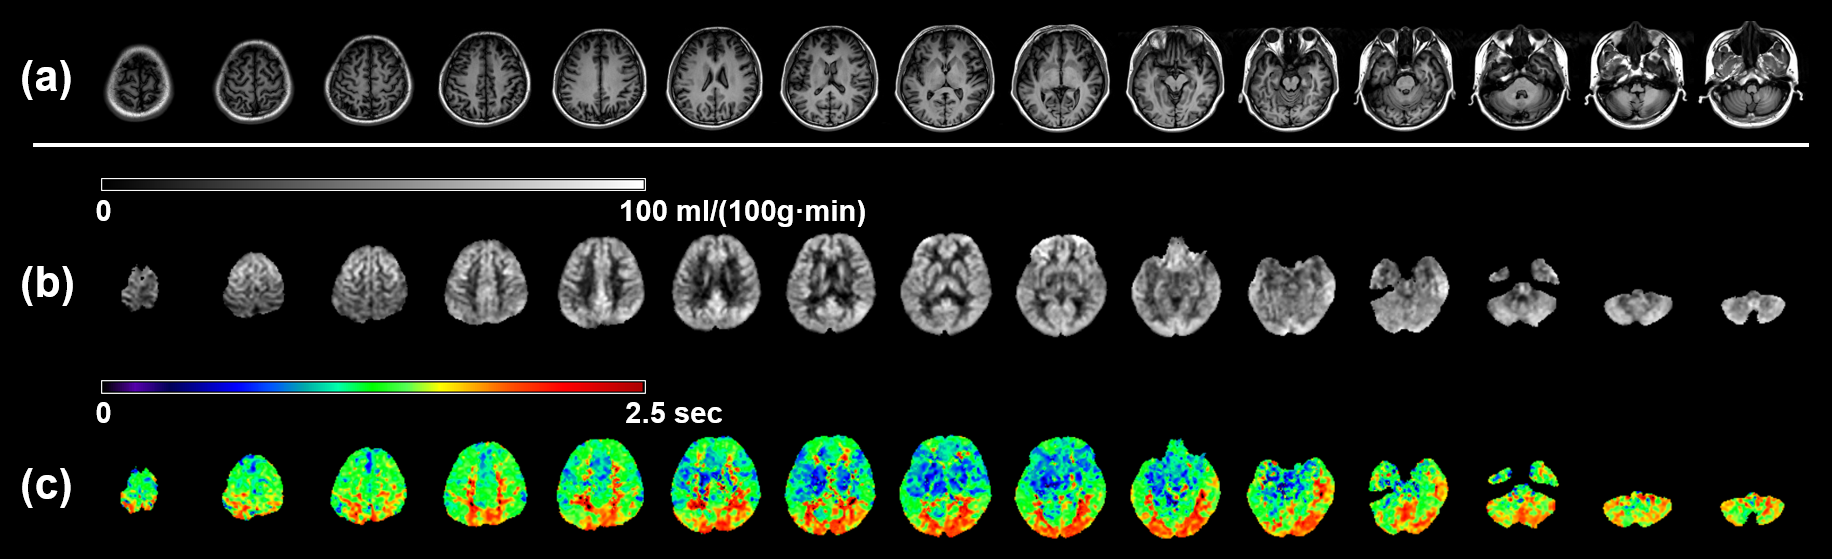
(a) T1 FSE FLAIR anatomical images. (b) CBF maps. (c) ATT maps.
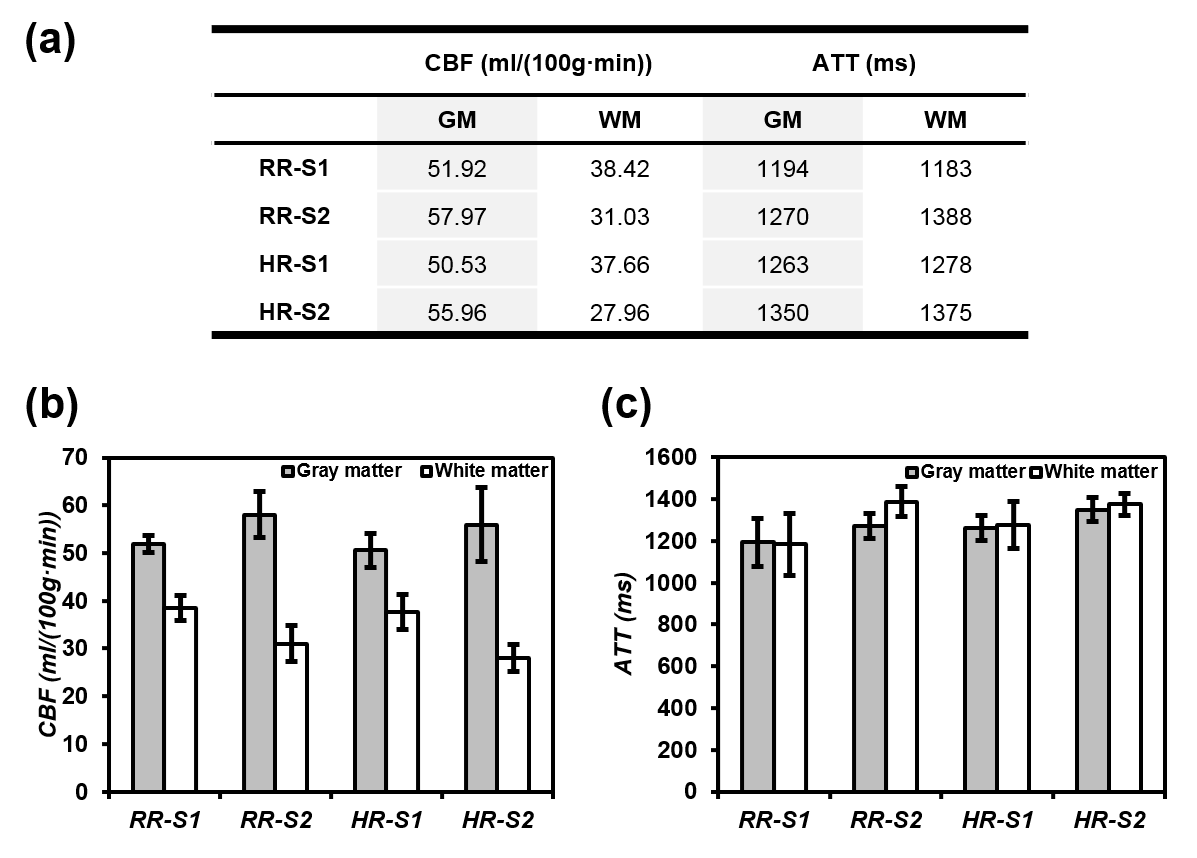
(a) Average CBF and ATT values over the four subjects for the four GRASE readout designs (16 datasets in total). CBF and ATT averages and standard deviations are converted into column charts respectively in (b) and (c) for convenient comparisons.