4880
Quantitative myocardial perfusion using whole-heart, 2D SMS and 3D sequences alternating every heartbeat1Utah Center for Advanced Imaging Research (UCAIR), University of Utah, Salt Lake City, UT, United States, 2Biomedical Engineering, University of Utah, Salt Lake City, UT, United States
Synopsis
A sequence with 2D simultaneous multi-slice (SMS) and 3D stack-of-stars (SoS) alternating each heartbeat sequence has been proposed previously1. Here, we increase the heart-coverage of the 2D SMS portion of the scan from 3 slices to 6 slices, to match the coverage of the 3D SoS method. Three minipigs and one healthy volunteer were studied using this method at both adenosine stress and rest cases, and the sequences gave flows with reasonable agreement.
Introduction
First-pass myocardial perfusion MRI has been widely used for diagnosis of coronary artery disease. Unlike qualitative assessment in myocardial perfusion images which is often limited by poor spatial resolution, artifacts and heart coverage, quantitative analysis may detect regional defects more accurately2. Previously, a sequence that alternates 2D SMS and 3D SoS sequences each heartbeat was proposed mainly to investigate the feasibility of every-other-beat acquisition1. To further investigate the benefits and tradeoffs between two different imaging methods in a single dose injection, here we created a sequence with 6 slice acquisitions each beat and performed studies with whole-heart coverage in minipigs and a human subject with this alternating method.In this work, 2D SMS acquisition used two slice groups of 3 slices each in an interleaved manner to cover the whole heart, so that alternating 2D SMS and 3D SoS data every heartbeat can offer the advantage of whole heart analysis, as opposed to previous works1.
Methods
Three minipigs and one healthy volunteer were imaged with 2D SMS and 3D SoS sequences alternating every heartbeat. Scans were done at both rest and stress with 0.05-0.075mmol/kg prohance for the minipigs and with 0.075mmol/kg gadovist for the volunteer. The 2D SMS acquisition had a single saturation pulse each beat and then a short 20msec recovery time before using radial RF-spoiled gradient echo readouts. Two slice groups, each with 3 slices (multi-band factor 3), were acquired to cover the heart. The first 24 rays were used to reconstruct images for the AIF. Retrospectively, rays for the reconstruction of the tissue curves were selected as those acquired around systole. TR/TE=2.2/1.0msec, ~1.8x1.8x7mm pixel size, flip angle 12°. The 3D SoS pulse sequence consisted of a 2D saturation recovery AIF acquisition followed by a ~200msec 3D SoS acquisition3. In each beat, the 2D AIF was acquired from 24 rays starting 20msec after a saturation pulse. Then another 120msec saturation pulse was performed and after recovery, the 3D readout started. TR/TE=1.8/0.8msec, ~1.8x1.8x7mm pixel size, flip angle 12°. The overall sequence design is shown in Figure 1(a).Both 2D SMS and 3D SoS datasets were reconstructed by a joint spatial and temporal constrained reconstruction (STCR) method. To compensate for respiratory motion, both rigid and deformable registration were applied. Rigid registration was performed on both PD images and perfusion images. Model-based deformable registration was then applied to perfusion images4. These registered images were then processed with a look-up-table based approach to convert signal intensity to gadolinium concentration curves, which were then fit to a Fermi model for the quantification. The processing pipeline is shown in Figure 1(b). In one minipig, microsphere flow results were obtained with a cryomicrotome approach5.
Results
Figure 2 shows the reconstructed images using this whole-heart coverage 2D/3D alternating each beat acquisition. The 2D SMS and 3D SoS images appear to match slice locations reasonably well. Table 1 shows myocardial blood flow (MBF) and myocardial perfusion reserve (MPR) from the minipigs. The mean MBF ranged from ~0.5-1.0 ml/g/min at rest, ~1.6-2.4 ml/g/min at stress, and the mean MPR ranged from ~2.5-3.8. The microsphere results corresponding to the third minipig listed in the table was 2.95 ml/g/min at stress and 1.08 ml/g/min at rest. Figure 3 shows Bland-Altman analysis of the 2D SMS and 3D SoS slice-wise flow comparison with R=0.96, y=1.05*x-0.07 and confidence interval (mean difference ± 1.96 standard deviation: [-0.41, 0.43]) in the minipigs. Figure 4 shows a 2D SMS and 3D SoS MBF comparison in the healthy volunteer study using a bulls-eye plot including both the rest and the stress perfusion results.Discussion
It is likely that the different contrast and artifacts that are possible with 2D SMS vs. 3D SoS methods could make it more robust to use the methods together rather than separately. More studies, especially in subjects with disease, are needed to evaluate the advantages and disadvantages of this unique quantitative alternating beat approach.Conclusion
A whole-heart coverage 2D/3D alternating each heartbeat acquisition can provide more comprehensive perfusion assessments by slice-wise comparisons. Reasonable quantitative agreements at both rest and stress shows this could be a promising approach to test for use in the diagnosis of cardiovascular disease.Acknowledgements
No acknowledgement found.References
1. Qi Huang YT, Jason Mendes, Ganesh Adluru, and Edward DiBella. Quantitative myocardial perfusion with an alternating radial 2D simultaneous multi-slice and 3D stack-of-stars sequence. Paper presented at: Proc Intern Soc Magn Reson Med(ISMRM); 2020.
2. Hsu LY, Jacobs M, Benovoy M, Ta AD, Conn HM, Winkler S, Greve AM, Chen MY, Shanbhag SM, Bandettini WP and Arai AE. Diagnostic Performance of Fully Automated Pixel-Wise Quantitative Myocardial Perfusion Imaging by Cardiovascular Magnetic Resonance. JACC Cardiovasc Imaging. 2018;11:697-707.
3. Mendes JK, Adluru G, Likhite D, Fair MJ, Gatehouse PD, Tian Y, Pedgaonkar A, Wilson B and DiBella EVR. Quantitative 3D myocardial perfusion with an efficient arterial input function. Magn Reson Med. 2020;83:1949-1963.
4. Adluru G, DiBella EVR and Schabel MC. Model-based registration for dynamic cardiac perfusion MRI. Journal of Magnetic Resonance Imaging. 2006;24:1062-1070.
5. Kelly, Jeffrey J., Jon R. Ewen, Susan L. Bernard, Robb W. Glenny, and Clyde H. Barlow. "Regional blood flow measurements from fluorescent microsphere images using an Imaging CryoMicrotome." Review of Scientific Instruments 71, no. 1 (2000): 228-234.
Figures
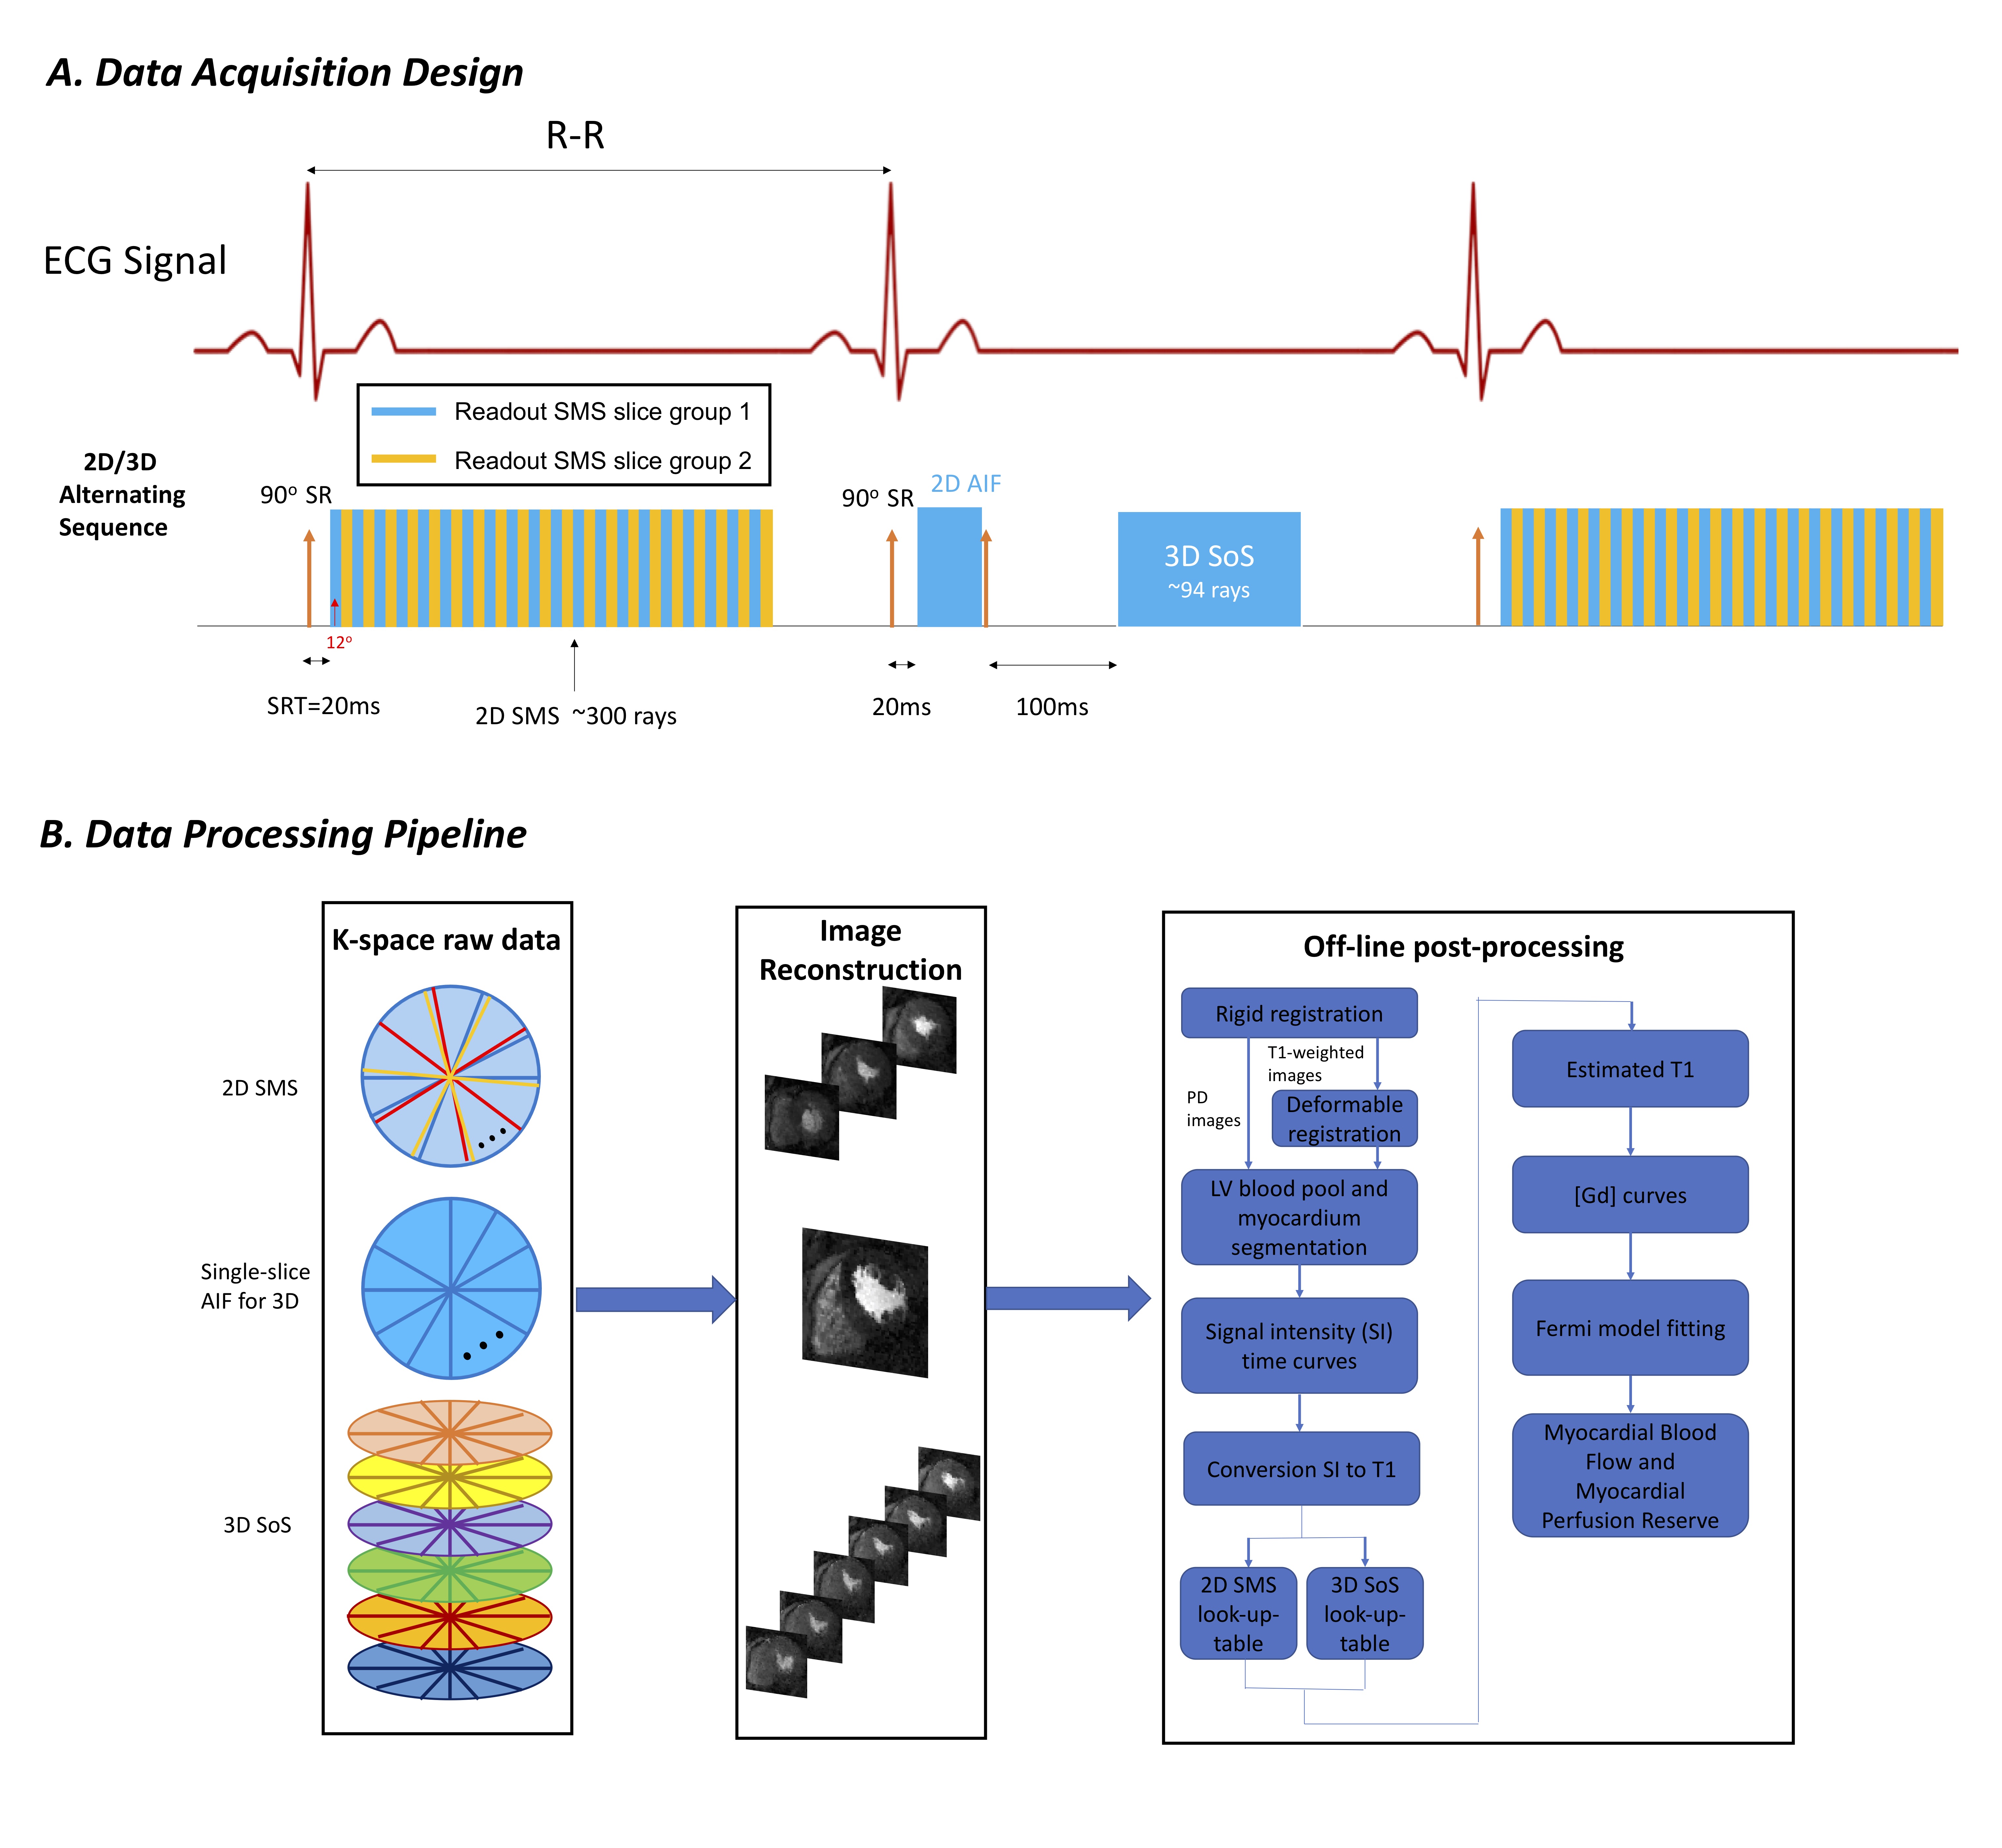
Figure 1. The whole-heart coverage 2D/3D alternating sequence design and data processing pipeline. The sequence (a) acquired two slice groups with multi band factor 3 for 2D SMS, and a 2D AIF together with 3D SoS, in an alternating manner. The raw k-space data from each readout was then reconstructed and post-processed as in (b).
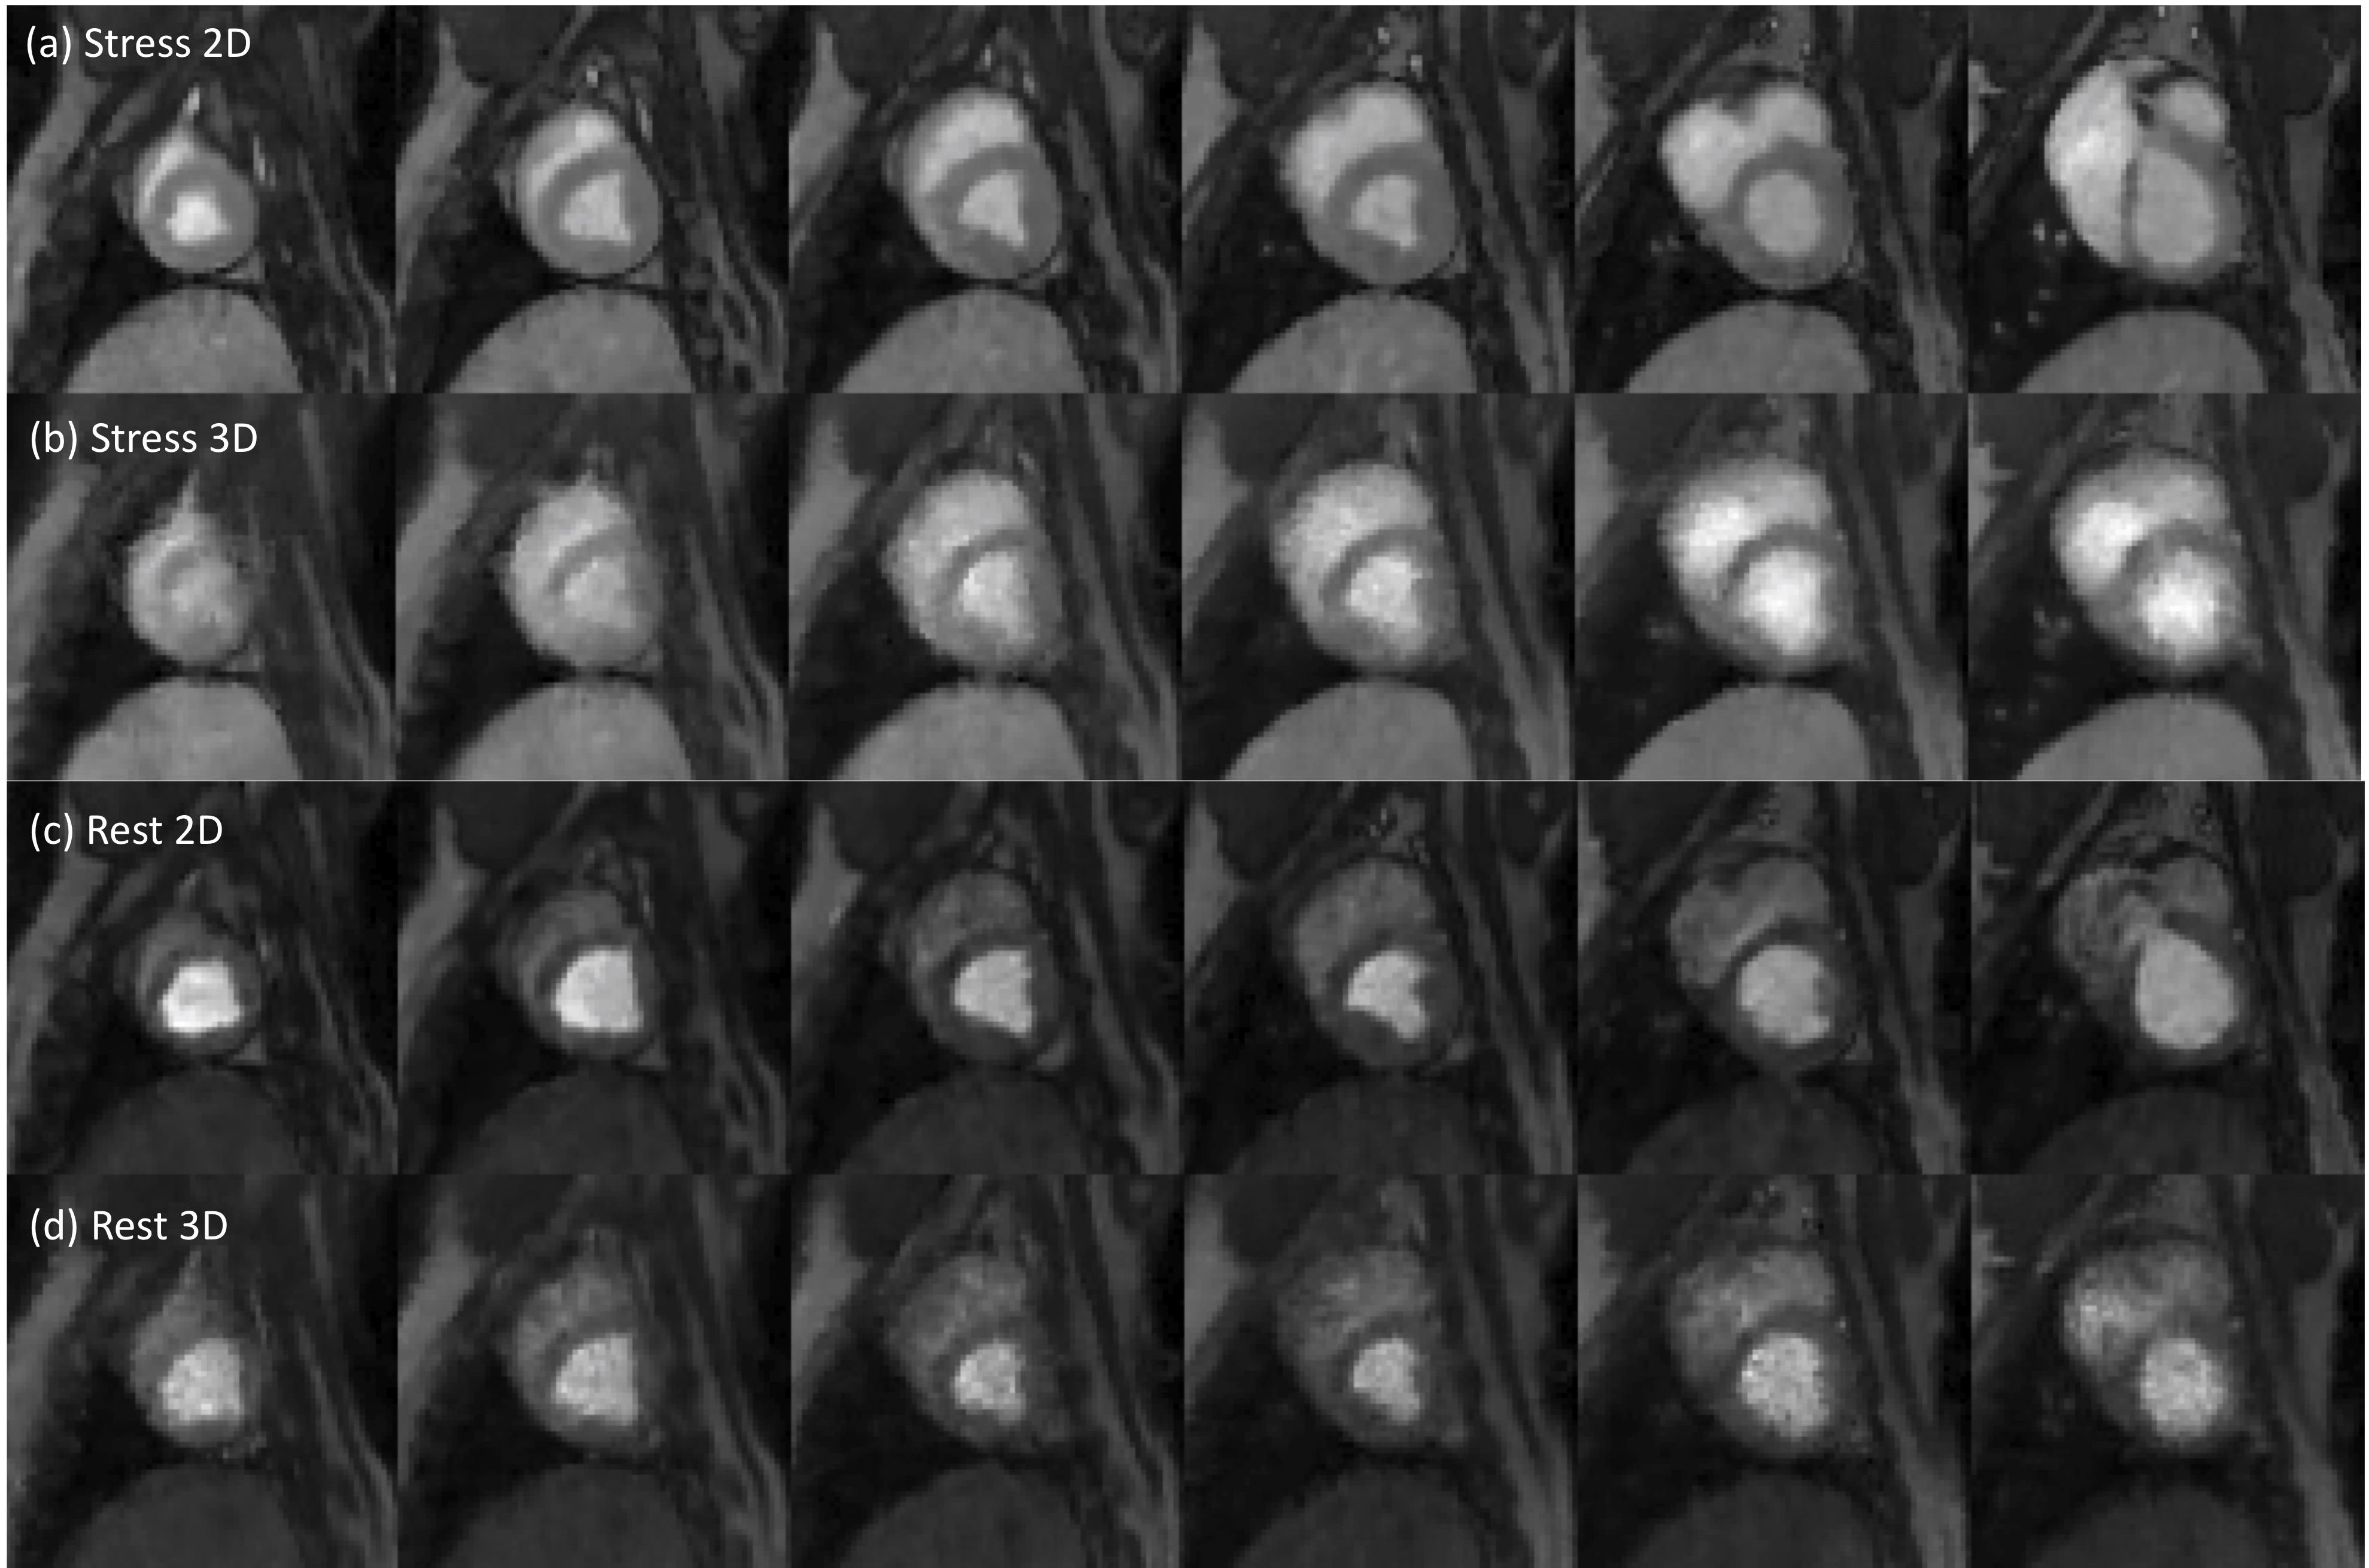
Figure 2. One time frame of the enhanced dynamic images from whole-heart coverage 2D/3D alternating every-beat acquisition. The images shown were at stress ((a),(b)) and at rest ((c),(d)). From left to right, the 2D SMS and 3D SoS images share a similar field of view, indicating a close slice-by-slice match.
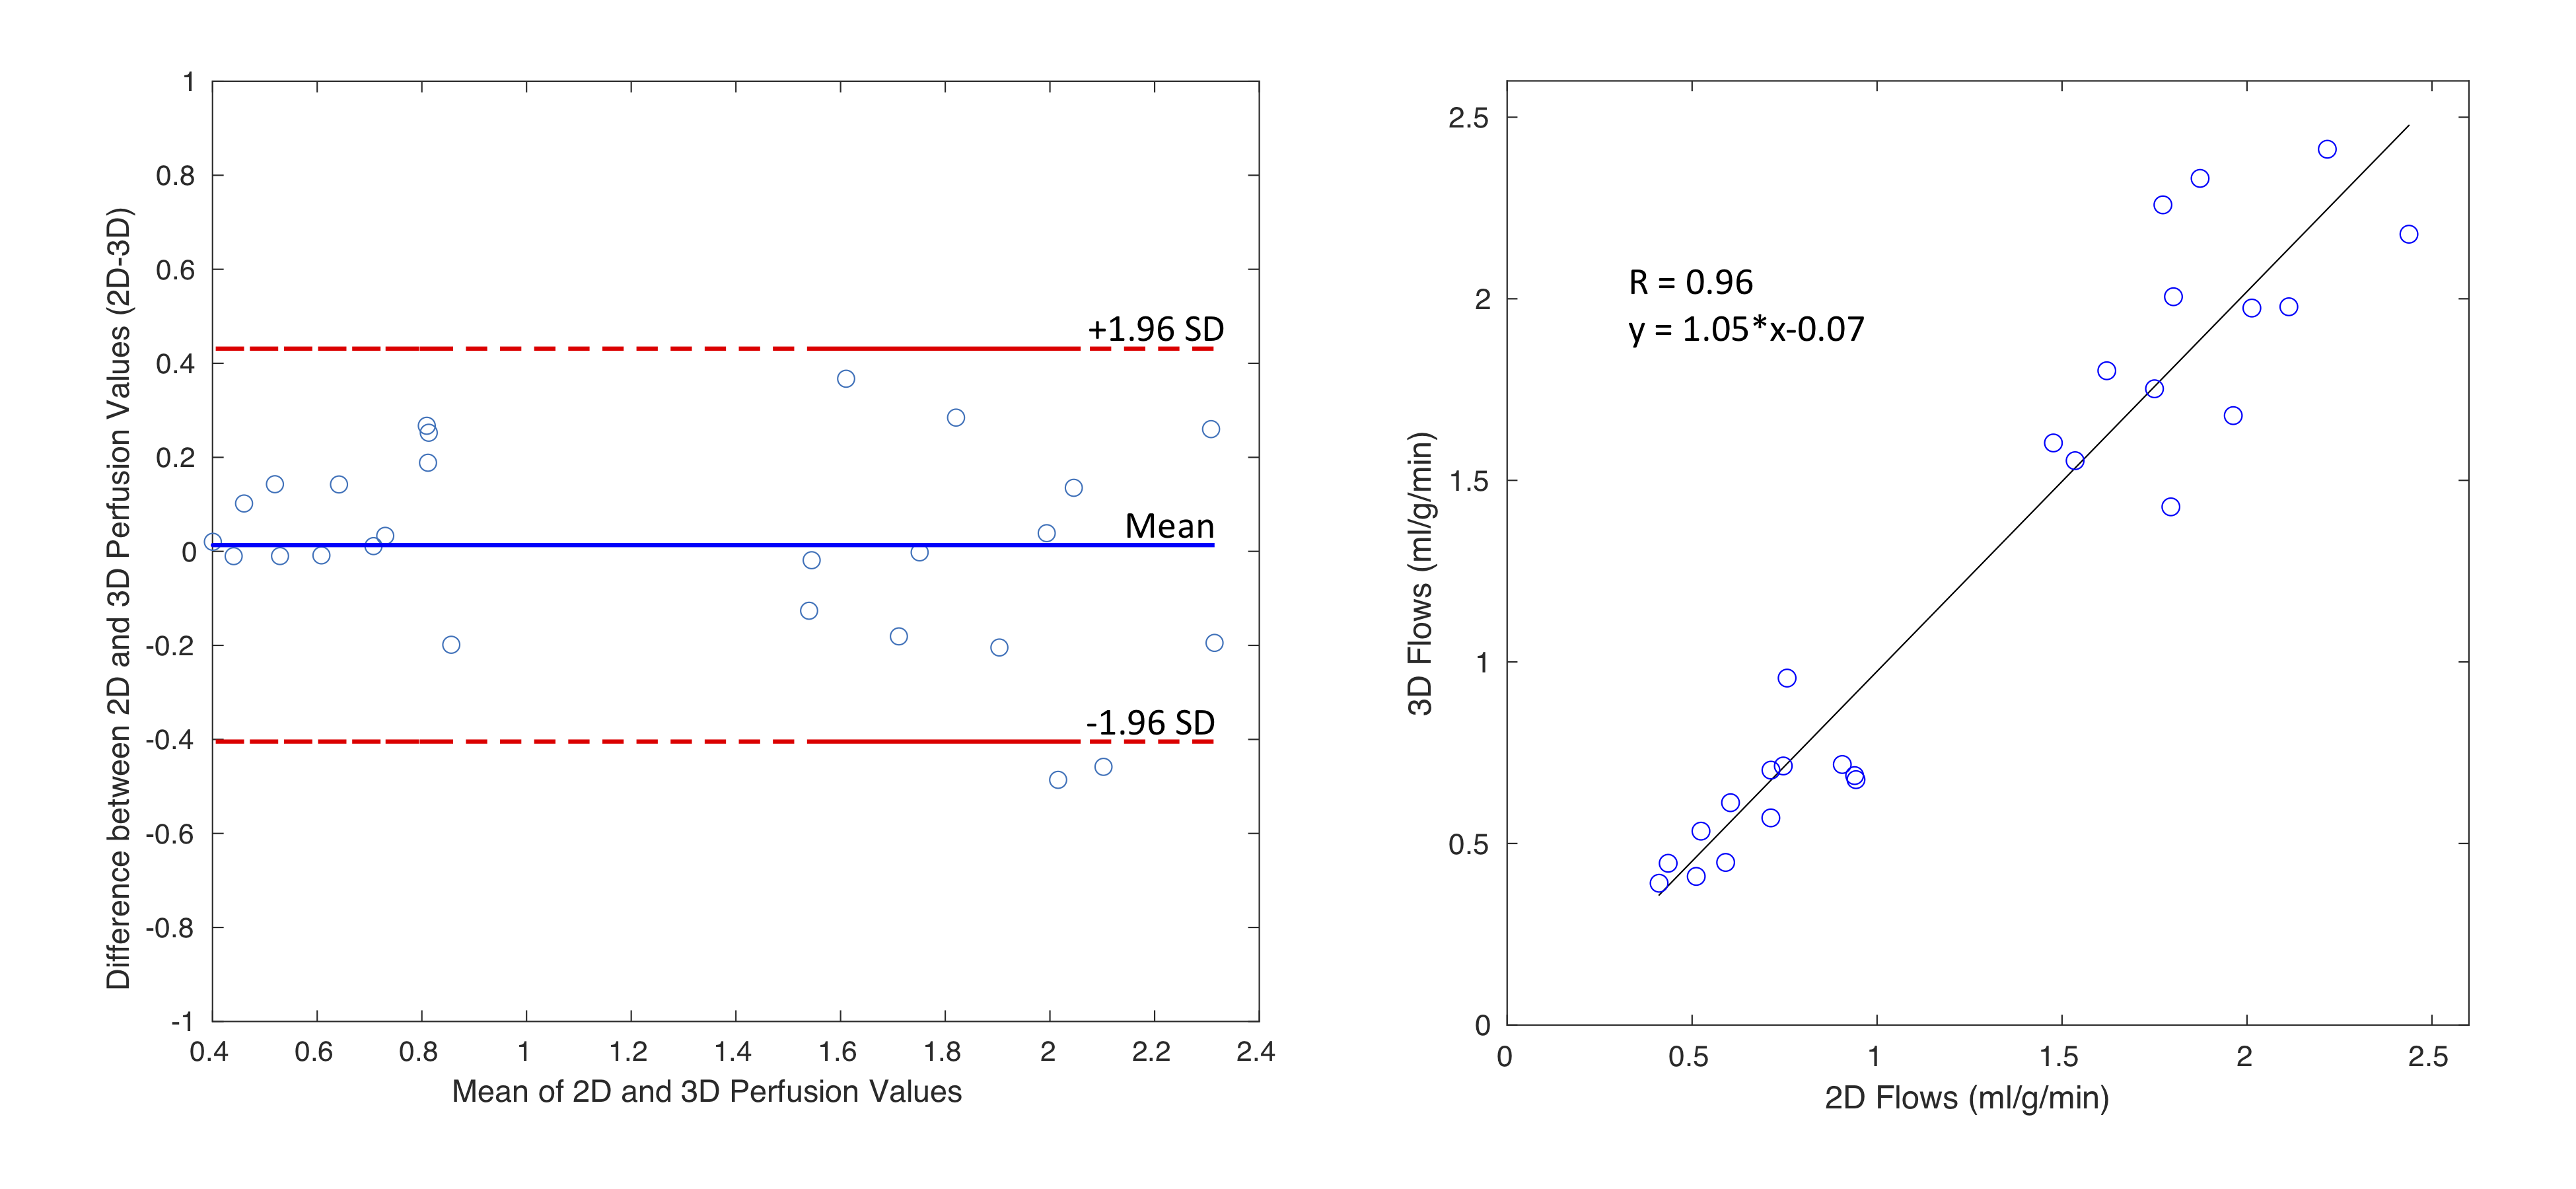
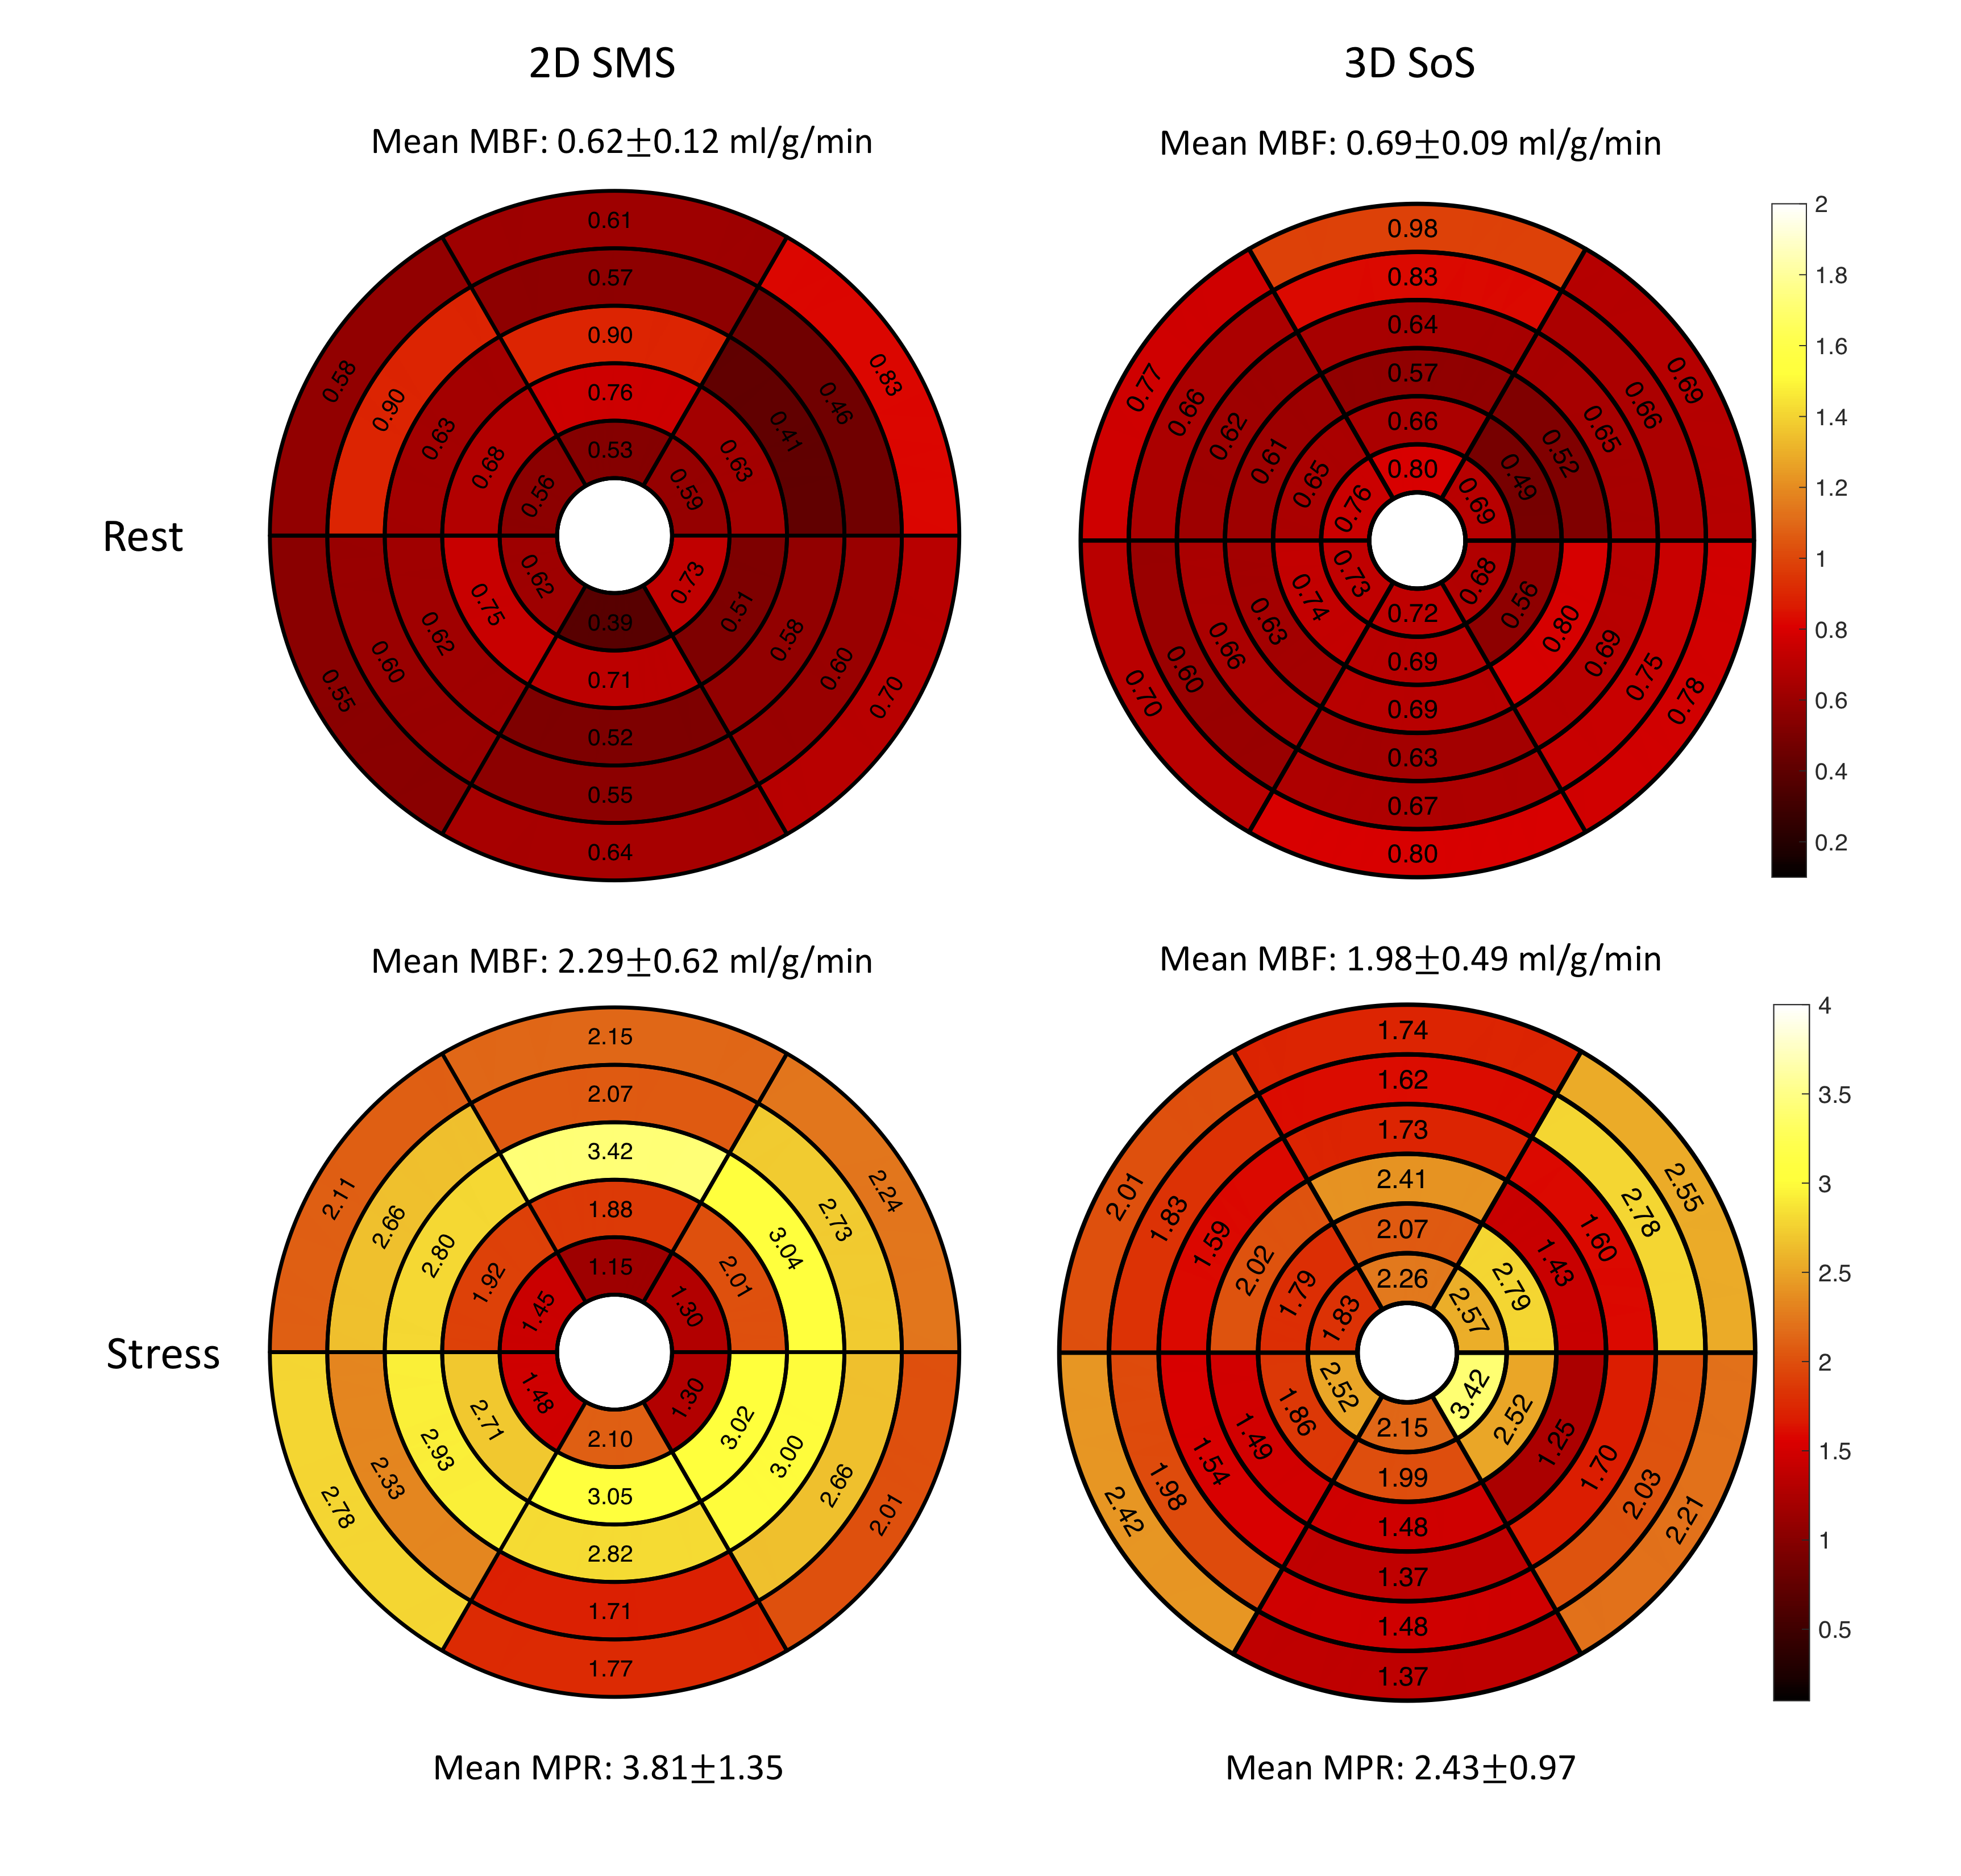
Figure 4. The comparison of 2D SMS and 3D SoS MBF in a healthy volunteer study. Average MBF values for the rest were 0.62±0.12 ml/g/min in 2D SMS and 0.69±0.09 ml/g/min, while average MBF values for the adenosine stress were 2.29±0.62 ml/g/min in 2D SMS and 1.98±0.49 ml/g/min. The region-wise variations of this subject, mainly in stress, caused the difference in MPR between two methods.
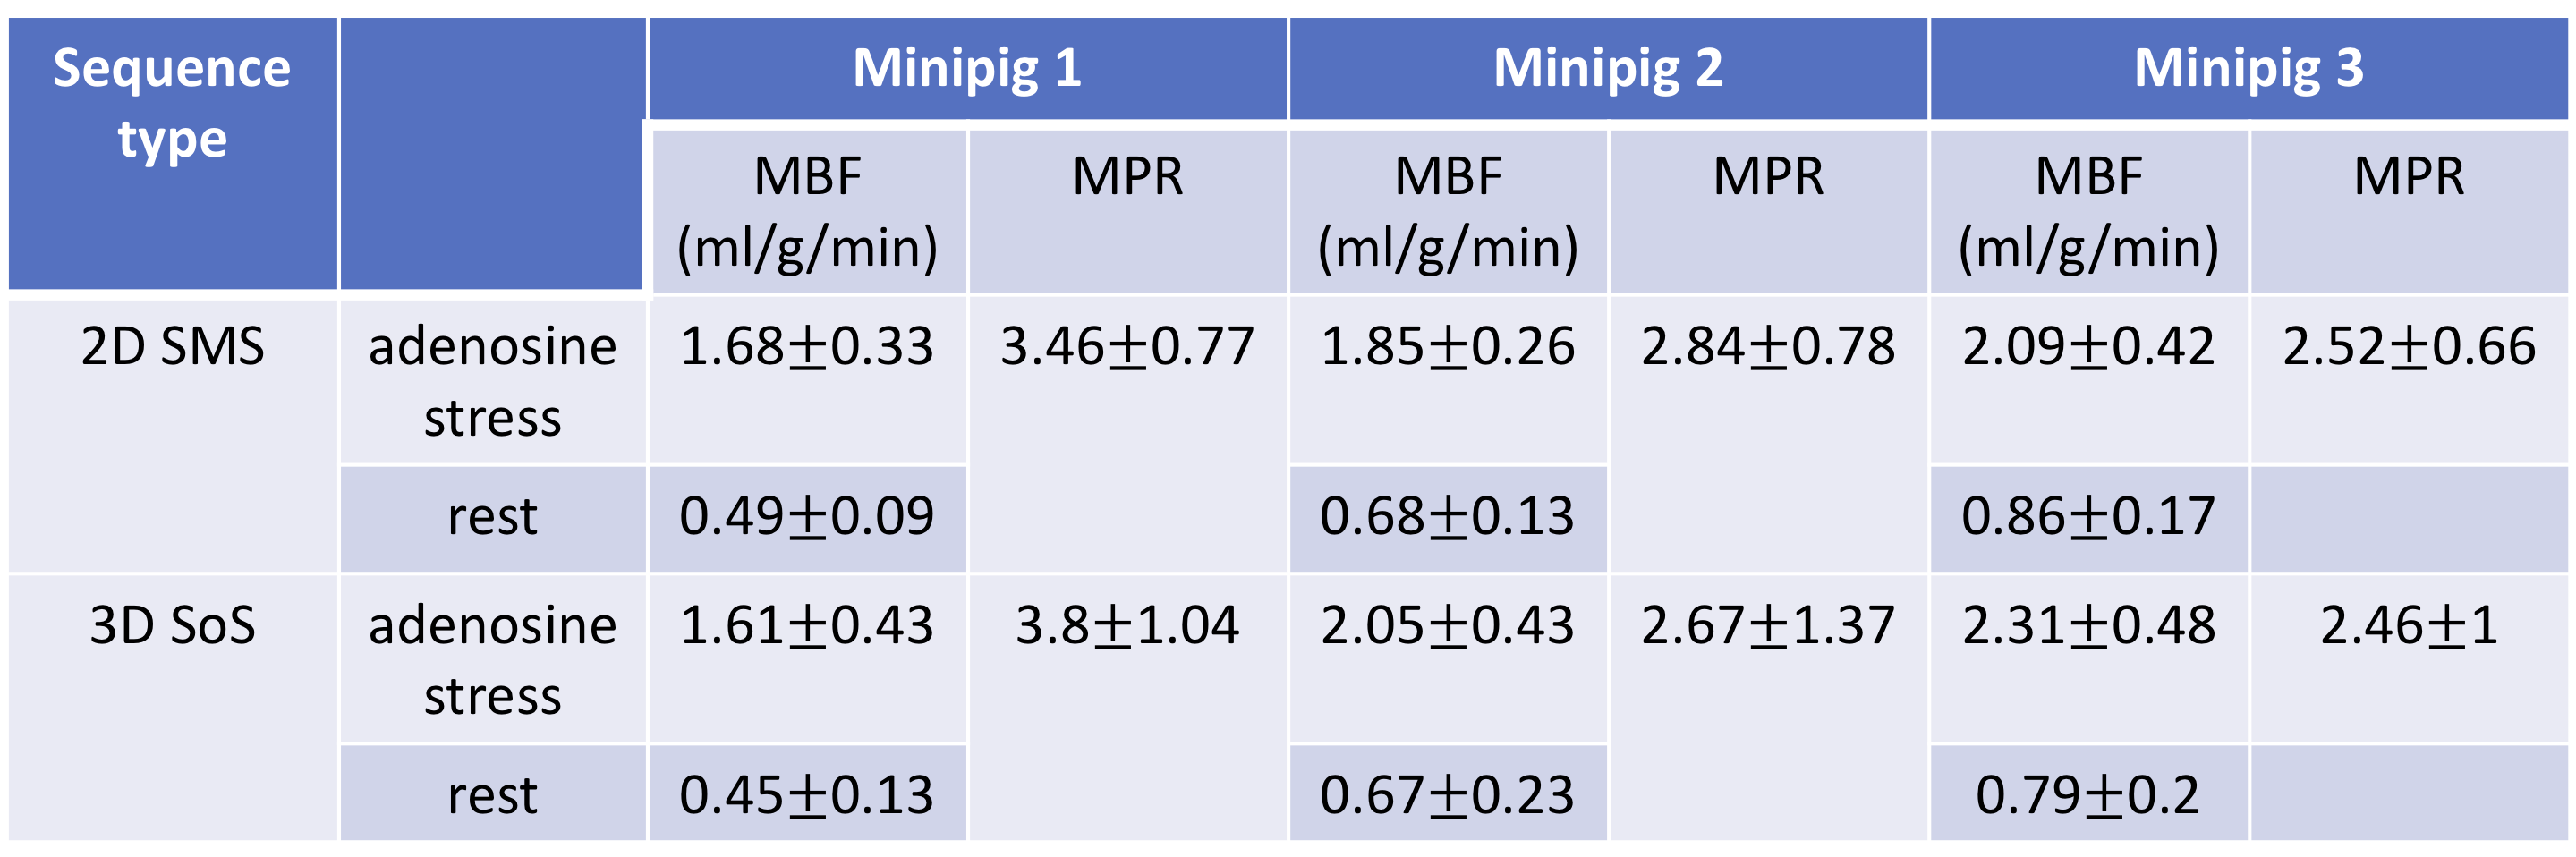
Table 1. Average MBF and MPR estimations of all slices and regions within a slice from 3 minipigs. The mean MBF ranged from ~0.5-1.0 ml/g/min for the rest, ~1.6-2.4 ml/g/min for the stress, and the mean MPR ranged from ~2.5-3.8.