4879
Improving Spatial Resolution of Brain and Renal ASL MR Images using 3D Cartesian TSE and Compressed SENSE Reconstruction1Department of Radiology, UT Southwestern Medical Center, Dallas, TX, United States, 2Advanced Imaging Research Center, UT Southwestern Medical Center, Dallas, TX, United States, 3Department of Urology, UT Southwestern Medical Center, Dallas, TX, United States
Synopsis
Arterial spin labeled (ASL) MRI is often acquired at reduced spatial resolution due to lower signal to noise (SNR), although higher spatial resolution within clinically feasible scan times is desired. In this study, we applied Compressed Sensing–Sensitivity Encoding (CS-SENSE) to 3D Cartesian TSE with Variable Density (VD) sampling to achieve higher spatial resolution ASL-MRI without prolonging acquisition time. Perfusion images acquired with CS-SENSE showed good SNR and image quality in both brains and kidneys, without introducing bias to perfusion quantification. This may be particularly useful to measure perfusion changes in small-sized lesions in both brains and kidneys.
Introduction
Arterial spin labeled (ASL) MRI is often acquired at reduced spatial resolution due to lower signal to noise (SNR), although higher spatial resolution within clinically feasible scan times is desired. 3D Cartesian turbo spin echo (TSE) has become a promising acquisition method for ASL-MRI in both brain and kidneys.[1-3] 3D Cartesian TSE with Variable Density (VD) sampling acquires the center of k-space with increased number of averages and improves SNR and robustness compared to single-average TSE acquisitions.[4][5] Furthermore, Cartesian TSE sampling can be readily combined with novel accelerated imaging techniques such as Compressed Sensing–Sensitivity Encoding (CS-SENSE).[6] The purpose of this study was to apply CS-SENSE to 3D Cartesian TSE to achieve higher spatial resolution ASL-MRI without prolonging the acquisition time.Methods
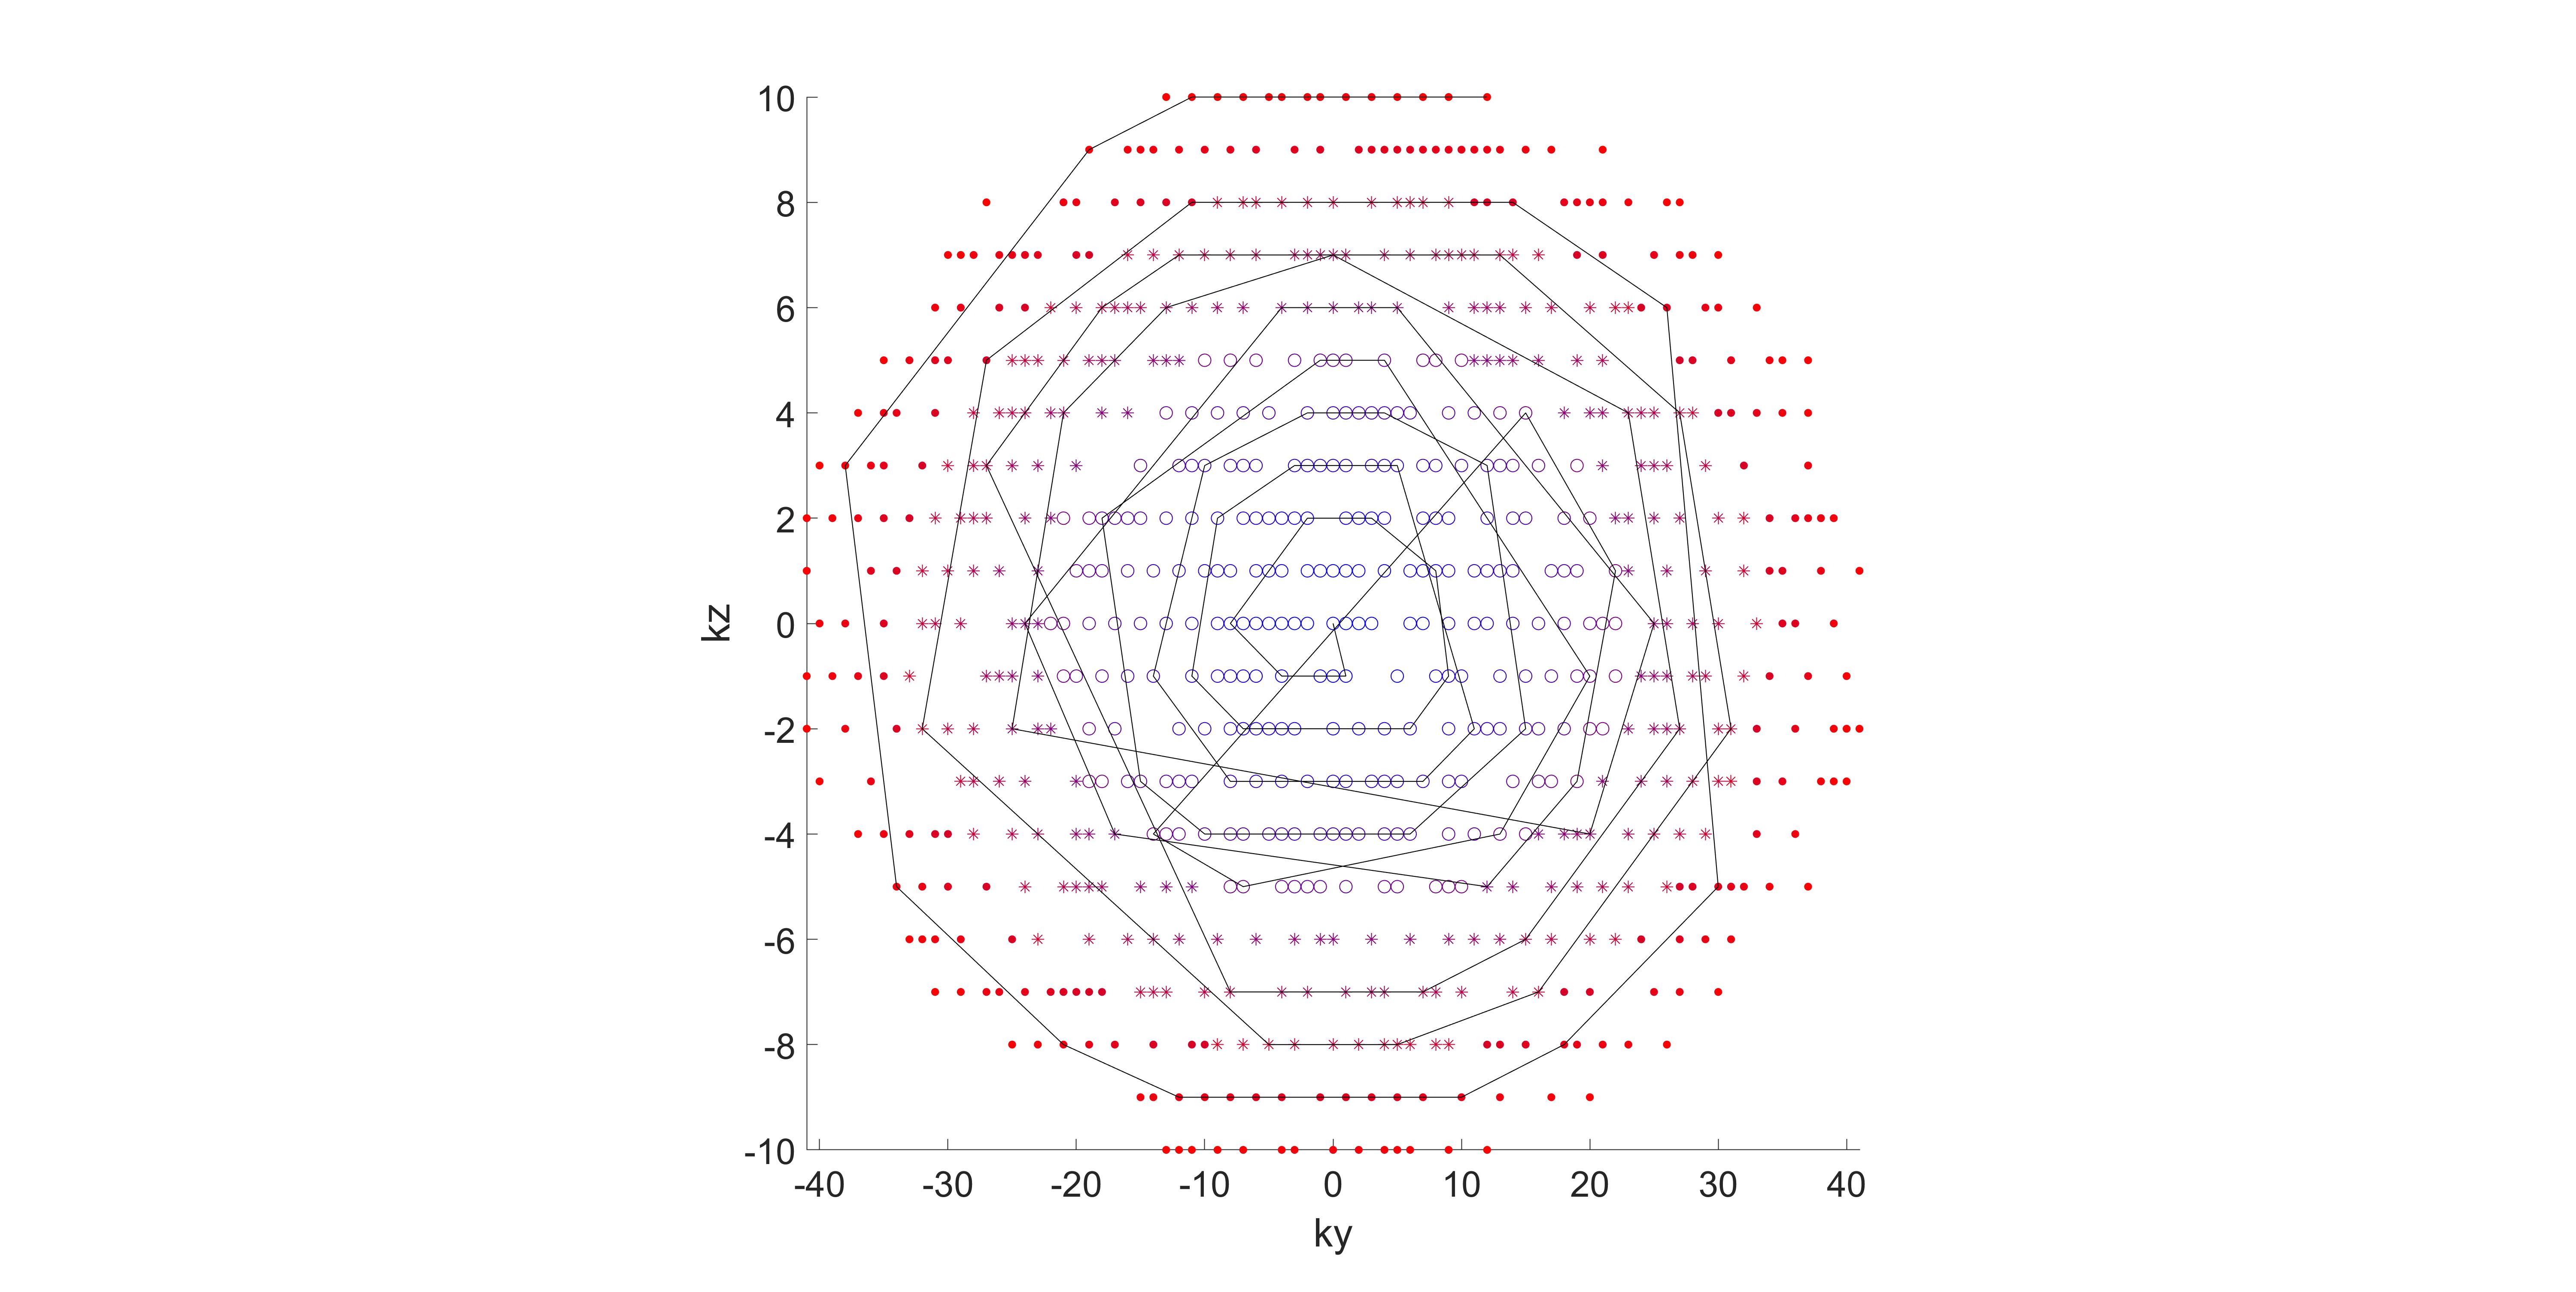
Pseudo-continuous ASL (pCASL) with optimized background suppression (BGS) was used for both brain and kidney perfusion imaging on a 3T Philips Ingenia scanner under IRB approval. For kidney imaging, an unbalanced pCASL labelling scheme with numerically optimized gradients (Gmax= 3.5 mT/m, Gave = 0.5 mT/m) was used to improve labelling robustness. 3D TSE Cartesian acquisition with Spiral Profile Reordering and Variable Density Sampling (VD-CASPR) was used, which defines 3 regions in the ky-kz space with increasing distances from the center of the k-space. Region 1 (R1) is an elliptical region in the center, surrounded by annular regions 2 (R2) and 3 (R3), with profiles in regions 1, 2 and 3 acquired using 3, 2 and 1 NSAs respectively. CS-SENSE, which randomly undersamples the k-space, was applied to VD-CASPR acquisition (Figure 1). Proton-density weighted (M0) images was acquired with partial k-space. [4][5]Brain Imaging: Four healthy volunteers were scanned in an axial orientation for brain imaging. The parameters were: TR/TE = 6000/14 ms, FOV = 220x220x110 mm3, matrix = 88x88 with 36 slices, acquired resolution = 2.5x2.5x6 mm3, reconstructed resolution = 1.5x1.5x3 mm3, ETL = 80, echo spacing = 2.8 ms, label duration = 1.8 s, post-label delay = 1.8 s, and 4 BGS pulses. Two CS-SENSE acquisitions with 2-fold-acceleration were performed with number of profiles in R1 and R2 set to (i) 160 (2×ETL) in 3:24 min; and (ii) 240 (3×ETL) profiles in 4:00 min. An additional acquisition using same parameters but without acceleration and 160 (2×ETL) profiles in R1 and R2 was performed in 5:12 min. M0 images were acquired with same parameters and a single-average CASPR using 1/3rd of the k-space acquired in the center, in 20 s with 2-fold-accelerated CS-SENSE and 40 s with no acceleration.
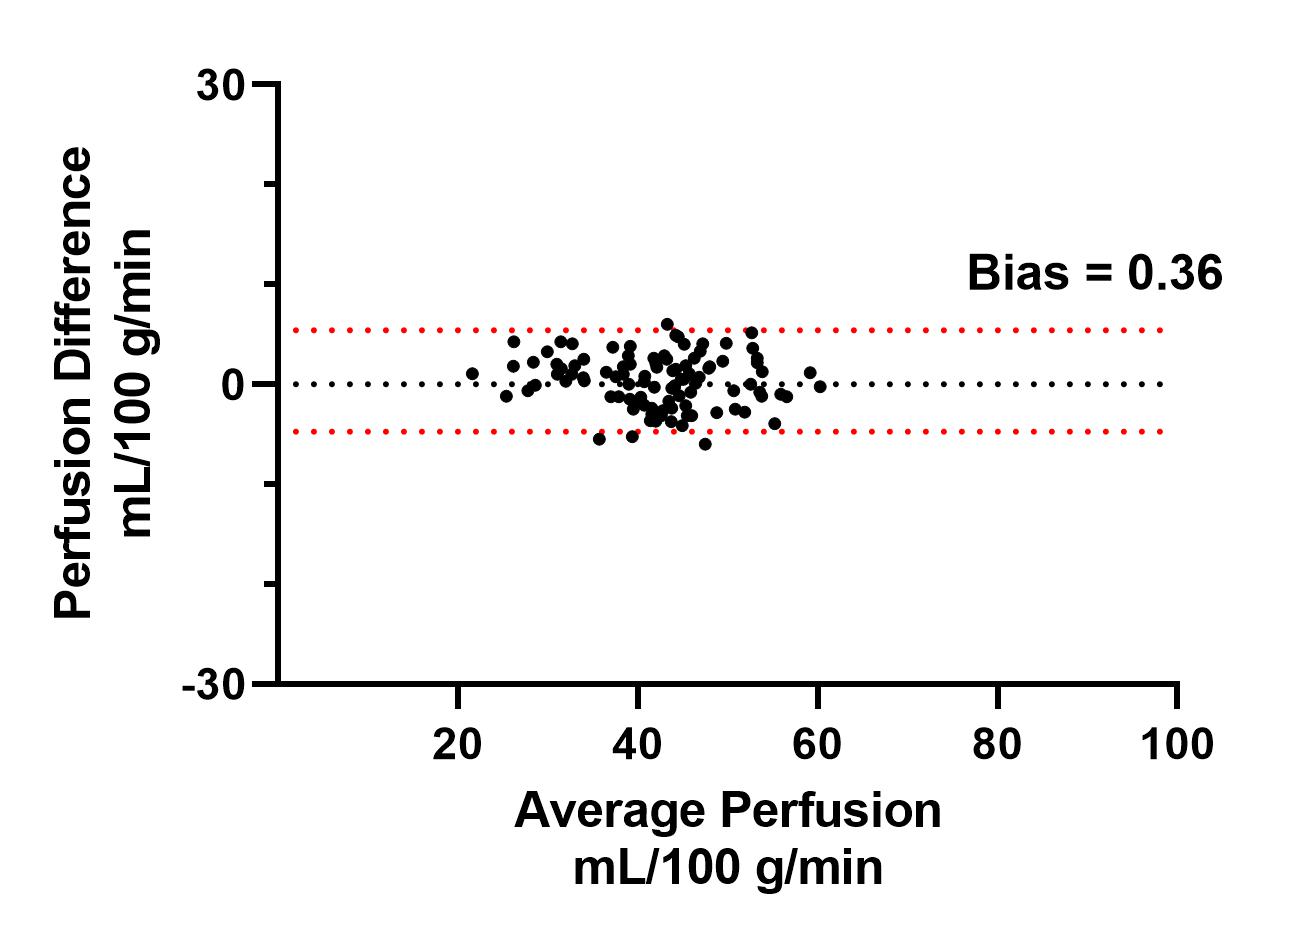
Kidney Imaging: Five healthy volunteers were scanned for kidney imaging in an axial orientation. Parameters were: TR/TE = 6500/14 ms, FOV = 200x300x80 mm3, matrix = 80x121 with 26 slices, acquired resolution = 2.5x2.5x6 mm3, reconstructed resolution = 1.7x1.7x3 mm3, ETL = 120, echo spacing = 2.8 ms, 2-fold acceleration for CS-SENSE, with 360 (3×ETL) profiles in R1 and R2, label duration = 1.5 s, post-label delay = 1.5 s, 4 BGS pulses, and acquisition time = 4:46 min. For comparison, an additional sequence with no acceleration was acquired at a reduced resolution of 3x3x6 mm3, with 240 profiles (2×ETL) in R1 and R2, in 5:00 min. M0 images were acquired using 1/3rd of central k-space in 28 s with CS-SENSE (resolution 2.5x2.5x6 mm3) and in 37 s (resolution 3x3x6 mm3) with no acceleration. In 2 brain volunteers, ROIs were drawn on different regions of gray matter on their CBF maps. The agreement between the quantified mean CBF values in these ROIs was compared using Bland-Altman analysis, between VD-CASPR with 2-fold-accelerated CS-SENSE, and with no acceleration, both using M0 with 1/3rd acquired k-space.
Results
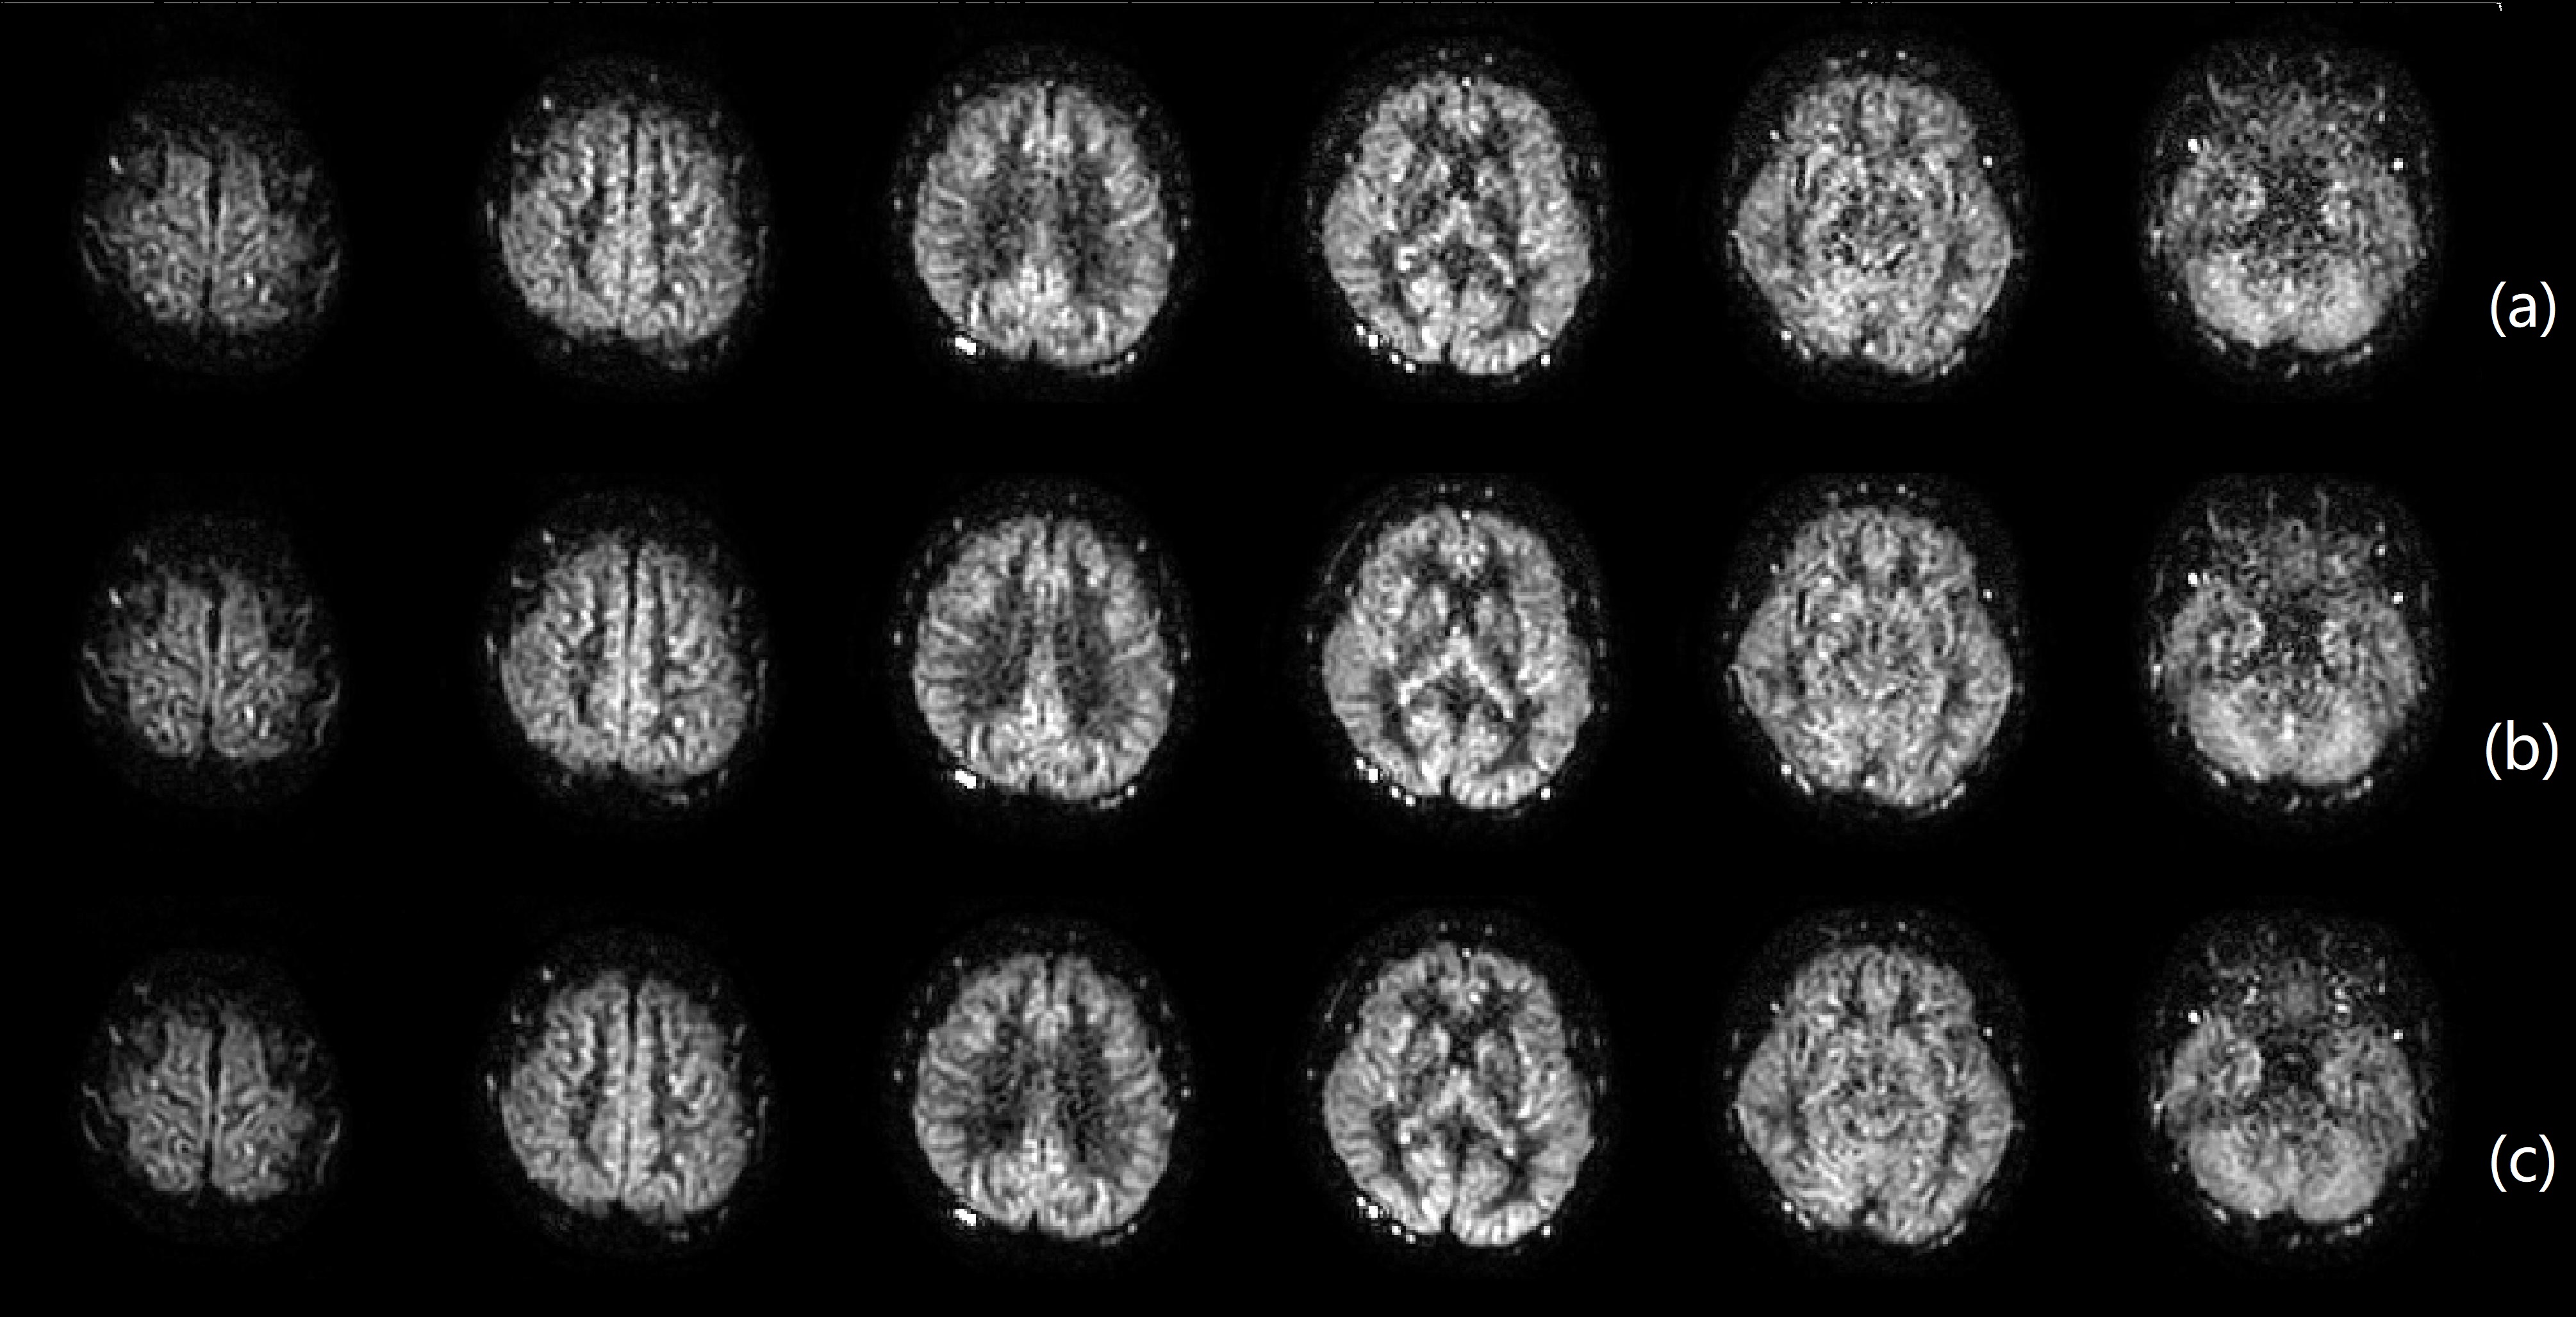
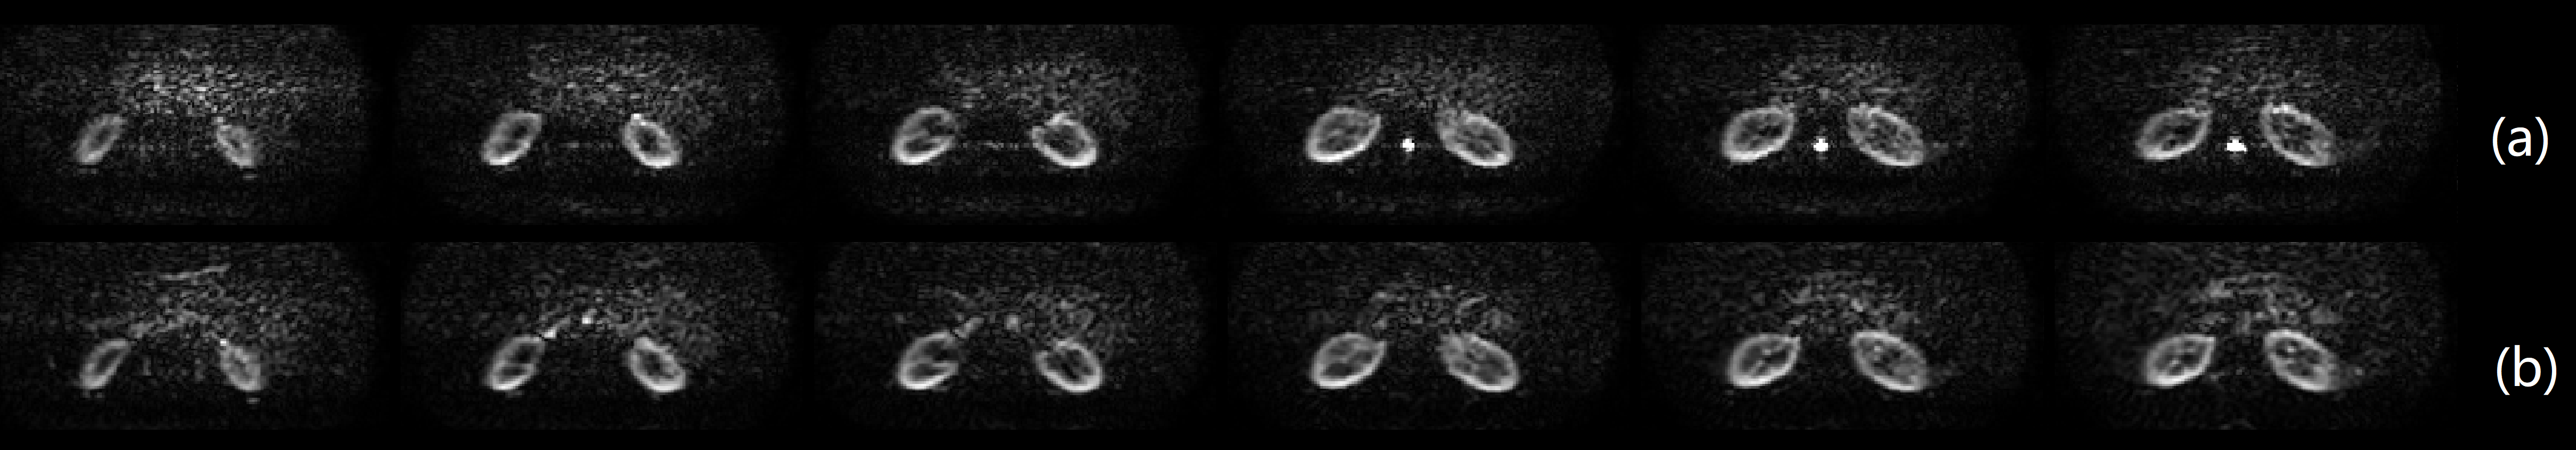
Brain perfusion weighted images at a higher spatial resolution of 2.5x2.5x6 mm3 acquired with VD-CASPR and CS-SENSE showed good SNR (Figure 2a). The higher number of profiles in R1 and R2 (240 vs. 160) achieved enhanced SNR and reduced artifacts, albeit at slightly longer scan time (Figure 2b). The image quality was comparable to images without acceleration and slightly lower spatial resolution (Figure 2c). Higher spatial resolution (2.5x2.5x6 mm3) kidney perfusion weighted images with CS-SENSE also showed good SNR and better image sharpness compared to images acquired at lower resolution (3x3x6 mm3) without acceleration (Figure 3). The CBF values measured in brain gray matter ROIs showed good agreement, between VD-CASPR with 2-fold-accelerated CS-SENSE, and with no acceleration (Figure 4).Discussion and Conclusion
We applied CS-SENSE to VD-CAPSR to achieve higher spatial resolution ASL MRI without prolonging the scan time. Perfusion images acquired with CS-SENSE showed good SNR and image quality in both brains and kidneys, without introducing bias to perfusion quantification. The combination of VD-CASPR and CS-SENSE may be particularly useful to measure perfusion changes in small-sized lesions in both brains and kidneys, such as small renal masses.Acknowledgements
NIH/NCI U01CA207091References
[1] Robson PM, Madhuranthakam AJ, Smith MP, Sun MR, Dai W, Rofsky NM, Pedrosa I, Alsop DC. Volumetric Arterial Spin-labeled Perfusion Imaging of the Kidneys with a Three-dimensional Fast Spin Echo Acquisition. Acad Radiol. 2016 Feb;23(2):144-54. doi: 10.1016/j.acra.2015.09.013. Epub 2015 Oct 29. PMID: 26521186; PMCID: PMC4715920.
[2] Taso M, Zhao L, Guidon A, Litwiller DV, Alsop DC. Volumetric abdominal perfusion measurement using a pseudo-randomly sampled 3D fast-spin-echo (FSE) arterial spin labeling (ASL) sequence and compressed sensing reconstruction. Magn Reson Med. 2019 Aug;82(2):680-692. doi: 10.1002/mrm.27761. Epub 2019 Apr 5. PMID: 30953396.
[3] Greer JS, Wang X, Wang Y, Pinho MC, Maldjian JA, Pedrosa I, Madhuranthakam AJ. Robust pCASL perfusion imaging using a 3D Cartesian acquisition with spiral profile reordering (CASPR). Magn Reson Med. 2019 Nov;82(5):1713-1724. doi: 10.1002/mrm.27862. Epub 2019 Jun 23. PMID: 31231894; PMCID: PMC6743738.
[4] WangY, Zhou L, Greer JS, Pinho MC, Maldjian JA, Madhuranthakam AJ. Variable Density Sampling of 3D TSE Cartesian Acquisition for Improved Robustness and SNR of ASL-MRI. ISMRM 2020; 3281.
[5] Wang Y, Zhou L, Pedrosa I, Madhuranthakam AJ. Volumetric Renal ASL MRI using 3D TSE Cartesian Acquisition with Variable Density Sampling (VD-CASPR). ISMRM 2021: 0426.
[6] Vranic JE, Cross NM, Wang Y, Hippe DS, de Weerdt E, Mossa-Basha M. Compressed Sensing-Sensitivity Encoding (CS-SENSE) Accelerated Brain Imaging: Reduced Scan Time without Reduced Image Quality. AJNR Am J Neuroradiol. 2019 Jan;40(1):92-98. doi: 10.3174/ajnr.A5905. Epub 2018 Dec 6. PMID: 30523142; PMCID: PMC7048595.
Figures