4878
Volumetric Renal Perfusion Imaging with pCASL – Comparison of 3D TSE and 3D GraSE Readout1Radiology, University of Texas Southwestern Medical Center, DALLAS, TX, United States, 2Advanced Imaging Research Center, University of Texas Southwestern Medical Center, DALLAS, TX, United States
Synopsis
Recent consensus recommended SE-EPI as the preferred readout for 2D single-slice renal perfusion imaging using pCASL. Compared to single-slice 2D acquisition, 3D acquisitions can achieve higher SNR, larger slice coverage, and optimal background suppression in similar scan times. In this study, we compared 3D GRASE, the recommended 3D readout for brain perfusion imaging, with an optimized 3D TSE readout using Cartesian acquisition with spiral profile reordering and Variable Density Sampling (VD-CASPR) in 4 healthy volunteers for volumetric renal perfusion imaging. Results showed that 3D pCASL with TSE VD-CASPR is more robust and has higher SNR than 3D pCASL with GRASE.
Introduction
Recent consensus has identified pseudo-continuous arterial spin labeling (pCASL) as one of the ASL methods for renal perfusion imaging (1). It also recommended SE-EPI as the preferred readout for 2D single-slice acquisition with bSSFP and single shot TSE as adequate alternatives. Compared to single-slice 2D acquisition, 3D acquisitions can achieve higher SNR, larger slice coverage, and optimal background suppression in similar scan times. However, optimal readout schemes for volumetric renal perfusion imaging are yet to be established. Among 3D readouts, GRASE is the recommended Cartesian readout scheme for pCASL in brain applications (2). Our previous work has shown that 3D TSE using Cartesian acquisition with spiral profile reordering (CASPR) is more robust than 3D GRASE in areas with increased B0 inhomogeneities such as brains of glioblastoma patients (3). Additionally, we have shown that CASPR with Variable Density Sampling (VD-CASPR) that acquires the center of k-space with multiple signal averages (NSAs) further minimizes noise and improves SNR of renal ASL images (4). Therefore, the purpose of this work is to compare 3D TSE VD-CASPR and GRASE readouts with pCASL labeling to establish optimal 3D readout schemes for volumetric renal perfusion images.Methods
Subjects: The study was performed in 4 healthy volunteers (mean age, 24.5 ± 2.7 years) with IRB approval using a 3T MRI scanner (Ingenia, Philips Healthcare).Image Acquisition and Analysis: Unbalanced pCASL (ubpCASL) was performed with selective radiofrequency (RF) pulses (duration=600 μs, interval=1200 μs, B1average=1.5 μT), corresponding gradients (Gaverage=0.5 mT/m, Gmax/Gaverage =7), 4 optimized background suppression (BGS) pulses, label duration = 1.5 s, post-label delay = 1.5 s, FOV = 223x340x72 mm3, matrix = 76x113 with 24 slices, acquired resolution = 3x3x6 mm3 in coronal and/or axial orientation. VD-CASPR defines 3 regions in the ky-kz space with their increasing distances from the center of the k-space. Region 1 (R1) is an elliptical region in the center, surrounded by annular regions 2 (R2) and 3 (R3), with profiles in regions 1, 2 and 3 acquired using 3, 2 and 1 NSAs respectively (3). Imaging parameters for 3D TSE VD-CASPR were: TR/TE = 6500/14 ms, ETL = 120, echo spacing = 2.8 ms, shot duration = 347 ms, # of profiles in regions 1 & 2 = 2×ETL, and acquisition time = 4:59 minutes; for 3D GRASE acquisition were: TR/TE = 6500/21 ms, ETL = 120, EPI factor = 5, echo spacing = 6.9 ms, shot duration = 166 ms and acquisition time = 5:25 minutes for 1 average. M0 images were acquired with 1/3 acquired k-space (37 s for VD-CASPR) and fully acquired k-space (2:43 mins for GRASE) respectively. Images were reconstructed on the scanner including complex k-space subtraction. Renal blood flow (RBF) maps were generated in MATLAB based on the ASL consensus paper with labeling efficiency set as 0.69.
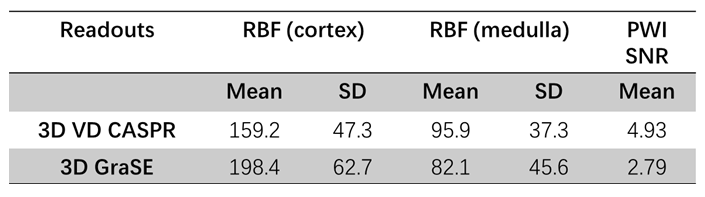
3D volumetric cortex and medulla regions of interest (ROIs) were drawn using 3D Slicer (https://www.slicer.org/). Several quantitative metrics were computed to assess the quality of perfusion data for each readout scheme and included the RBF values form cortex and medulla, perfusion-weighted image (PWI) SNR, defined as the mean PW signal divided by the standard deviation in the background noise.
Results
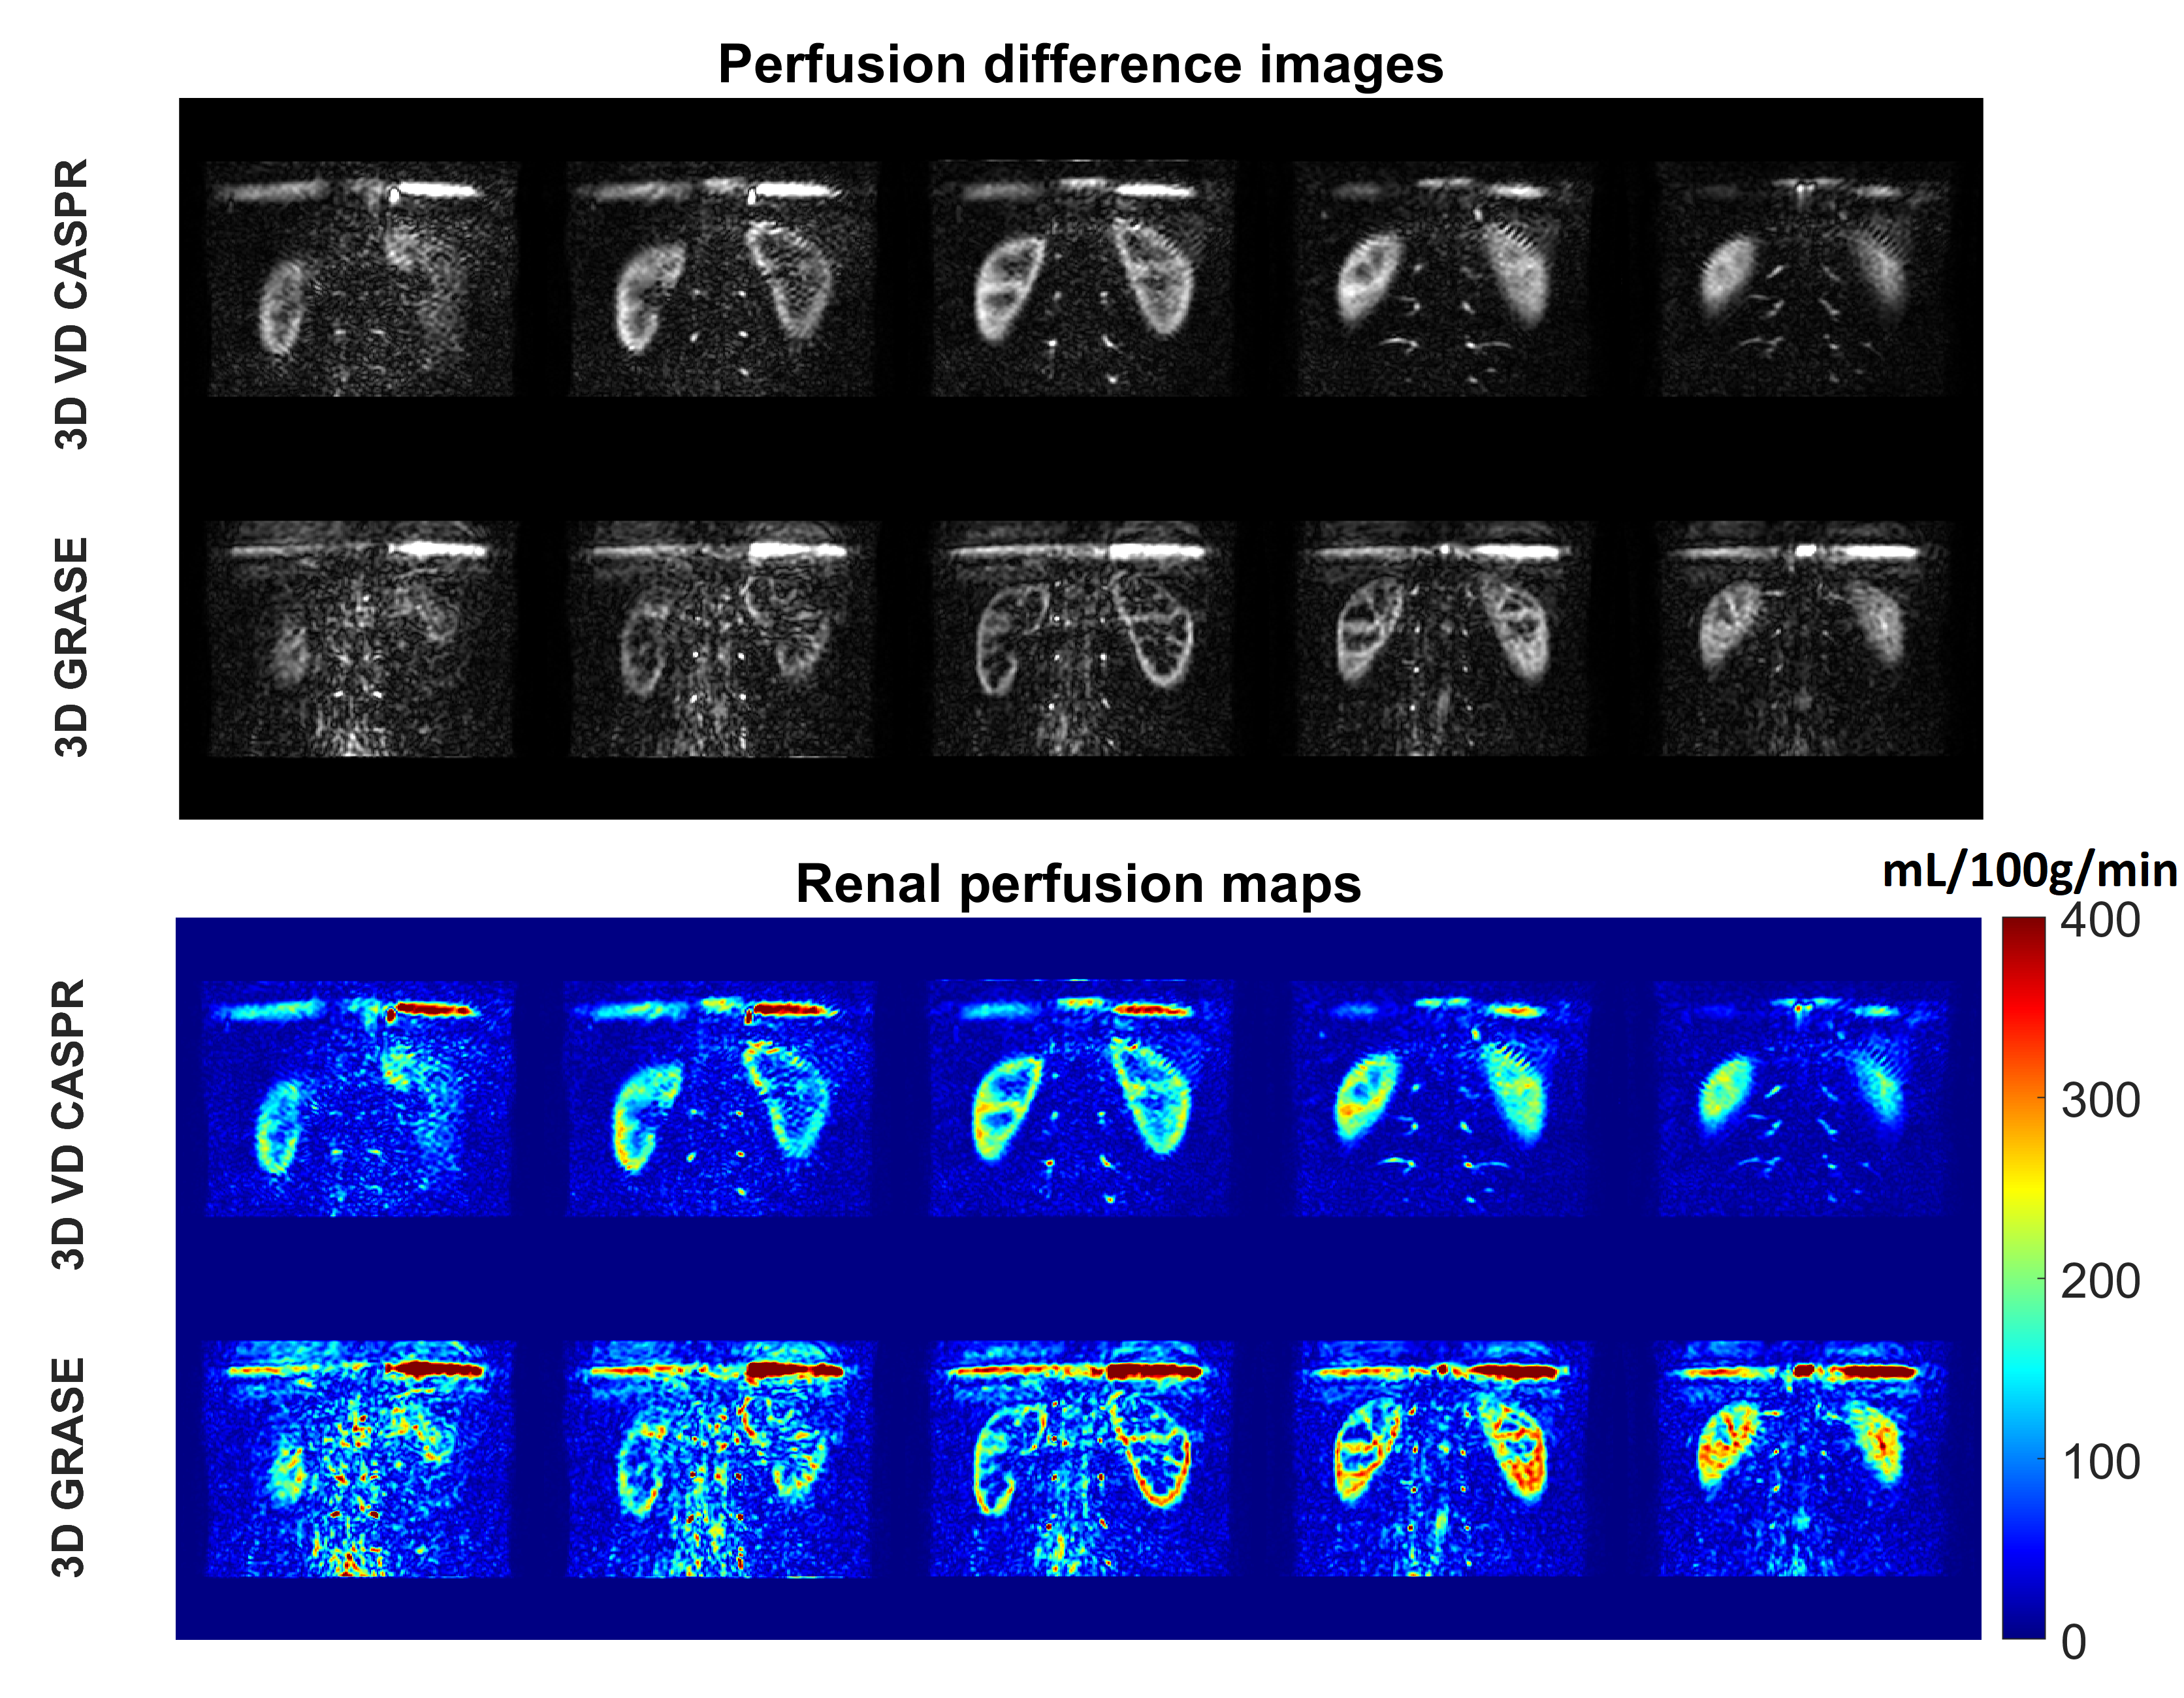
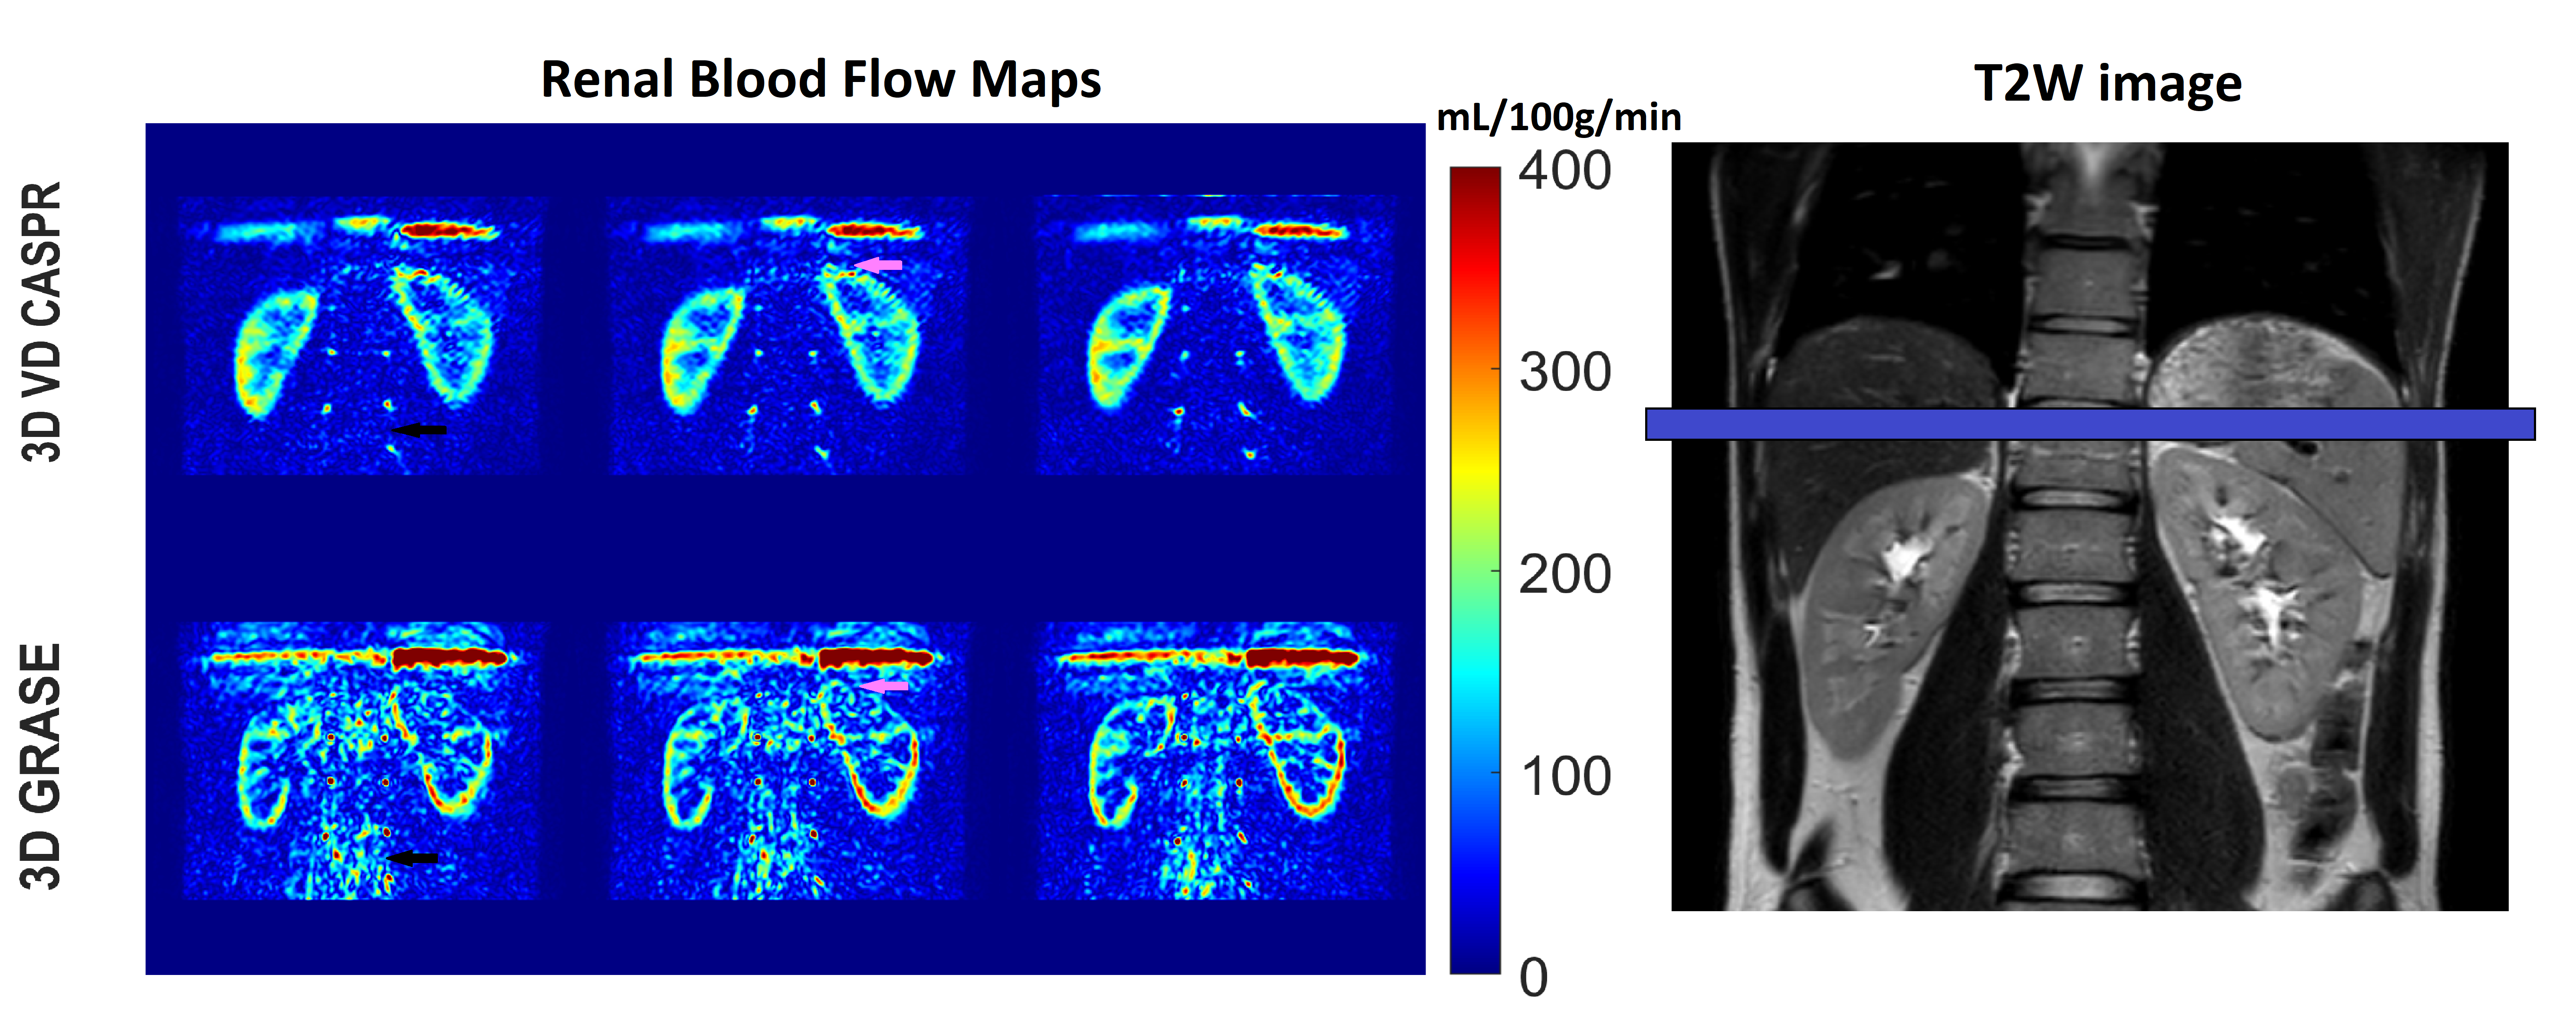
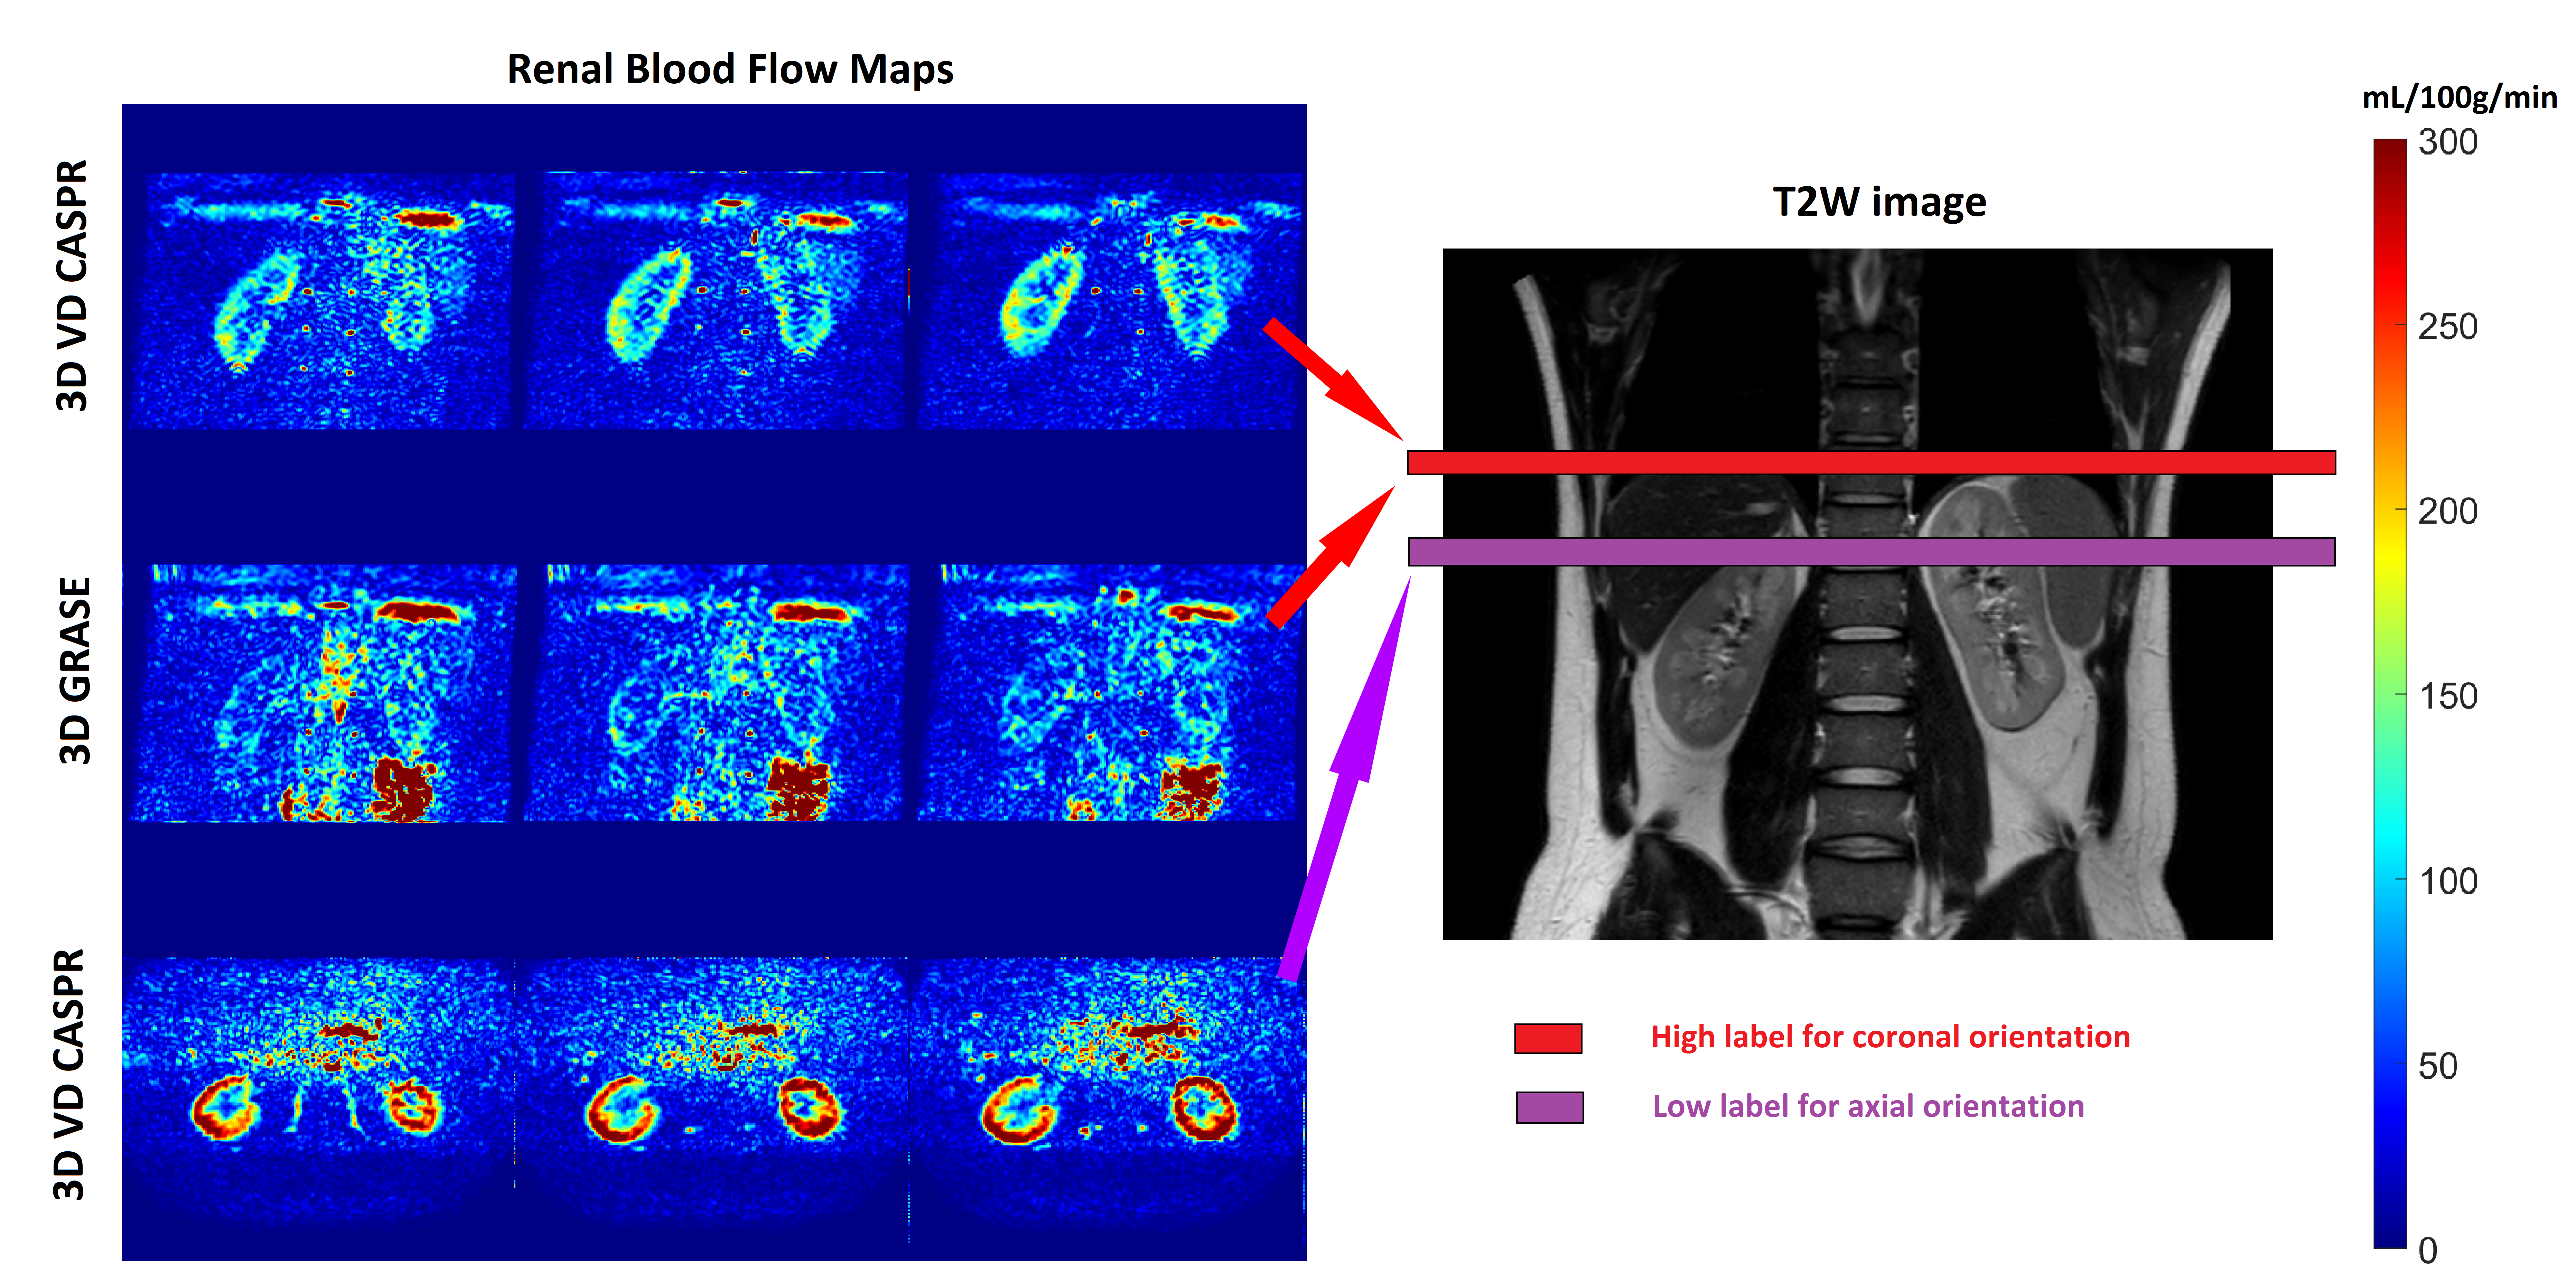
Perfusion images of the whole kidney were successfully obtained in all 4 healthy volunteers. Representative perfusion weighted images and RBF maps with good labeling efficiency in coronal orientations are shown in Figure 1. Compared to 3D TSE VD-CASPR, 3D GRASE generated sharper RBF maps due to less pronounced T2 decay. However, 3D GRASE suffered from signal loss near the anterior side of kidneys due to increased susceptibility to breathing motion and B0 inhomogeneities (e.g., Fig. 1, Column 1). Moreover, 3D TSE VD-CASPR achieved robust RBF maps (pink arrow) and increased cortex to background contrast (black arrow) (e.g., Fig. 2). With low pCASL labeling efficiency, RBF maps generated from 3D VD-CASPR (Fig. 3, Row 1) showed lower RBF values, while RBF maps generated from 3D GRASE (Fig. 3, Row 2) suffered from great signal loss. However, with increased labeling efficiency by move the labeling plane away from the lung and overlapping the kidney (purple bar), we achieved better RBF maps in axial orientation (Fig. 3, Row 3). With good labeling efficiency, both 3D pCASL with TSE VD-CASPR and 3D pCASL with GRASE provided robust and similar RBF maps, while TSE VD-CASPR achieved higher SNR (Table 1).Discussion and Conclusion
With good labeling efficiency, both 3D pCASL with TSE VD-CASPR and 3D pCASL with GRASE can provide good volumetric RBF maps in healthy volunteers. However, RBF maps obtained from TSE VD-CASPR are more robust across difference slices and regions and can provide better cortex-to-background contrast. Although RBF maps generated from TSE VD-CASPR are more blurred compared to RBF maps from GRASE, the sharpness can be improved by k-space filtering for compensating T2 blurring in 3D TSE VD-CASPR (5).Acknowledgements
This work was partly supported by the NIH/NCI grant U01CA207091. We also like to thank our MR technologist, Abey Thomas, and all volunteers.References
1. Alsop, D. C., Detre, J. A., Golay, X., Günther, M., Hendrikse, J., Hernandez-Garcia, L., . . . Zaharchuk, G. (2015). Recommended implementation of arterial spin-labeled perfusion MRI for clinical applications: A consensus of the ISMRM perfusion study group and the European consortium for ASL in dementia. Magnetic Resonance in Medicine, 73(1), 102-116. doi:10.1002/mrm.25197
2. Nery, F., Buchanan, C. E., Harteveld, A. A., Odudu, A., Bane, O., Cox, E. F., . . . Fernandez-Seara, M. A. (2020). Consensus-based technical recommendations for clinical translation of renal ASL MRI. MAGMA, 33(1), 141-161. doi:10.1007/s10334-019-00800-z
3. Zhou, L., Wang, Y., Pinho, M. C., Pan, E., Xi, Y., Maldjian, J. A., & Madhuranthakam, A. J. (2020). Intrasession Reliability of Arterial Spin-Labeled MRI-Measured Noncontrast Perfusion in Glioblastoma at 3 T. Tomography, 6(2), 139-147. doi:10.18383/j.tom.2020.00010
4. Wang Y., L. Z., Ivan Pedrosa, and Ananth J. Madhuranthakam. (2021). Volumetric Renal ASL MRI using 3D TSE Cartesian Acquisition with Variable Density Sampling (VD-CASPR). ISMRM, 0426.
5. Wang Y., J. S. G., Trevor Wigal, Marco C. Pinho, Joseph A. Maldjian, and Ananth J. Madhuranthakam. (2019). Compensating T2 blurring in 3D TSE with Cartesian acquisition based arterial spin labeled MRI. ISMRM, 4962.
Figures