4875
Reliability of Periventricular White Matter Cerebral Blood Flow using Different ASL protocols1Department of Neurology, University of Pennsylvania, Philadelphia, PA, United States, 2Department of Radiology, University of Pennsylvania, Philadelphia, PA, United States
Synopsis
Cerebral blood flow (CBF) in periventricular white matter (PVWM) may provide a mechanistically specific biomarker of cerebral small vessel disease. We compared the reliability of PVWM CBF obtained from arterial spin labeling MRI acquired twice separated by a week, using different protocols involving standard, long labeling duration, single and multiple inflow saturation (MIS), and level of background suppression (BS), in young healthy participants. The MIS protocol with 99% BS significantly improved the temporal signal to noise ratio of the acquisition, with a subtle improvement of intersession-reliability. Reliability of PVWM CBF was of the same order as other conventional regions of interest.
Introduction
Cerebral small vessel disease (CSVD) is a leading cause of cognitive impairment and likely the most prevalent neurological disorder.1 White matter hyperintensities (WMH) currently provide the most commonly used biomarker of CSVD, but are not mechanistically specific for SVD.2 The earliest and most common location for WMHs in CSVD is the periventricular white matter (PVWM) region.3 We recently proposed that cerebral blood flow (CBF) measured from the periventricular region using arterial spin labeled (ASL) perfusion MRI may provide a mechanistically specific and predictive biomarker of CSVD3 and showed its reliability using concurrently acquired ASL and 15O-positron emission tomography data acquired on a PET-MRI scanner.4 Here we compared the reliability of ASL-derived PVWM CBF using different ASL protocols involving different labeling durations, inflow saturation, and background suppression protocols.5Methods
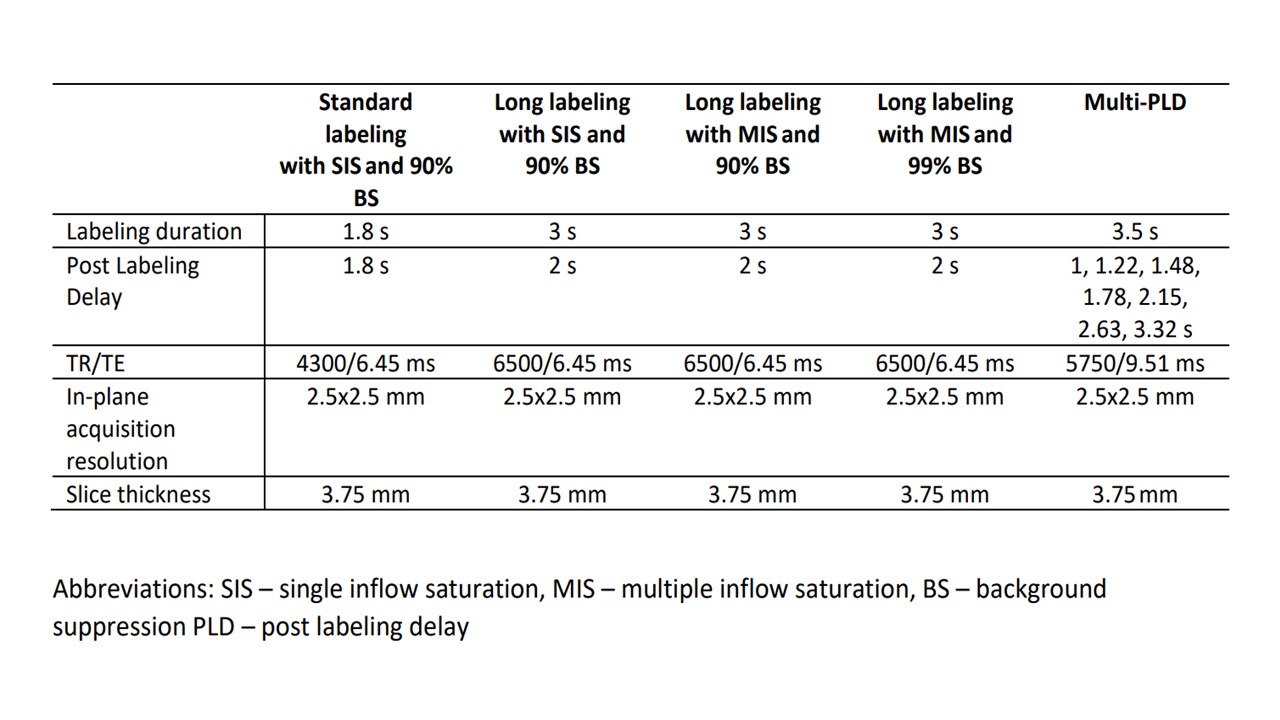
Healthy subjects with no history of cerebrovascular disease were recruited at the University of Pennsylvania (N=23, mean age=34.5±13.8 y, 10 female) and underwent two scanning sessions separated by one week, both at the same time of the day. ASL MRI data were acquired on a Siemens 3T scanner, using four different protocols, all acquired with background-suppressed pseudocontinuous ASL using a 4-shot and z-accelerated 3D stack-of-spirals readout. The protocols are listed in Table 1 and differed in labeling duration (LD; 1.8s versus 3s), slightly different postlabeling delay (PLD; 1.8s versus 2s), inflow saturation (single versus multiple) and background suppression (90% versus 99%). The labeling plane was manually placed at an optimal location determined by a time-of-flight angiography scan. Eight label/control pairs were obtained for each protocol. The MRI protocol also included a Hadamard encoded multi-PLD sequence to measure arterial transit time (ATT). The ASL data were processed using in-house developed pipelines following the recommendation by the ASL white paper.6 CBF quantification of the single-PLD data used a single compartment model while multi-PLD data was used to calculate ATT7 by decoding a Hadamard-encoded matrix of 7 PLDs. Mean CBF was measured in whole brain (WB), gray matter (GM), white matter (WM), and a previously defined PVWM region of interest (ROI).3 Relative CBF in the PVWM ROI was also obtained by normalization with WB CBF. The reliability of the PVWM measurements obtained a week apart using the different protocols were assessed using within subject coefficient of variation (wsCV) and were compared using a bootstrapping method. We also computed and compared the temporal signal to noise ratio (tSNR) in the PVWM region for each protocol. The tSNR was obtained by measuring the mean CBF in each ROI in each CBF volume of the time series and computing the ratio of the mean and the standard deviation of the values.Results
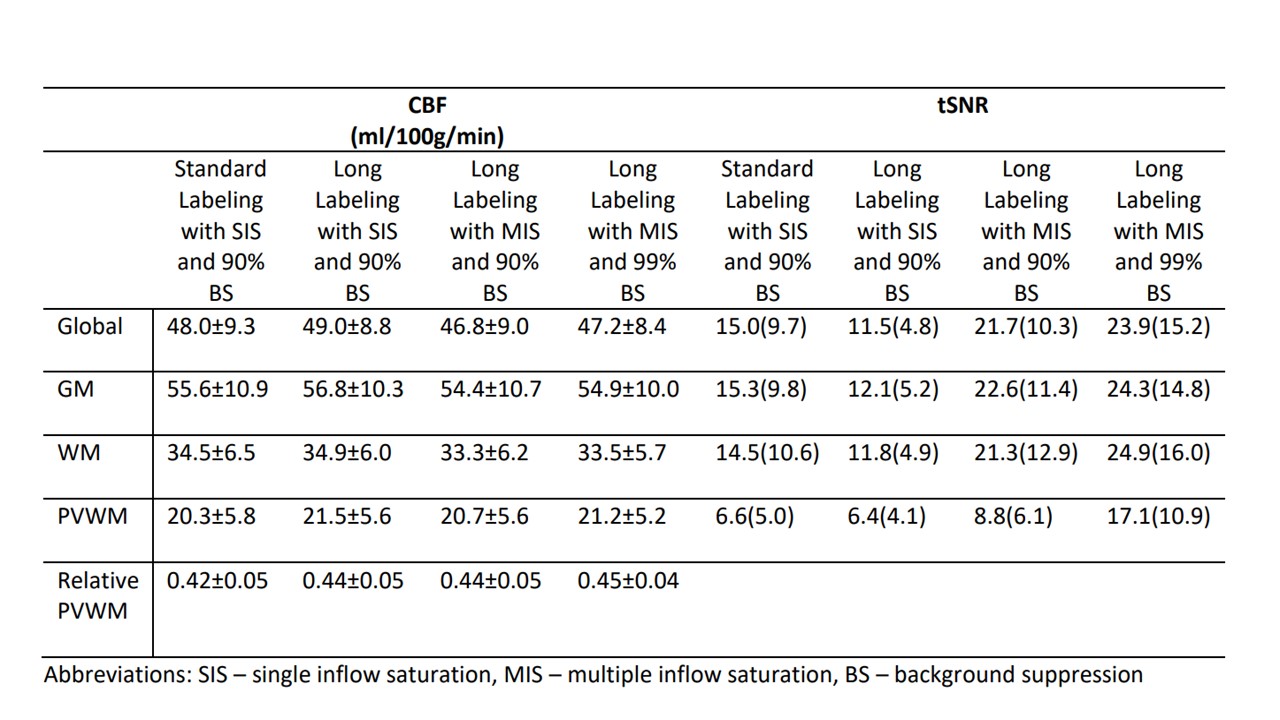
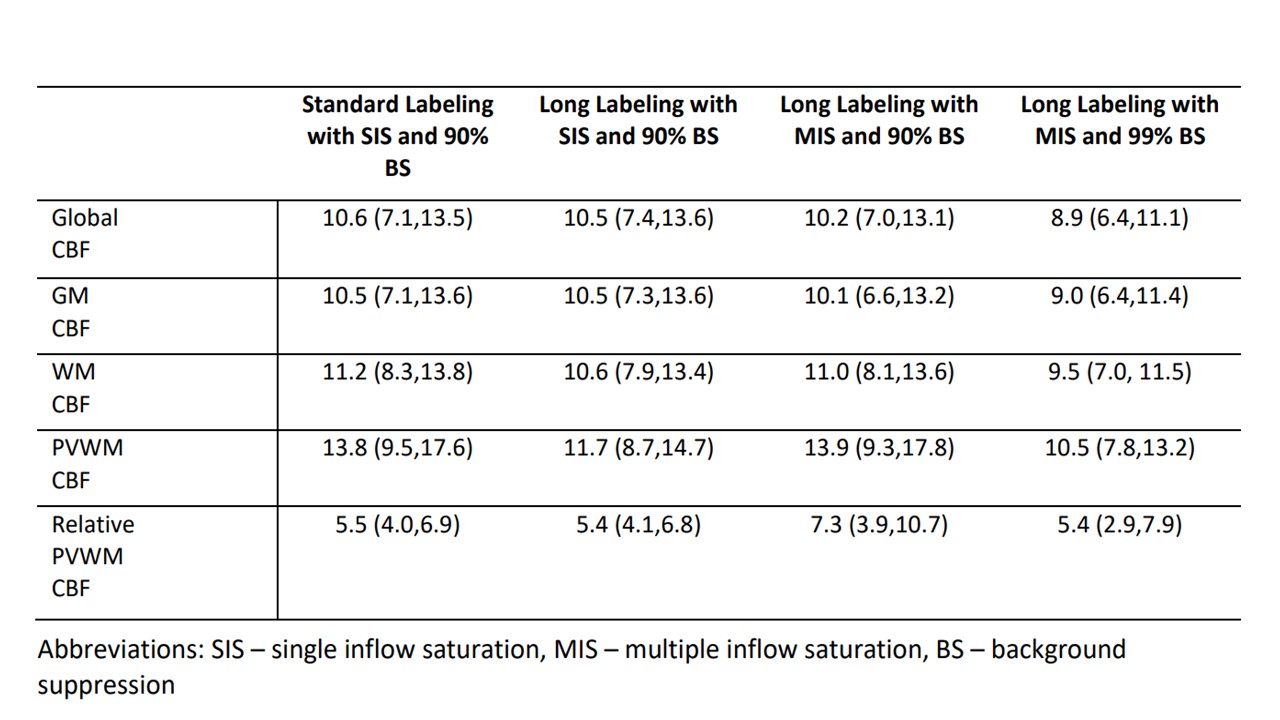
Table 2 shows the ASL-derived CBF and tSNR values in the different ROIs. Consistent CBF values were observed across the protocols. TSNR was significantly different between the protocols with MIS using 99% BS having highest tSNR and LD=3 with SIS-90% BS protocol having the lowest tSNR. The wsCV values for the different ASL protocols in the different ROIs are listed in Table 3. The MIS protocol with 99% BS had lowest wsCV on average though there was no significant difference between wsCV values of the different protocols. When compared across ROIs, the wsCV values of the PVWM region was significantly higher than the other ROIs for all the ASL protocols, though they are all of the same order. Repeatability for relative PVWM CBF was significantly better (p<0.005) than absolute measures. Finally, ATT of the GM, WM and PVWM regions as assessed by the Hadamard encoded sequence was found to be 1385±179, 1522±199 and 1664±201 ms, respectively.Discussion
ATT in PVWM was in agreement with recent reports8 confirming that periventricular ATT is not dramatically longer than in WM more generally, and supporting the notion that PVWM CBF can be quantified using ASL MRI using standard PLD. WsCV values were comparable across all regions, albeit slightly higher for the smaller PVWM ROI. However, wsCV for relative CBF in the PVWM ROI was considerably improved, suggesting that global effects such as differences in labeling efficiency underlie much of the variance in repeated measures. Significantly higher tSNR was observed for the longer LD/PLD data with MIS and 99% BS, but its improved tSNR did not significantly reduce wsCV suggesting that SNR was not limiting for any of the acquisitions and that similar repeatability can be obtained with fewer averages using this sequence.Conclusion
CBF can be reliably measured in the periventricular region using background suppressed 3D ASL using both standard and long labeling duration and standard PLD values in young healthy subjects. In older subjects or patients with SVD, longer LD and longer PLD values may be more advantageous than the results of this study suggest.Acknowledgements
Research reported in this abstract was supported by the National Institutes of Health under award numbers R01 NS111115 and R03 AG063213.References
1. Hamilton OKL, Backhouse E V., Janssen E, et al. Cognitive impairment in sporadic cerebral small vessel disease: A systematic review and meta-analysis. Alzheimer’s Dement. 2021;17(4):665-685. doi:10.1002/alz.12221
2. Shi Y, Thrippleton MJ, Makin SD, et al. Cerebral blood flow in small vessel disease: A systematic review and meta-analysis. J Cereb Blood Flow Metab. 2016;36(10):1653-1667. doi:10.1177/0271678X16662891
3. Dolui S, Tisdall D, Vidorreta M, et al. Characterizing a perfusion-based periventricular small vessel region of interest. NeuroImage Clin. 2019;23(June):101897. doi:10.1016/j.nicl.2019.101897
4. Dolui S, Fan AP, Zhao MY, Nasrallah IM, Zaharchuk G, Detre JA. Reliability of arterial spin labeling derived cerebral blood flow in periventricular white matter. Neuroimage: Reports. 2021;1(4):100063. doi:10.1016/j.ynirp.2021.100063
5. Qu J, Lin T, Prabhakaran K, Balchandani P, Detre JA, Tisdall MD. Improved inflow saturation markedly reduces inflow artifacts in background-suppressed 3D arterial spin labeling In-Vivo Experiment Result. In proceedings of the International Society for Magnetic Resonance in Medicine. Abstract: 3275. Published online 2020:25.
6. Vidorreta M, Wang Z, Rodriguez I, Pastor MA, Detre JA, Fernández-Seara MA. Comparison of 2D and 3D single-shot ASL perfusion fMRI sequences. Neuroimage. 2013;66:662-671. doi:10.1016/j.neuroimage.2012.10.087
7. Dai W, Robson PM, Shankaranarayanan A, Alsop DC. Reduced resolution transit delay prescan for quantitative continuous arterial spin labeling perfusion imaging. Magn Reson Med. 2012;67(5):1252-1265. doi:10.1002/mrm.23103
8. Juttukonda MR, Li B, Almaktoum R, et al. Characterizing cerebral hemodynamics across the adult lifespan with arterial spin labeling MRI data from the Human Connectome Project-Aging. Neuroimage. 2021;230:117807. doi:10.1016/j.neuroimage.2021.117807
Figures