4873
Follow-up versus baseline 4D flow-derived in vivo hemodynamic parameters stratify descending aorta dissection patients with enlarging aortas1Radiology, Northwestern University, Chicago, IL, United States, 2Northwestern University, Chicago, IL, United States, 3Siemens Healtineers, Erlangen, Germany, 4Cryolife Inc., Kennesaw, GA, United States
Synopsis
Increasing aorta diameter in type B aortic dissection (TBAD) patients is associated with adverse clinical outcomes. Our study evaluates true and false lumen (TL, FL) hemodynamics (kinetic energy (KE), maximum velocity (MV), forward flow (FF), and reverse flow (RF) in baseline and follow-up thoracic aorta 4D flow (4DF) MRI. Baseline aortic diameter does not correlate with aortic growth rate, while FL-total KE, FF, and RF correlate negatively. At follow-up, larger increases in FL-total KE, total FF, KE ratio and FL-mean MV correlate positively with aortic growth rate. Investigating hemodynamic changes in follow-up 4DF may be useful for evaluating TBAD patients.
Introduction
Increasing aortic diameter is associated with increasing morbidity, mortality, and need for surgical or endovascular intervention in patients with type B aortic dissection (TBAD). Imaging-based risk-stratification has been limited to evaluation of baseline aortic diameter and diameter increase in follow-up. However, there is emerging evidence that quantitative assessment of true and false lumen (TL and FL) aorta hemodynamics in vivo may better capture the physiologic drivers of adverse outcomes in TBAD.1,2 Furthermore, how these aortic flow hemodynamics change over time in consecutive follow-up scans remains to be investigated. Our study used 4D flow (4DF) MRI to quantify the in vivo volumetric TL and FL kinetic energy (KE), maximum velocity (MV), as well as forward and reverse flow (FF and RF) in patient baseline and follow-up scans to determine their relationship with aortic growth over time.Methods
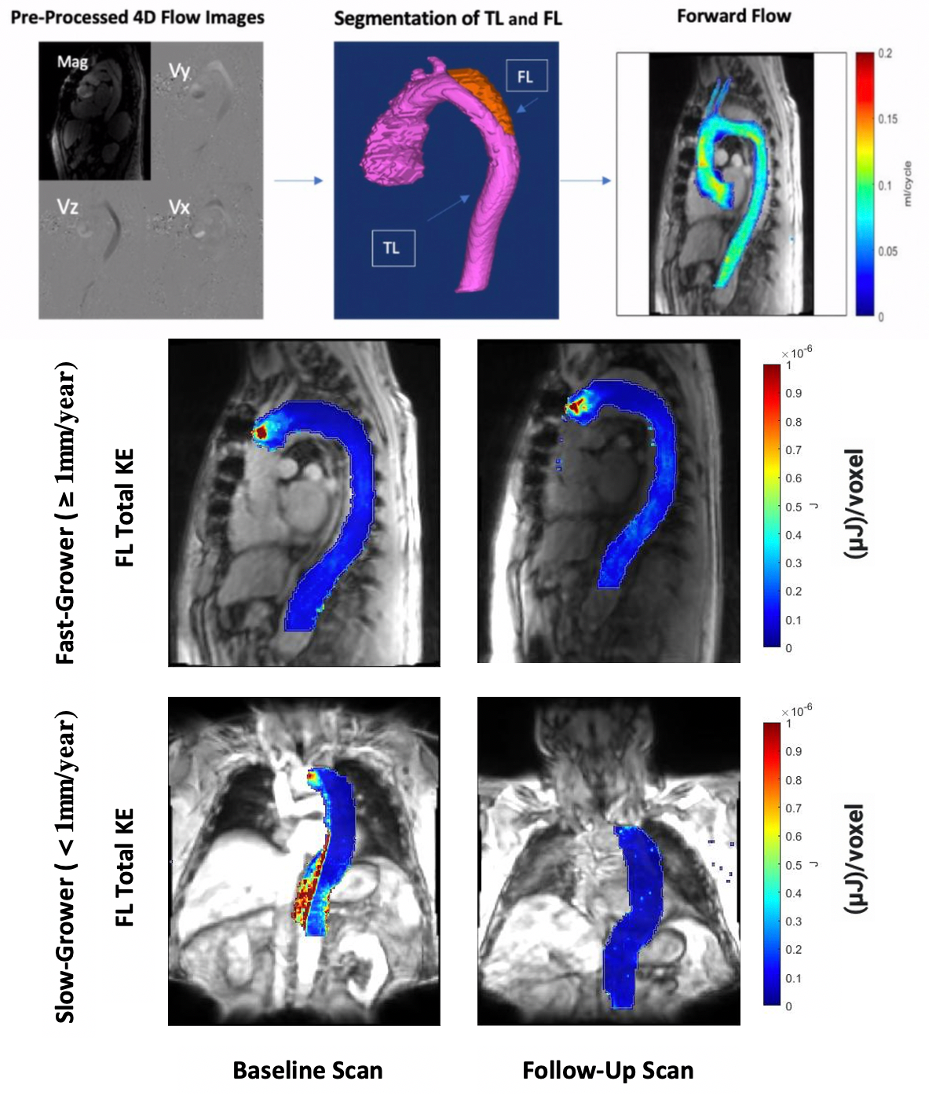
We retrospectively identified TBAD patients who underwent 1) baseline standard-of care thoracic aorta MRA including 4DF MRI and 2) follow-up thoracic aorta MRA with 4DF MRI at least 90 days later (resolution: ~2.5mm3, VENC: 150-350). Patients with prior TBAD intervention before the baseline scan or between the baseline and follow-up scan were excluded. As described in Jarvis et. al, FL and TL from baseline and follow-up scans were manually segmented (Mimics, Materialise, Belgium) and voxel-wise mean KE, MV, FF, and RF were calculated using a Matlab tool.1 Total KE, FF and RF were calculated by summing over the cardiac cycle and then over the entire TL or FL volume (Figure 1). To account for a mix of prospectively (n=6) and retrospectively (n=3) ECG-gated scans, all measurements were calculated using only the duration of the shortest scan, truncating data in longer scans. KE ratio was defined as total FL KE/total TL KE. Maximal TBAD diameters of the baseline and most-recent follow-up MRA were measured by an experienced cardiovascular radiologist. Patients in the study were divided into a “fast-grower” vs. “slow-grower” based on an aortic diameter growth rate of < 1 vs. ≥ 1 mm/year. For each hemodynamic parameter, Δ (calculated as follow-up scan minus baseline scan) was compared between fast and slow-growers using an independent t-test. Lastly, Pearson correlation tests were performed between 1) baseline hemodynamic parameters vs. aortic growth rate and 2) between Δ values vs. aortic growth rate to assess relationships between these hemodynamics and clinical outcomes in TBAD.Results
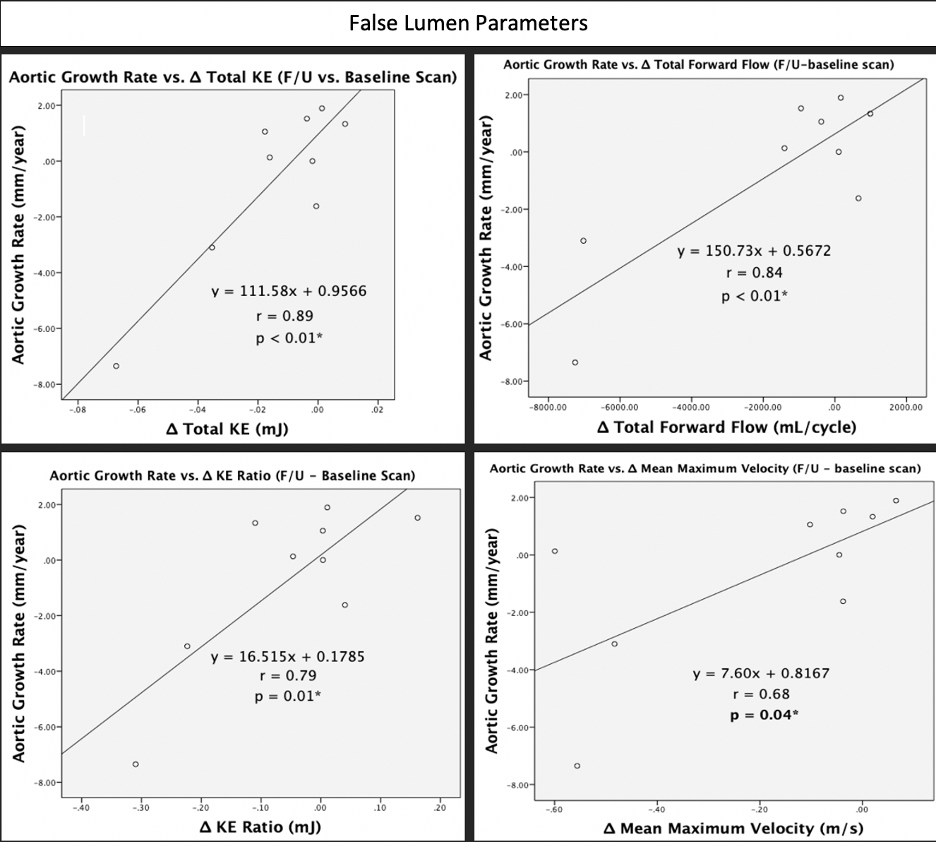
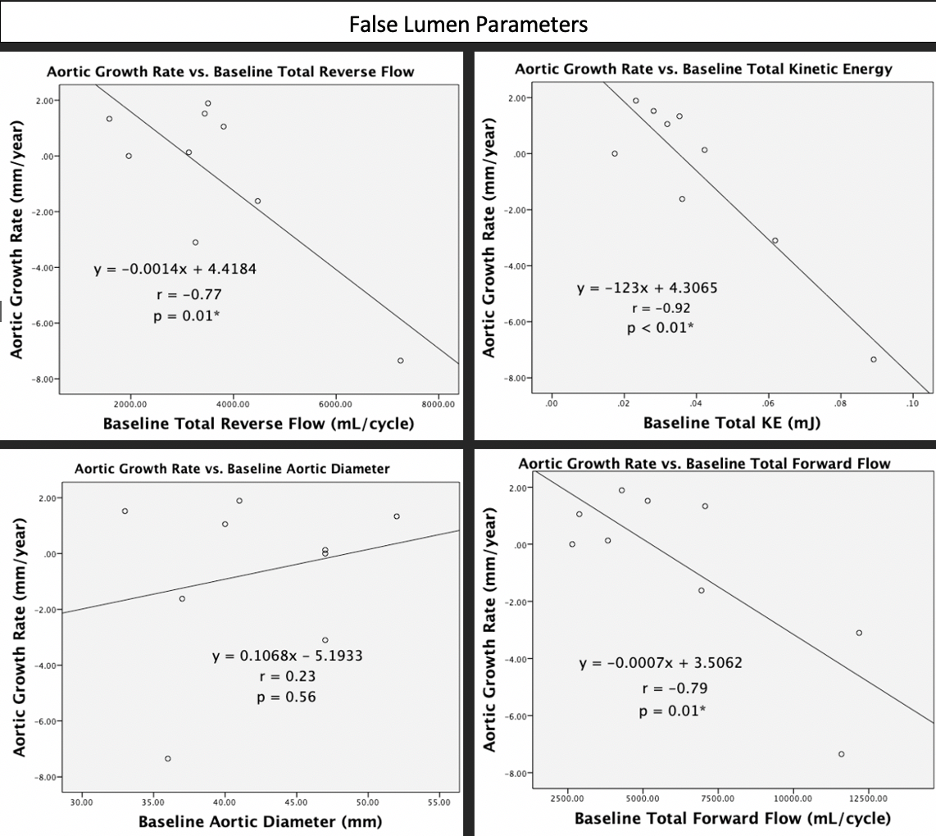
A total of 9 patients met inclusion criteria (age: 52 (28-63) years, M/F: 5/4, n = 8 chronic TBAD, n = 1 acute TBAD at baseline, n = 4 with connective tissue disease). There were 5 slow-growers (mean follow-up time of 841 (149-2813) days) and 4 fast-growers (mean follow-up time of 470 (193-720) days). Cardiac cycle cutoff for baseline and follow-up scans were 667 and 648 ms, respectively. There were no differences in baseline aortic diameter between slow and fast growers (p=0.37). There were no significant differences in Δ of any hemodynamic parameters between fast and slow-growers (p >0.05). Baseline FL-total KE (r=-0.92, p<0.01), total FF (r=-0.79, p=0.01), and total RF (r=-0.77, p=0.01) were correlated with aortic growth rate, while baseline aortic diameter was not (p=0.56) (Figure 2). For follow-up, Δ FL-total KE (r=0.89, p<0.01) & FF (r=0.84, p<0.01), Δ FL-mean MV (r=0.68, p=0.04) and Δ KE ratio (r=0.79, p=0.01) were positively correlated with aortic growth rate (Figure 3).Discussion
Our study suggests that both baseline 4DF hemodynamic parameters as well as changes over time correlate with aortic growth rates in TBAD patients. In particular, larger increases in FL-total KE & FF, mean MV and KE ratio on follow-up 4DF may suggest faster aortic growth (Figure 3). Interestingly, higher total FF, KE, and RF in the FL at baseline were correlated with slower growth rates. It is unclear if this effect is due to physiology (i.e. more flow implies less resistance in the FL and lower pressures overall), treatment effects (i.e. more aggressive anti-hypertensive therapy), or related to our measurement technique. It is also interesting that increases in these parameters over time positively correlated with aortic growth rates, which may help to understand the underlying physiology of protective mechanisms for TBAD, namely reducing flow into the FL leads to slower growth. Baseline diameter—often used to surveil aortic growth after TBAD—did not differ between fast and slow growers at baseline and was not found to correlate with aortic growth rate, illustrating that improved tools are needed to evaluate TBAD patients.1,2 Our study is limited by small numbers of patients, potentially reducing our power to detect further hemodynamic differences in these groups. Also, we had several outliers in our cohort which are likely biasing the results. Nonetheless, exploring hemodynamic changes between baseline and follow-up 4DF scans in TBAD patients is a novel area of study, and our study population continues to grow.Conclusion
Aortic diameter measurement has been the norm for assessing aortic growth, but did not differ between fast and slow growers and was not correlated with growth rate. In contrast, our results suggest that evaluating in vivo TL and FL hemodynamics in baseline 4DF, as well as comparing them to corresponding follow-up 4DF scans may provide additional risk-stratification tools relative to standard-of-care aortic diameter measurements.Acknowledgements
No acknowledgement found.References
1. Jarvis K, Pruijssen JT, Son AY, Allen BD, Soulat G, Vali A, Barker AJ, Hoel AW, Eskandar MK, Malaisrie SC, Carr JC, Collins JD, Markl M. Parametric Hemodynamic 4D Flow MRI Maps for the Characterization of Chronic Thoracic Descending Aortic Dissection. J Magn Reson . Imaging. 2020 May;51(5):1357-1368. doi: 10.1002/jmri.26986. Epub 2019 Nov 12. PMID: 31714648; PMCID: PMC7166194.
2. Allen BD, Aouad PJ, Burris NS, Rahsepar AA, Jarvis KB, Francois CJ, Barker AJ, Malaisrie SC, Carr JC, Collins JD, Markl M. Detection and Hemodynamic Evaluation of Flap Fenestrations in Type B Aortic Dissection with 4D Flow MRI: Comparison with Conventional MRI and CTA. Radiol Cardiothorac Imaging. 2019 Apr;1(1): e180009. doi: 10.1148/ryct.2019180009. Epub 2019 Apr 25. PMID: 31598608; PMCID: PMC6784318.
Figures
*p ≤ 0.05 considered statistically significant
Figure 2: Scatter plots displaying the relationship between aortic growth rate and baseline total RF (r=-0.77, p=0.01), total KE (r=-0.92, p < 0.01), and total FF (r=-0.79, p=0.01) (all in the FL). Baseline aortic diameter was not correlated with aortic growth rate (r=0.23, p=0.56). Pearson correlation coefficients (r) are included in the plots as well.