4868
Comparison of 4D, 2D, and 1D phase-contrast MRI quantification of aortic pulse wave velocity in healthy adults1Radiology, University of Colorado Anschutz Medical Campus, Aurora, CO, United States, 2Radiology, Northwestern University, Chicago, IL, United States, 3Bioengineering, University of Colorado Anschutz Medical Campus, Aurora, CO, United States, 4Endocrinology, University of Colorado Anschutz Medical Campus, Aurora, CO, United States
Synopsis
Pulse wave velocity (PWV) is an important measure of cardiovascular health, related to vascular stiffness. Aortic PWV can be evaluated with a variety of MRI methods, however a direct comparison of PWV results quantified from 4D flow, 2D phase contrast (PC), and 1D projection PC MRI has not been performed. Here, PWV derived from 4D, 2D, and 1D-PC MRI acquisitions and associated analysis strategies were compared in the aortic arch. Relative agreement was observed among methods. 2D-PC PWV derived from the flow-area approach had substantial variability, likely due to the limited spatial/temporal resolution, and user-dependence of analysis.
INTRODUCTION
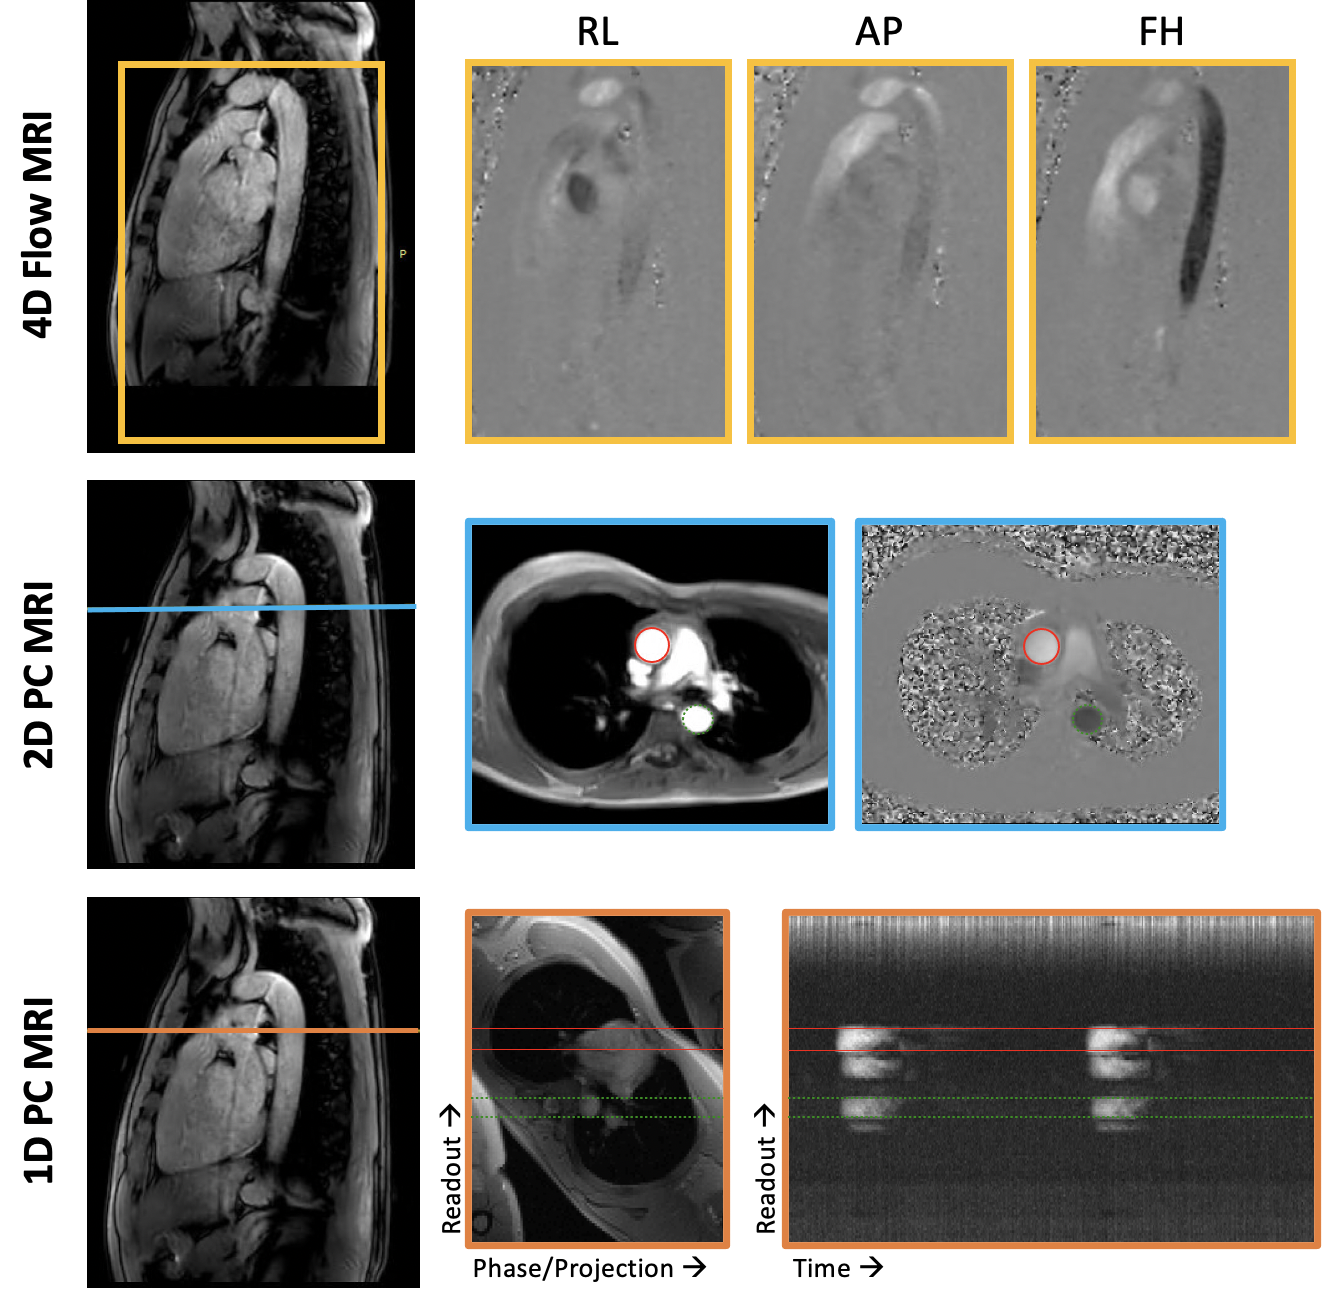
Pulse wave velocity (PWV) is a measure of arterial stiffness equal to the propagation velocity of the systolic pressure wave along a segment of the arterial tree1. PWV is an important marker of vascular health, not only correlated with age2-4, but also independently associated with cardiovascular disease and all-cause mortality5. In addition, PWV may be a modifiable risk factor: people with diabetes had a reduction in aortic PWV following a 15-week exercise intervention6. Interestingly, these results were observed in the aorta with 4D flow MRI, but not in PWV measured via carotid-femoral tonometry (SphygmoCor), suggesting that the thoracic aorta may be the primary site of arterial compliance changes.Confounding these findings is the fact that there are several MRI methods to quantify PWV, including 4D flow MRI7, flow-area (QA) changes based on 2D phase contrast (PC) MRI8, and foot-to-foot transit time (TT) measurement from 2D-PC9 or real-time 1D-PC projection MRI10. Each of these methods have specific advantages and drawbacks, and measure PWV with different analysis strategies in slightly different vascular territories (see Figs.1&2). Since a direct comparison of PWV derived from 4D, 2D, and 1D-PC MRI has not been performed, the purpose of this work is to quantify and compare PWV based on 4D, 2D, and 1D velocity-encoded MRI in the aortic arch.
METHODS
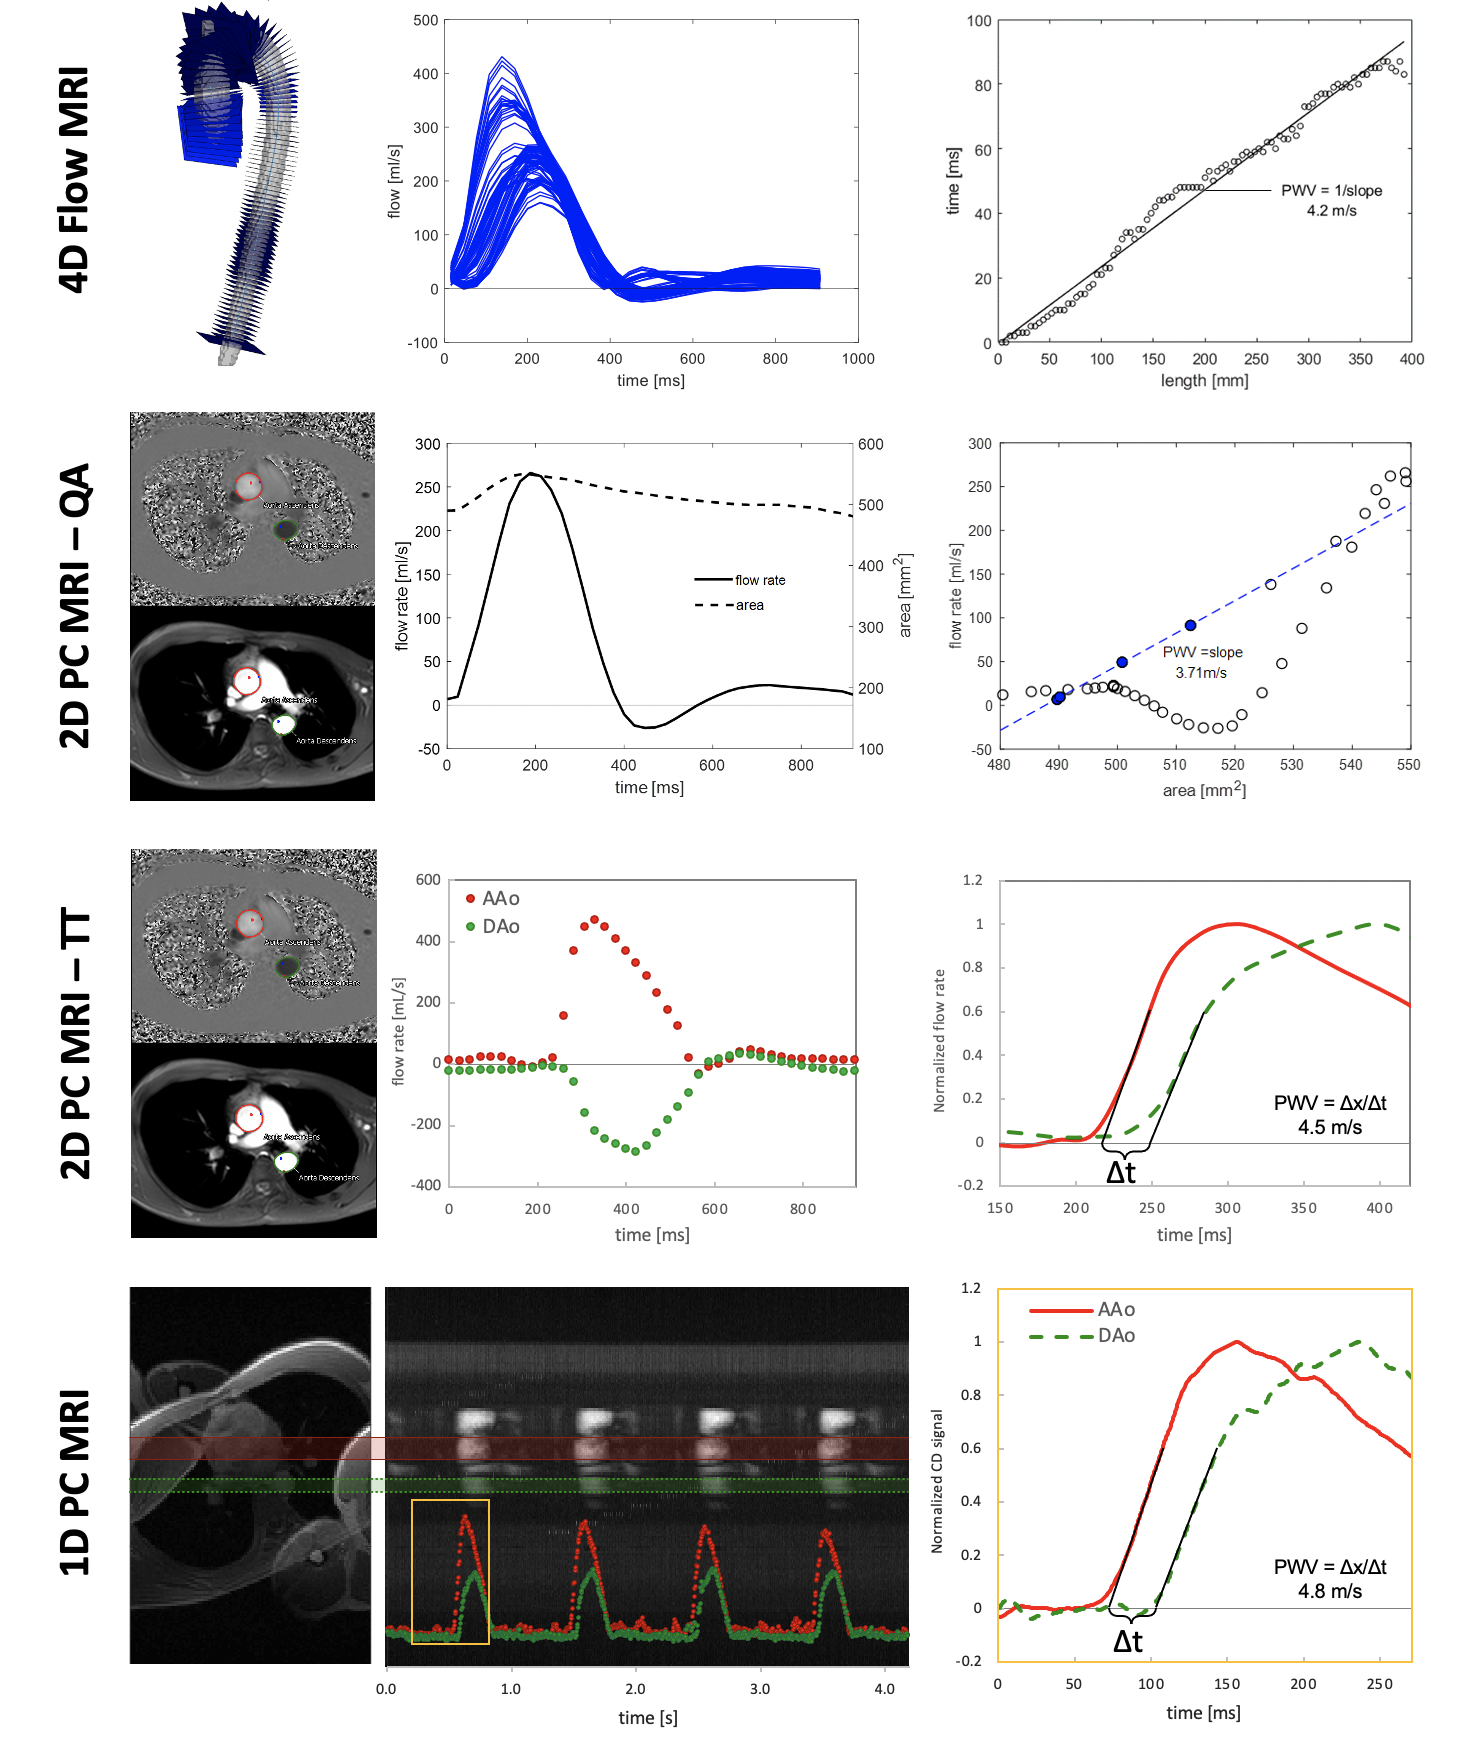
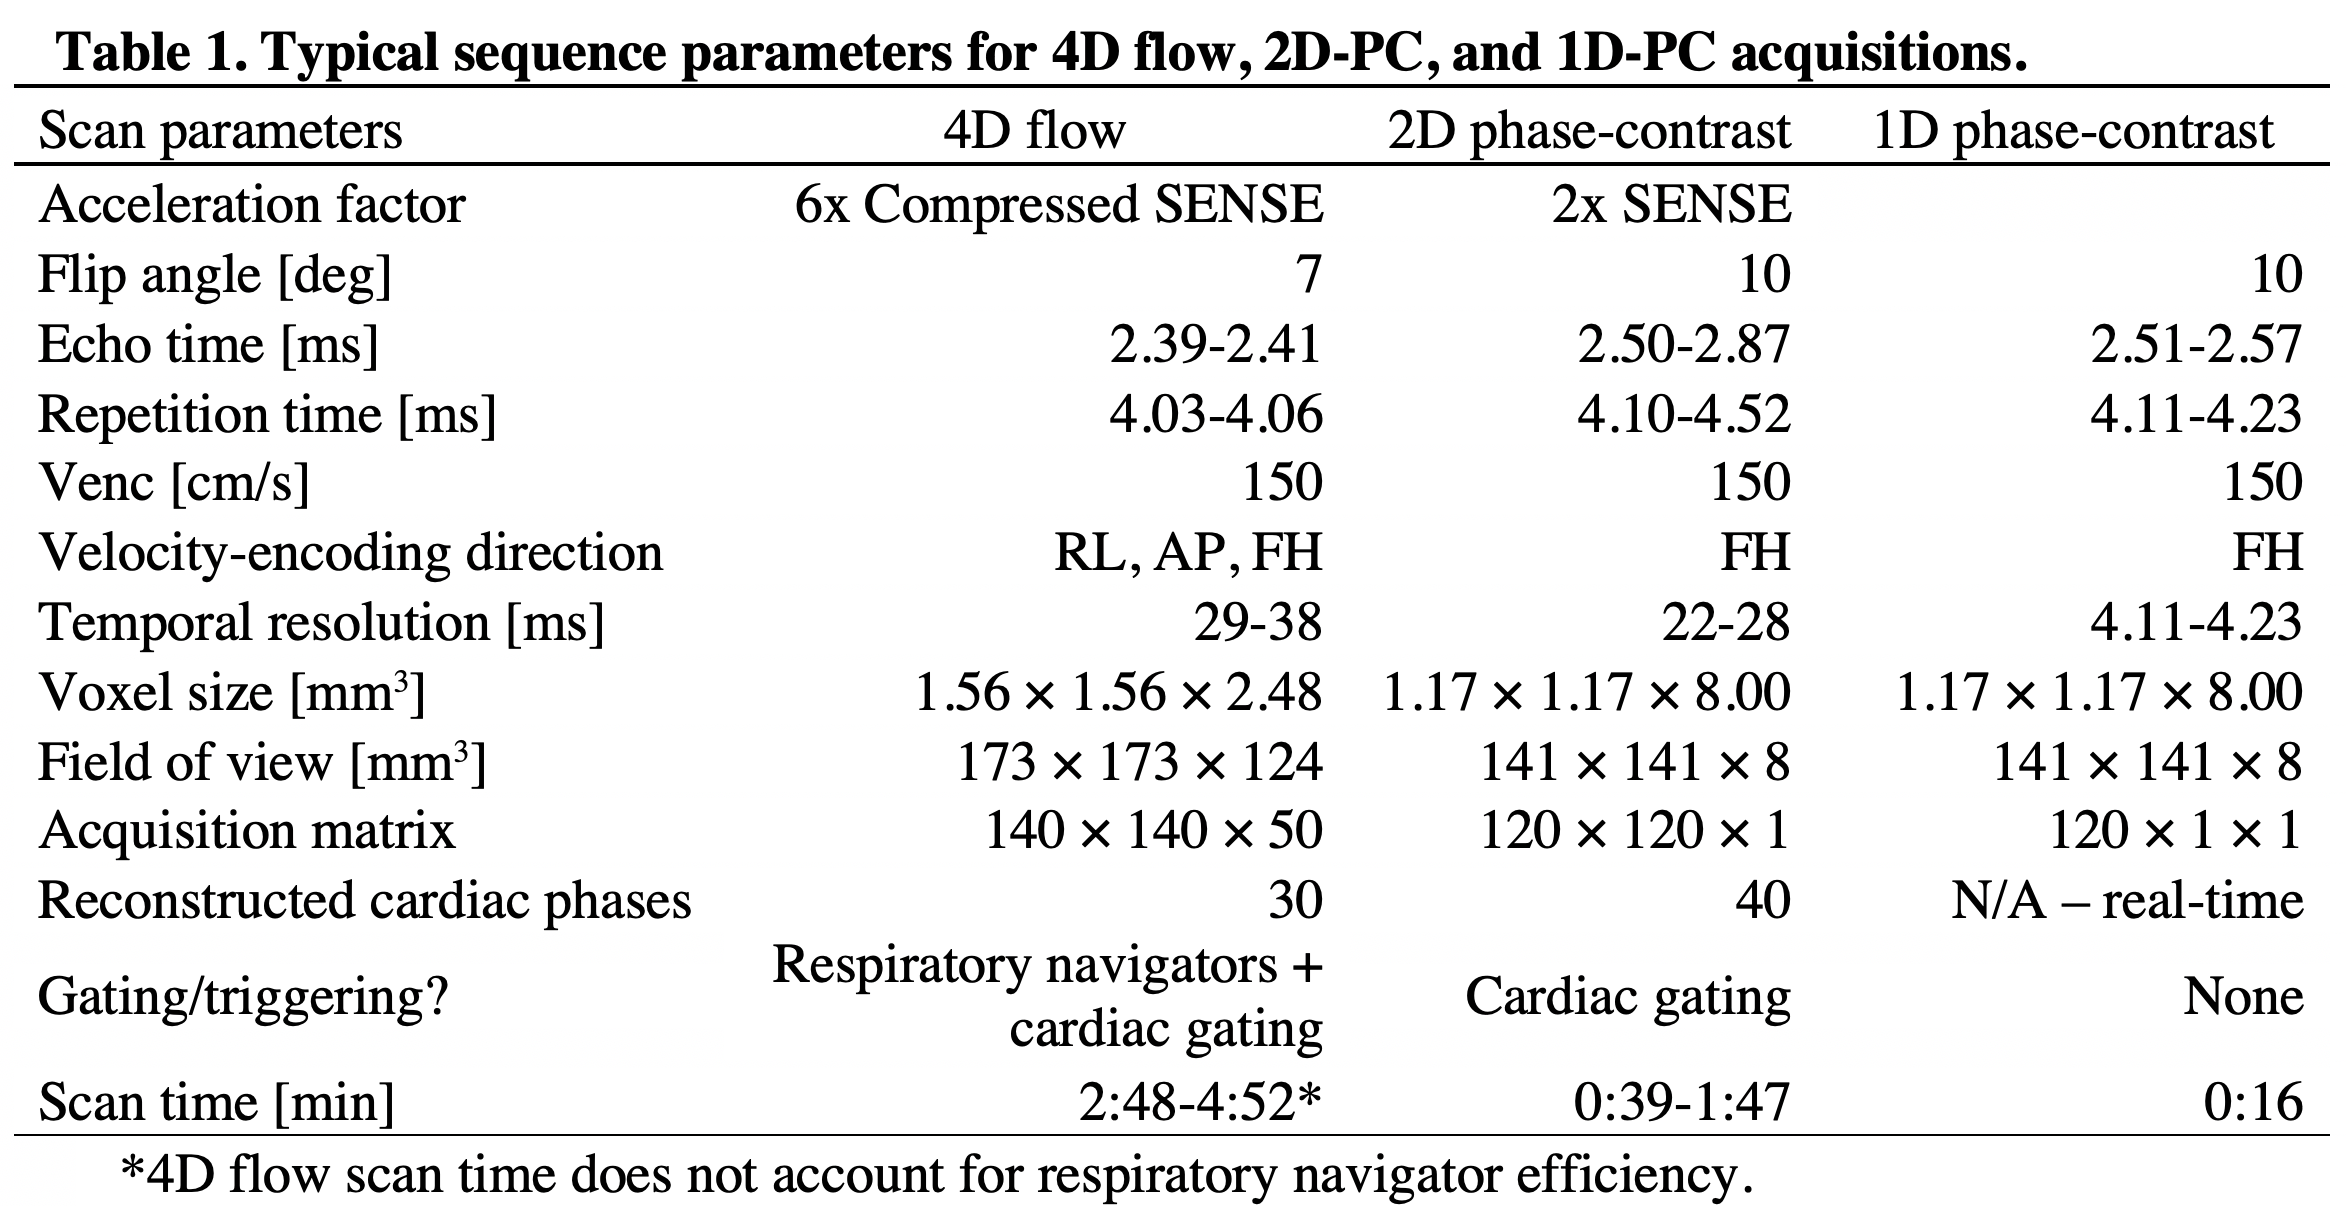
MRI Acquisition: With informed consent, 4D, 2D, and 1D PC-MRI data were collected during free-breathing in 10 healthy volunteers (7 males, 38.1±5.5 years) at 3T (Philips). Fig.1 illustrates the imaging protocol with sequence parameters summarized in Table 1. 4D7, 2D8,9,11 and 1D10 PWV methods have been previously reported. Briefly, for 1D-PC data, an axial imaging plane, intersecting the proximal ascending (AAo) and descending (DAo) aorta, was rotated to avoid vessel overlap. Traditional phase encoding gradients were turned off, yielding a projection of the signal along the “phase-encoding” direction10.Post-processing: Fig.2 shows analysis strategies for 4D, 2D (QA and TT), and 1D-PC approaches. The aorta was segmented from 4D flow, an aortic centerline was generated, and spatial separation (Δx) was computed, when required.
4D flow: After standard pre-processing12, PWV was computed via cross-correlation13. Analysis planes were placed every 4mm, and the time-delay between flow waveforms was determined as a function of distance from each reference plane. Final PWV was taken as the mean of the PWV estimates distribution.
2D-PC QA: ROIs were placed in the AAo and DAo for each cardiac phase11, and the change in average flow rate (ΔQ) and cross-sectional area (ΔA) was determined for the first four points of systole. PWV was computed at each location as: PWV=ΔQ/ΔA.
2D-PC TT: Flow rates at AAo and DAo locations were computed and normalized to a maximum=1. Temporal offset (Δt) between flow at AAo and DAo locations was determined based on the foot-to-foot method14 by fitting the early systolic upslope between 25%-60% of the maximum and extrapolating to 0.
1D-PC: The complex difference signal between adjacent positive and negative flow-encoded projections was averaged in regions corresponding to the AAo and DAo, yielding time-resolved waveforms that are proportional to velocity. Similar to 2D-PC TT, the onset of the systolic wave at each location was determined via foot-to-foot method for each heartbeat, and then Δt was averaged across beats. For both 1D-PC and 2D-PC TT, PWV was computed as PWV=Δx/Δt.
Statistics: A repeated-measures one-way ANOVA was used to test for differences among methods, and agreement was evaluated using Bland-Altman analyses.
RESULTS
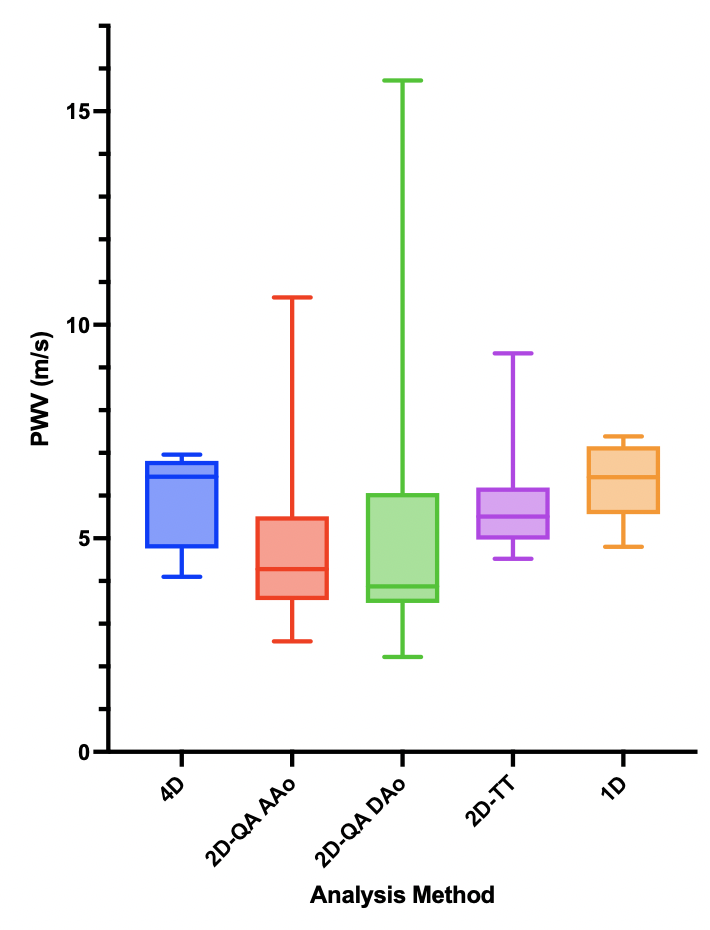
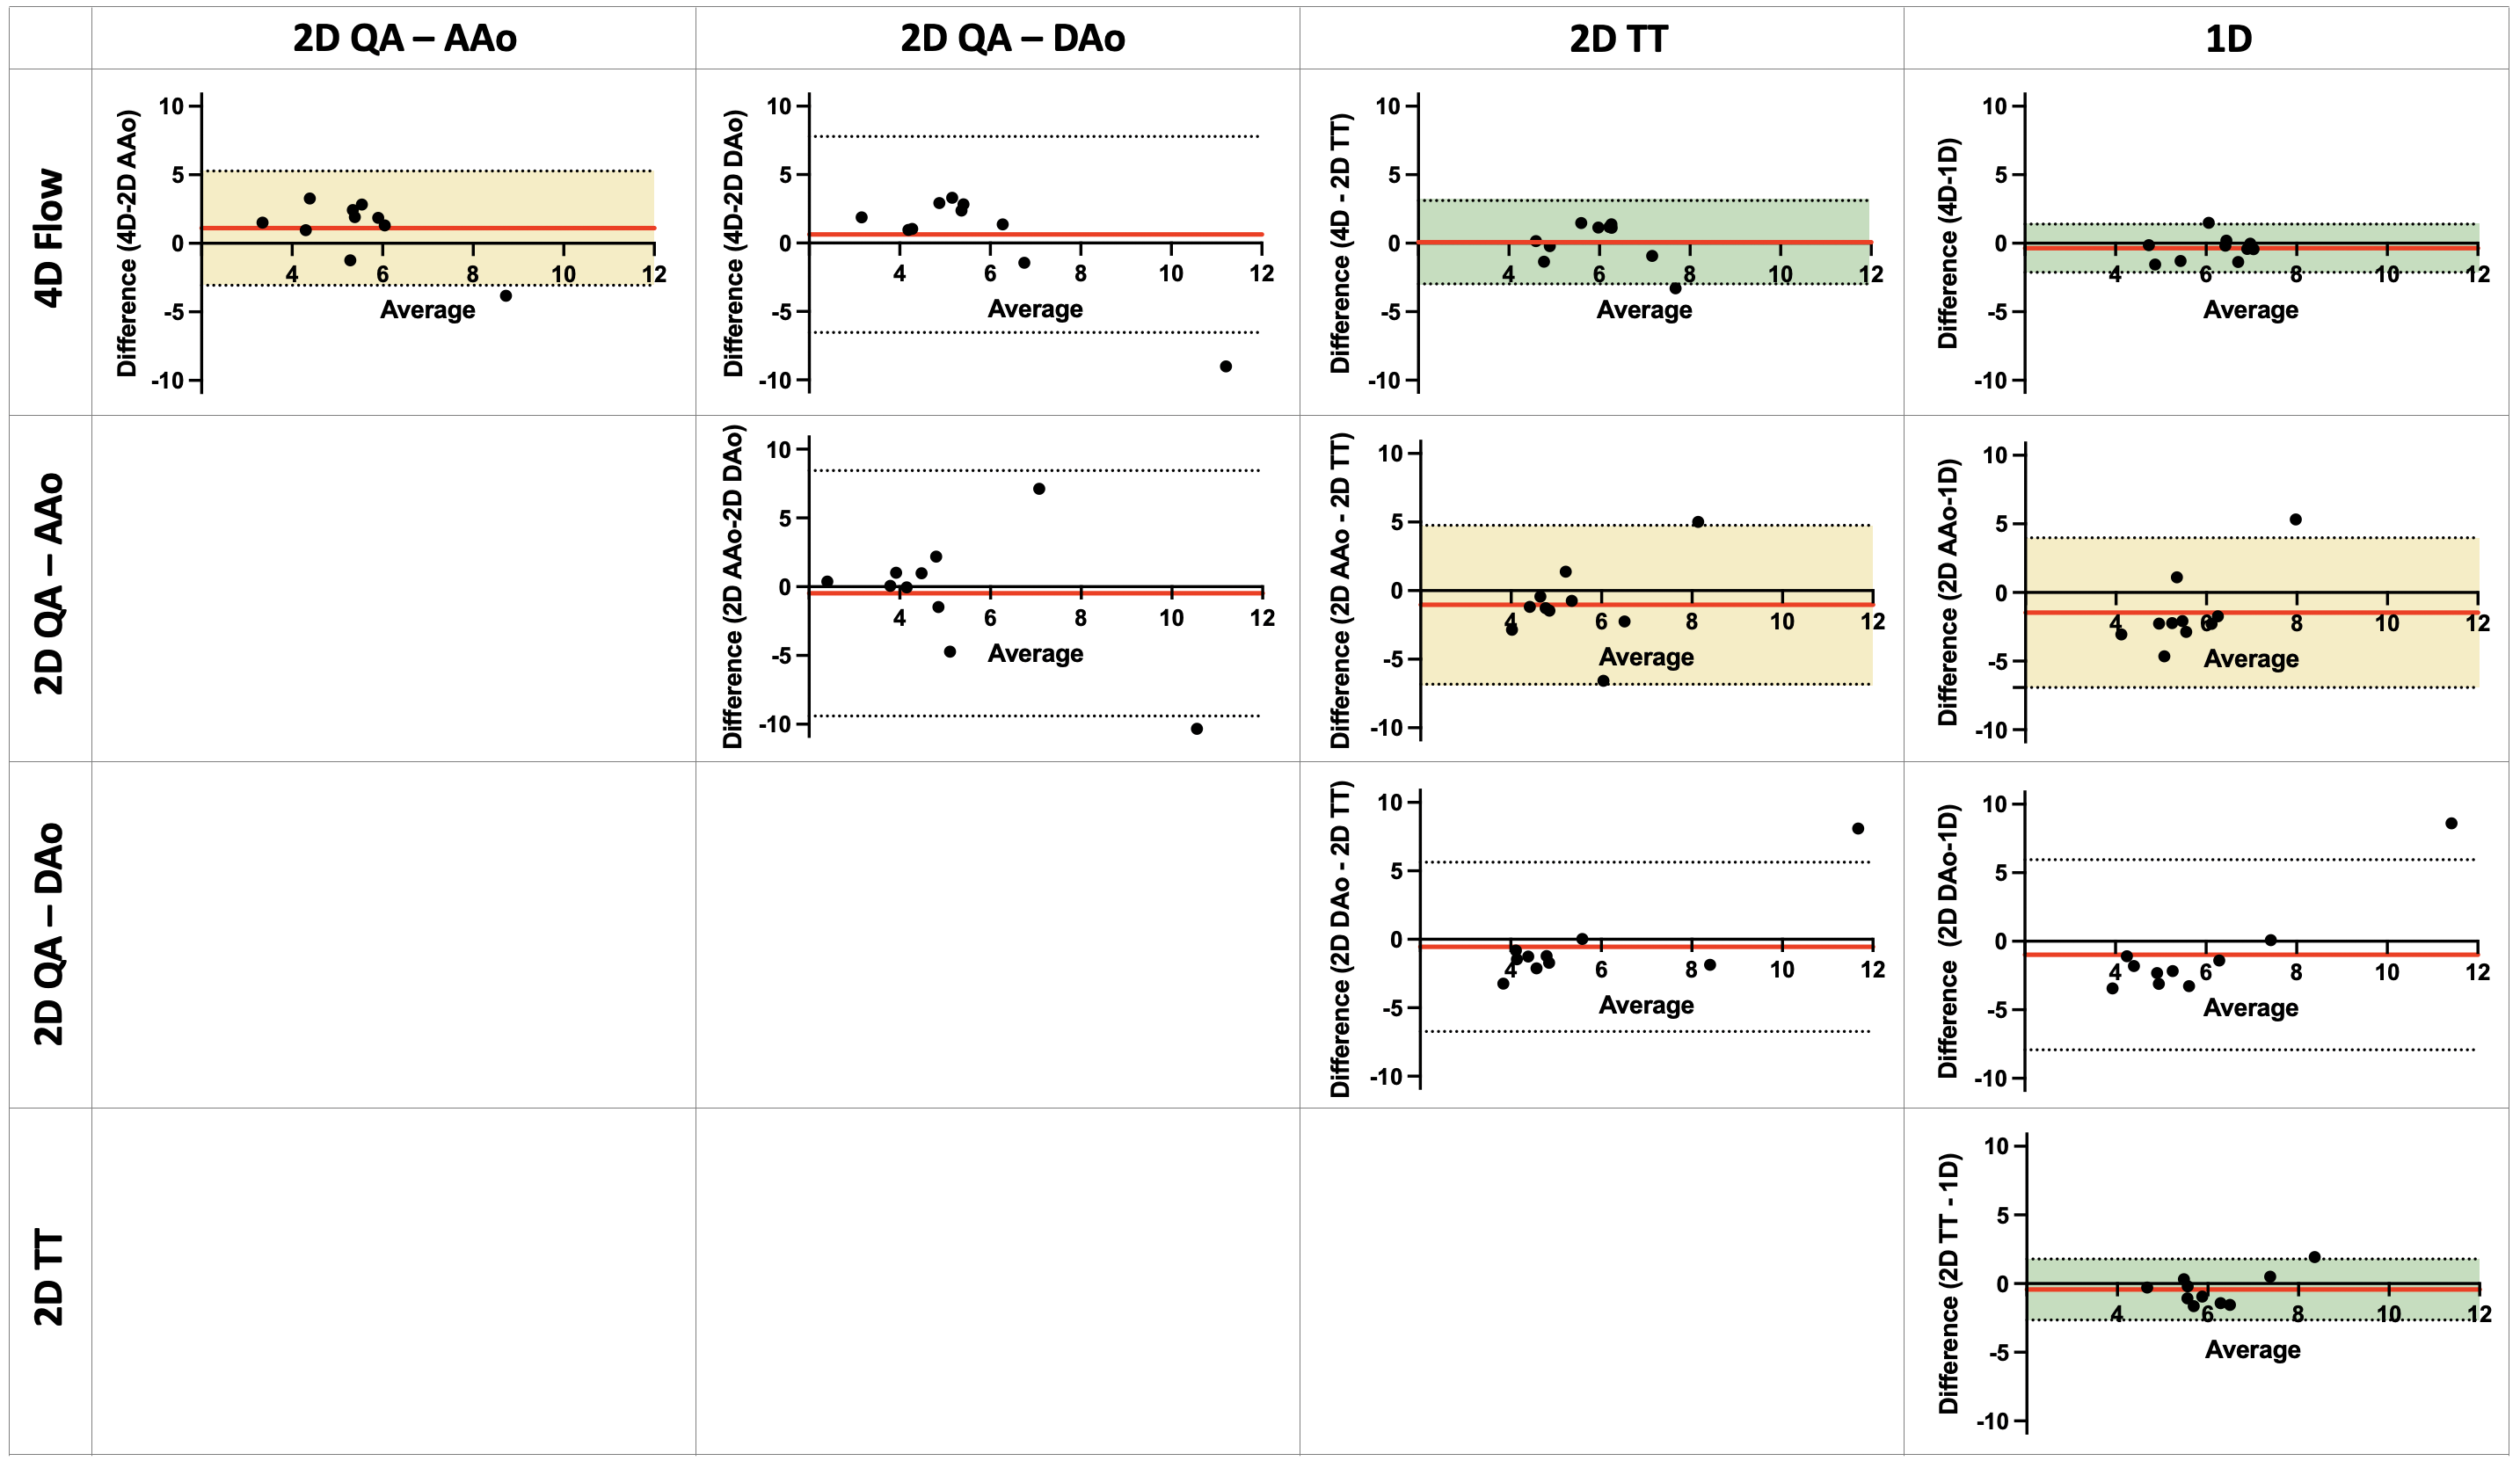
Fig.3 summarizes the PWV results from 4D, 2D, and 1D PC-MRI acquisitions. Differences were not observed between methods (p=0.46). Generally, the 2D-PC QA approach had the most variability. Variability was reduced for 2D-PC TT analysis, but was still higher than that of 4D flow and 1D-PC approaches. Bland-Altman analyses between pairs of results (Fig.4) showed that 4D flow and 1D-PC PWV had the smallest bias and tightest limits of agreement, and that 2D-PC TT had better agreement with 4D flow and 1D-PC than 2D-PC QA at either location.DISCUSSION & CONCLUSION
Agreement (bias<1.5m/s) was observed between 4D flow, 2D-PC and 1D-PC PWV measurements, in accord with previous studies that compared 4D flow and 2D-PC15, or 2D-PC and 1D-PC10. Here, the 2D-PC QA approach was the most variable, likely due to limited spatial resolution, leading to difficulty in accurate contouring of the vessel area, and temporal resolution, restricting the number of datapoints available to fit during early systole. Interestingly, the analysis pair with the widest limits of agreement was between 2D-PC QA at AAo and DAo, either suggesting truly local changes in aortic PWV, or more likely reflecting the user-dependence of the QA-based approach. Though 4D flow has similarly low temporal resolution, the redundancy of data used in the cross-correlation analysis improves its robustness to measurement noise. 1D-PC PWV is the only method presented herein that does not require cardiac gating or view-sharing, instead generating real-time (temporal resolution=1TR) beat-to-beat measures of velocity changes in the ascending and descending aorta. However, 1D-PC requires careful slice planning to avoid overlap of vessels in the projection direction, and thus may not be amenable to all vascular territories. Future studies evaluating PWV response to transient dynamic stimuli (e.g. exercise or pharmacologic stressors) may be possible with 1D-PC PWV.Acknowledgements
Supported by NIH/NCATS Colorado CTSA Grant Number UL1 TR002535, KL2 TR002534, and AHA Grant 853697.References
1. McDonald DA. Regional pulse-wave velocity in the arterial tree. J Appl Physiol. 1968;24:73-38.
2. Mitchell GF, Parise H, Benjamin EJ, Larson MG, Keyes MJ, Vita JA, Vasan RS, Levy D. Changes in arterial stiffness and wave reflection with advancing age in healthy men and women: the Framingham Heart Study. Hypertension. 2004;43:1239–1245.
3. The Reference Values for Arterial Stiffness' Collaboration. Determinants of pulse wave velocity in healthy people and in the presence of cardiovascular risk factors: “establishing normal and reference values.” European Heart Journal. 2010;31:2338–2350.
4. Langham MC, Li C, Wehrli FW. Non-triggered quantification of central and peripheral pulse-wave velocity. Journal of Cardiovascular Magnetic Resonance. 2011;13:81.
5. Vlachopoulos C, Aznaouridis K, Stefanadis C. Prediction of cardiovascular events and all-cause mortality with arterial stiffness: a systematic review and meta-analysis. JACC. 2010;55:1318–1327.
6. Enge D, Reusch JEB, Regensteiner JG, Schafer M, Hunter KS, Barker AJ, Nadeau KJ, Scalzo RL, Schauer IE, Abushamat L, Wipple MO, Rafferty D. Cardiovascular response to exercise in T2D. Diabetes. 2020: 69(Supplement 1; 182-LB).
7. Markl M, Wallis W, Strecker C, Gladstone BP, Vach W, Harloff A. Analysis of pulse wave velocity in the thoracic aorta by flow-sensitive four-dimensional MRI: reproducibility and correlation with characteristics in patients with aortic atherosclerosis. J Magn Reson Imaging. 2012;35:1162-1168.
8. Vulliémoz S, Stergiopulos N, Meuli R. Estimation of local aortic elastic properties with MRI. Magn Reson Med. 2002;47:649-54.
9. Mohiaddin RH, Firmin DN, Longmore DB. Age-related changes of human aortic flow wave velocity measured noninvasively by magnetic resonance imaging. J Appl Physiol. 1993;74:492-7.
10. Langham MC, Li C, Magland JF, Wehrli FW. Nontriggered MRI quantification of aortic pulse-wave velocity. Magn Reson Med. 2011;65:750–755.
11. Schafer M, Younoszai A, Truong U, Browne LP, Mitchell MB, Jaggers J, Campbell DN, Hunter KS, Ivy D, DiMaria MV. Influence of aortic stiffness on ventricular function inpatients with Fontan circulation. J Thorac Cardiovasc Surg. 2019;157:699-707.
12. Bock J, Kreher BW, Hennig J, Markl M. Optimized pre-processing of time-resolved 2D and 3D Phase Contrast MRI data. 15th Annual Meeting of ISMRM. Berlin, Germany: Abstract 3138; 2007.
13. Fielden SW, Fornwalt BK, Jerosch-Herold M, Eisner RL, Stillman AE, Oshinski JN. A new method for the determination of aortic pulse wave velocity using cross-correlation on 2D PCMR velocity data. J Magn Reson Imaging. 2008;27:1382-1387.
14. Laurent S, Cockcroft J, Van Bortel L, Boutouyrie P, Giannattasio C, Hayoz D, Pannier B, Vlachopoulos C, Wilkinson I, Struijker-Boudier H, on behalf of the European Network for Non-invasive Investigation of Large Arteries. Expert consensus document on arterial stiffness: methodological issues and clinical applications. Eur Heart Journal. 2006 (27):2588-2605.
15. Ibrahim ESH, Johnson KR, Miller AB, Shaffer JM, White RD. Measuring aortic pulse wave velocity using high-field cardiovascular magnetic resonance: comparison of techniques. JCMR. 2010 (12)26.
Figures