4866
Validation of Qp/Qs quantification based on 4D flow MRI: effects of scan acceleration techniques1Department of Radiology, Children's Hospital Colorado, University of Colorado Anschutz Medical Campus, Aurora, CO, United States, 2Department of Pediatrics, Children's Hospital Colorado, University of Colorado Anschutz Medical Campus, Aurora, CO, United States, 3Department of Bioengineering, University of Colorado Anschutz Medical Campus, Aurora, CO, United States
Synopsis
The ratio of pulmonary to systemic blood flow (Qp/Qs) is a clinically important index to estimate the existence and amount of cardiovascular shunt flow and to determine the need for surgical intervention for congenital heart disease patients. Accelerated 4D flow MRI is capable of measuring Qp/Qs in a single acquisition, but its accuracy and reliability are not well established. We compared conventional 2D phase-contrast MRI and two 4D flow MRI acquisitions with different acceleration techniques to investigate accuracy of Qp/Qs quantification with accelerated 4D flow in adult healthy volunteers (N=10). Consequently, we found no statistical differences in Qp/Qs.
INTRODUCTION
4D flow MRI is a promising tool to quantify cardiovascular whole heart hemodynamics1-3, allowing flow measurement at multiple locations in a single acquisition with retrospective plane placement. Recently developed acceleration techniques, such as compressed SENSE, enable shorter acquisition times4. However, overly aggressive scan time acceleration has been reported to result in errors when quantifying blood flow with 4D flow MRI4. For example, the image quality of highly accelerated sequences is known to be degraded by artifacts and/or lower SNR, which can contribute to measurement errors. Perhaps, the most challenging measurement used in the setting of congenital heart disease is the ratio of pulmonary to systemic blood flow (Qp/Qs), which is clinically used to quantify cardiovascular shunt flow and to determine the need for surgical intervention5. Since Qp/Qs requires integration and division of volumetric flow rates in both the ascending aorta (AAo) and main pulmonary artery (MPA) over a cardiac cycle, therefore systematic errors will be magnified. Thus, the aim of this study is to investigate the accuracy of Qp/Qs quantification using 4D flow MRI with varying acceleration rates. We hypothesize that aggressively accelerated 4D flow induces non-negligible errors in quantified Qp/Qs.METHODS
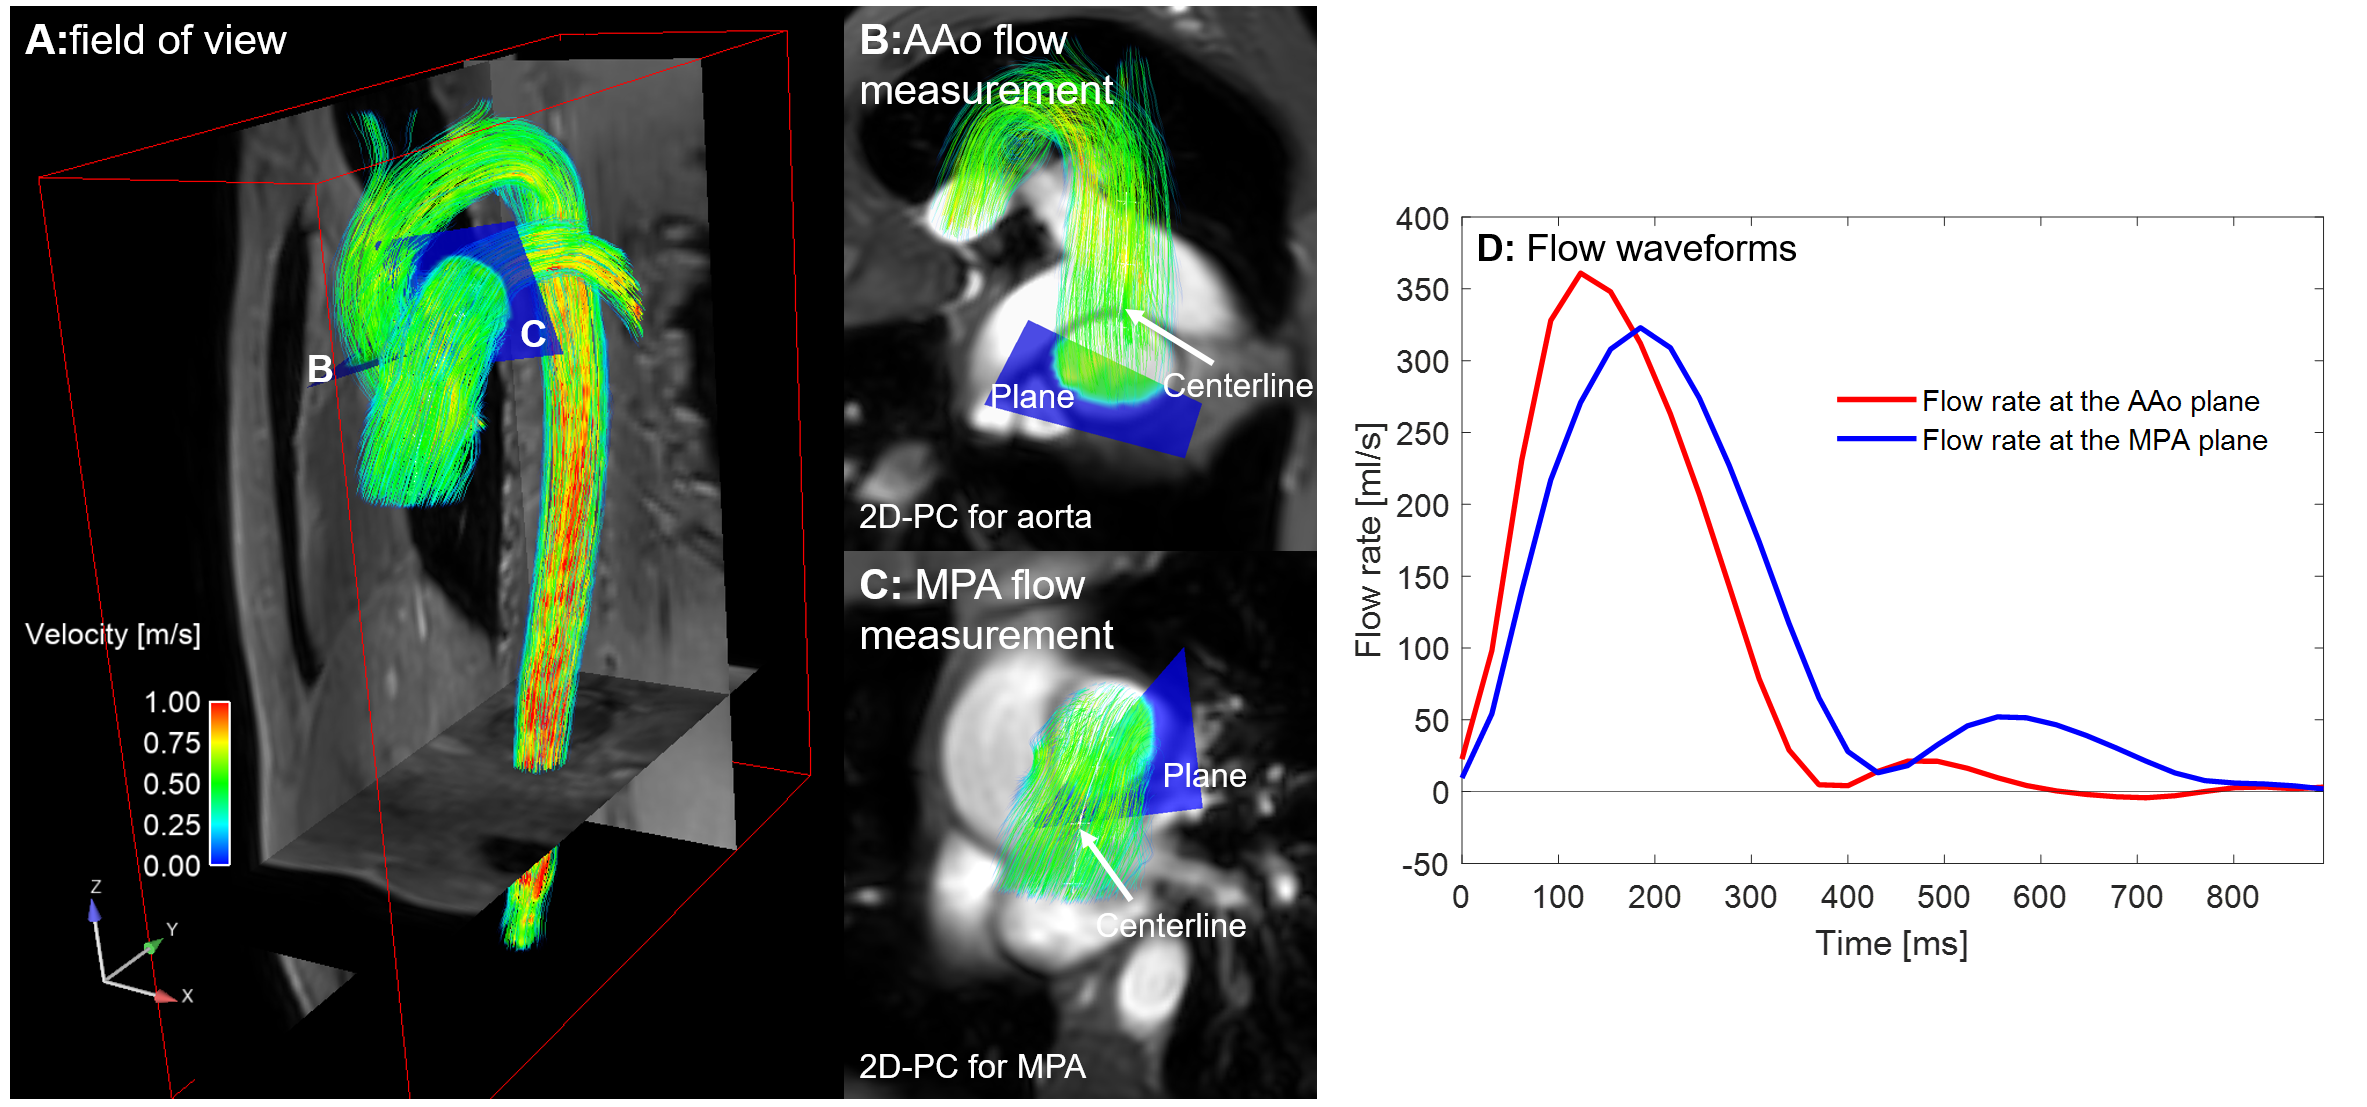
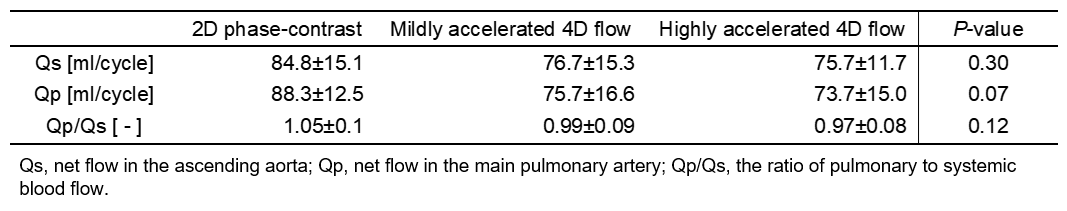
Ten healthy volunteers were prospectively recruited with written informed consent (Table 1). All participants were scanned with (1) 2D phase-contrast (2D-PC) for the AAo and MPA, (2) mildly accelerated, and (3) highly accelerated 4D flow sequences on a Philips Ingenia or Ingenia Elition X 3T (Philips Healthcare, Best, Netherland; Table1). For 2D-PC images, contours were manually delineated on the AAo and MPA cross-section in Circle (cvi 42; Circle Cardiovascular Imaging, Calgary, Alberta, Canada) to compute net flow in the AAo (Qs) and MPA (Qp) and were considered the gold standard measurement (Fig.1). 4D flow data were pre-processed to correct for eddy currents, mask background noise, and to compute a PC-MR angiography (PC-MRA) using custom MATLAB scripts6 (MATLAB R2019b, Natick, MA). Based on the PC-MRA, the aorta and pulmonary arteries were segmented using convolutional neural network (dense U-net7). The CNN-based segmentations were visually inspected, and any minor errors were manually corrected on 3D Slicer (open-source image processing software). Qs and Qp were quantified on Ensight (Ansys Inc., Canonsburg, PA). Quantification planes were specified on the centerlines manually delineated on the aorta and pulmonary artery segmentations. The quantification points were chosen so that they are as close to the 2D-PC planes as possible (Fig. 2). Qs, Qp, and Qp/Qs were compared between 2D-PC and the two 4D flow sequences using a one-way ANOVA with a significance level of 0.05. Bland-Altman plots was made for Qp/Qs. MATLAB was used for statistical analysis.RESULTS
Flow quantification results are summarized in Table 2. Mean scan times for 4D flow acquisitions were 9:01±1:45min (mild acceleration) and 3:53±0:50min (high acceleration) (P<0.001). No significant differences were found for Qs (mean: 84.8, 76.7, and 75.7 for 2D-PC, mild, and high accelerated 4D flow; P=0.30), Qp (mean: 88.3, 75.7, and 73.7; P=0.07), and Qp/Qs (mean: 1.05, 0.99, and 0.97, P=0.12). Bland-Altman plot (Fig. 3) did not detect any significant bias and limits of agreements with 95% confidence intervals (CIs) for bias of [-0.04- 0.16] (2D-PC vs. mild acceleration), [-0.01- 0.18] (2D-PC vs. high acceleration), and [-0.05- 0.09] (mild vs. high acceleration). The subject with the largest bias (0.37) in Qp/Qs between 2D-PC and highly accelerated 4D flow (Fig.3B) had remarkable underestimation in Qp by 19.3ml/cycle.DISCUSSION
No significant differences were found in any of the flow measurements between 2D-PC and the 4D flow acquisitions, even with highly accelerated 4D flow that resulted in an average scan time decrease of 57% compared to the mild acceleration. There was a non-significant trend for the 4D flow measurements to have lower mean values for Qs. This could possibly be due to the impact of difference in temporal resolution, vessel motion (which was not taken into account in flow quantification by 4D flow because of static 3D segmentation), or larger slice thickness of 2D-PC (8mm vs. 1.5-3mm in 4D flow). Despite no statistical significance in flow quantification, some flow metrics, such as Qp (three-group comparison) and Qp/Qs (95% CI of bias between 2D-PC and highly accelerated 4D flow), trended toward significance. These results suggest a potential underestimation for the Qp and Qp/Qs quantified by mildly and/or highly accelerated 4D flow. A larger population study is necessary to ensure the validity of highly accelerated 4D flow for Qp/Qs quantification and to evaluate other sequence modifications that may improve Qp and Qs accuracy with 4D flow (e.g., using higher acquisition temporal resolution for 4D flow).CONCLUSION
Contrary to our hypothesis, we did not find significant effects of acceleration factors/technique on Qp/Qs quantification in this study cohort (N=10, healthy adult volunteers). Future focus will be on increasing the number of volunteers and apply this study design to pediatric patients to figure out an optimal balance of scan time and accuracy in clinical flow quantification.Acknowledgements
No acknowledgement found.References
1. Rizk J. 4D flow MRI applications in congenital heart disease. Eur Radiol 2021;31:1160-1174. doi:10.1007/s00330-020-07210-z
2. Jacobs KG, Chan FP, Cheng JY, Vasanawala SS, Maskatia SA. 4D flow vs. 2D cardiac MRI for the evaluation of pulmonary regurgitation and ventricular volume in repaired tetralogy of Fallot: a retrospective case control study. Int J Cardiovasc Imaging 2020;36:657-669. doi:10.1007/s10554-019-01751-1
3. Isorni MA, Moisson L, Moussa NB, et al. 4D flow cardiac magnetic resonance in children and adults with congenital heart disease: Clinical experience in a high volume center. Int J Cardiol 2020;320:168-177. doi:10.1016/j.ijcard.2020.07.021
4. Neuhaus E, Weiss K, Bastkowski R, Koopmann J, Maintz D, Giese D. Accelerated aortic 4D flow cardiovascular magnetic resonance using compressed sensing: applicability, validation and clinical integration. J Cardiovasc Magn Reason 2019;21:65. doi:10.1186/s12968-019-0573-0
5. Vasanawala SS, Hanneman K, Alley MT, Hsiao A. Congenital heart disease assessment with 4D flow MRI. J Magn Reson Imaging 2015;42:870-886. doi:10.1002/jmri.24856
6. Bock J, Kreher B, Hennig J, Markl M. Optimized pre-processing of time-resolved 2D and 3D phase contrast MRI data. Proceedings of 15th Annual Meeting of International Society for Magnetic Resonance in Medicine 2007;3138.
7. Berhane H, Scott M, Elbaz M, et al. Fully automated 3D aortic segmentation of 4D flow MRI for hemodynamic analysis using deep learning. Magn Reson Med 2020;84:2204-2218. doi:10.1002/mrm.28257
Figures