4865
Vortex ring reveals a novel non-invasive hemodynamic biomarker associated with the location of maximum pressure drop in arterial stenosis1Electrical and Computer Engineering, University of Louisville, Louisville, KY, United States, 2Robley Rex VA Medical Center, Louisville, KY, United States, 3Cardiovascular Division, University of Louisville, Louisville, KY, United States
Synopsis
We propose vortex ring as a new indicator of the location of maximum pressure drop along a phantom model of arterial stenosis. We investigated details of the flow structure of post stenotic jet with presence of the vortex ring in stenotic phantoms with 87% reduction in area using CFD velocities and 4D flow MRI. The pressure, velocity, and vorticity fields were quantitatively analyzed with the presence of the vortex ring in the spatiotemporal domains. It was found that the location of the vortex ring is associated with the location of the maximum pressure drop, axial velocity, and vorticity magnitude.
Introduction
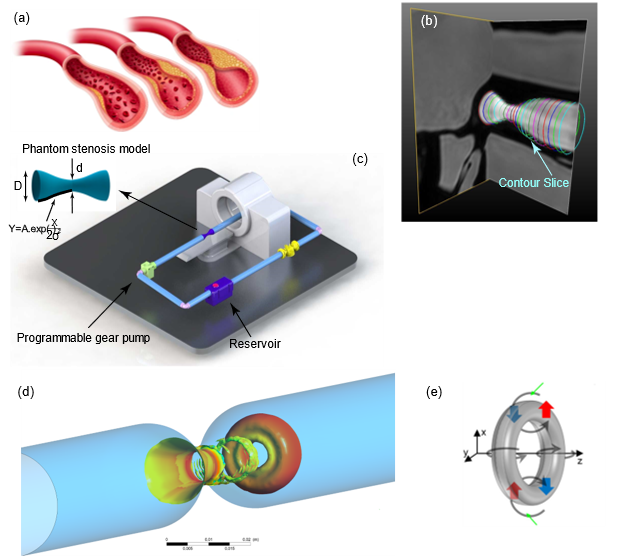
4D flow MRI has been used to investigate time-resolved, three-directional phase-contrast magnetic resonance imaging (PC-MRI) to explore various hemodynamic features in the heart and blood vessels1,2. This imaging technique has been successfully utilized to visualize streamlines and pathlines based on time-resolved 3D velocity data3. Several hemodynamic indices quantitatively measured using 4D flow MRI have been introduced to assist diagnoses, including wall shear stress distribution4,5, vortex of blood flow in pulmonary artery6, and vortex ring in the left ventricle7. However, significance of vortex ring evolution on the location and severity of arterial stenosis has not been well understood.In this paper, we propose using vortex ring (Figure 1(d)) to identify the location of maximum pressure drop using full-field data for 4D flow MRI and CFD data. We used 4D flow MRI to obtain the flow waveform used as velocity inlet boundary condition for CFD simulations. Due to the lower achievable resolutions for 4D flow MRI compared to CFD, we used the CFD simulations to visualize vortex structure. We obtain velocity and pressure field in an 87% area stenosis flow phantom model and compare pressure with those obtained with Generalized Bernoulli equation (GBE) using pathlines and streamlines and Reduced Bernoulli Equation (RBE), and Simple Bernoulli Equation (SBE). The results are compared with CFD data utilizing Large Eddy Simulation (LES) in an identical in-silico model of the physical flow phantom.
Methods
CFD
We conducted Computational Fluid Dynamics (CFD) simulations for pulsatile flows utilizing ANSYS FLUENT to solve the Navier Stokes equations8 through the finite volume method in an identical geometry and identical flow waveform to the in-vitro studies 9,10 (Figures 1(c)). The Large-Eddy Simulation (LES) method was employed to model the turbulence. The walls were considered rigid with no-slip conditions. An extended length of two diameters proximal to the stenosis inlet and a post stenotic length of ten diameters was considered distal to the stenosis. For CFD simulation, a parabolic velocity profile was obtained by fitting Fourier series with nine terms to the MRI pulsatile flow waveforms applied at the inlet of the phantom model as the velocity inlet boundary condition.4D flow MRI
MRI experiments were performed on an MR-compatible flow circuit9,10. The idealized rigid phantom model was machined from transparent acrylic, initially specified at 90% area occlusion (Figure 1(c)). The flow circuit was filled with blood-mimicking fluid comprised of 60% distilled water and 40% glycerol. This resulted in a dynamic viscosity of 0.0043 Pa.s, and a density of 1035 $$$\frac{kg}{m^3}$$$ consistent with human blood flow properties. The blood mimicking fluid was driven by a custom-made programmable pump (LB-Engineering, Berlin, Germany) (Figure 1(c)) that could create steady and pulsatile flows up to a peak flow rate of 400 $$$\frac{ml}{s}$$$. Field of view was $$$100×100×60 mm $$$ , spatial resolution $$$ 1.56×1.56×3 mm $$$, matrix size of $$$ 64×64 $$$ and venc velocity of $$$450 \frac{cm}{s}$$$. Slice contours (Figure 1(b)) were masked around the boundary of the phantom model. Subsequently, flow waveforms were calculated as a function of time at multiple cross-sections along the phantom model passing through each contour. In the next step, the flow waveforms were averaged with respect to distance (z) to set a fully developed velocity profile.Results and Discussion
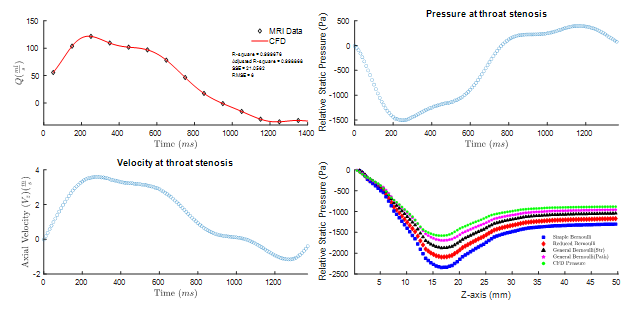
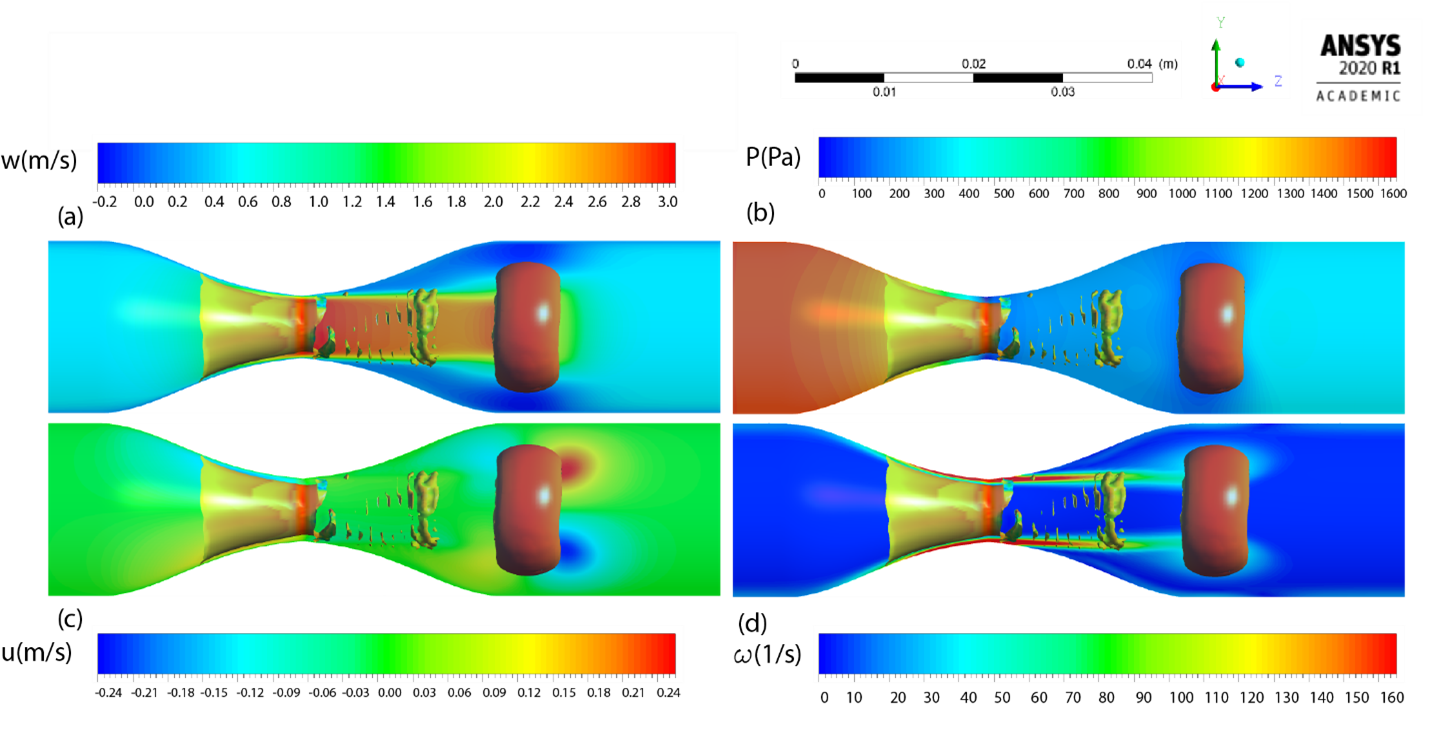
Figure 2 (a) compares flow waveform for $$$ Q_{max}=130 \frac{ml}{s} $$$ during a cardiac cycle computed from CFD and 4D flow MRI. Note that reverse flow was observed in the diastolic phase of the cardiac cycle due to the tube compliance and viscous energy loss in the connecting tube, pipes, and connections. Pressure waveform and temporal variation of velocity at throat stenosis point ($$$ x=y=z=0 $$$) are depicted in Figure 2 (b) and (c), respectively. Further, we assessed the spatial variation of pressure using GBE and compared it with SBE and RBE3.In the CFD simulations, a vortex ring was formed during the diastolic phase of the cardiac cycle based on the flow waveform (Figure 2(a)). The vortex includes a donuts shape vortex ring that is detached from the stenosis (Figure 3) and moves along the stenotic phantom. We showed the spatiotemporal evolution of the vortex ring distal to the stenosis with Q-criterion8 and presented the vortex relocation along the phantom model of arterial stenosis during the cardiac cycle8. Here, we show the vortex ring immediately after the peak systolic timepoint and spatial variation of hemodynamic parameters in a sagittal $$$(Y-Z)$$$ plane in the middle of the vortex ring (Figure 3). The location of the vortex ring is associated with the location of the maximum axial velocity (Figure 3(a)), and pressure drop (Figure 3(b)). Moreover, the transverse velocity (u) with negative and positive values emerged near the position of the vortex ring (Figure 3(c)). For vorticity field, the maximum value of $$$160 \frac{1}{s}$$$ was observed at the stenosis region, however; two swirling vortices with a similar vorticity value detached from the stenosis and traveled along with the vortex ring (Figure 3(d)).
Conclusion
Since the location of the highest pressure drop and velocity matches that of the vortex ring core, we conclude that the pressure distribution across the stenosis can be predicted by the location of vortex rings found at the decelerating phase of flow waveform distal to the stenosis.Acknowledgements
This work was supported by the National Institute of Health with contract grant number: 5R21HL132263.References
1. Markl M, Frydrychowicz A, Kozerke S, Hope M, Wieben O. 4D flow MRI. J Magn Reson Imaging. 2012;36(5):1015-1036. doi:10.1002/jmri.23632
2. Michael M, Philip K, Tino E. Comprehensive 4D velocity mapping of the heart and great vessels by cardiovascular magnetic resonance. J Cardiovasc Magn Reson. 2011;13(7):1-22. http://www.doaj.org/doaj?func=abstract&id=704300.
3. Kazemi A, Padgett DA, Nath R, Callahan S, Negahdar MJ. Pressure Estimation from 4D Flow MRI Using Generalized Bernoulli Equation in a Phantom Model of Arterial Stenosis. :1-16. (under review)
4. Harloff A, Nußbaumer A, Bauer S, et al. In vivo assessment of wall shear stress in the atherosclerotic aorta using flow-sensitive 4D MRI. Magn Reson Med. 2010;63(6):1529-1536. doi:10.1002/mrm.22383
5. Frydrychowicz A, Berger A, Russe MF, et al. Time-resolved magnetic resonance angiography and flow-sensitive 4-dimensional magnetic resonance imaging at 3 Tesla for blood flow and wall shear stress analysis. J Thorac Cardiovasc Surg. 2008;136(2):400-407. doi:10.1016/j.jtcvs.2008.02.062
6. Reiter G, Reiter U, Kovacs G, et al. Magnetic Resonance–Derived 3-Dimensional Blood Flow Patterns in the Main Pulmonary Artery as a Marker of Pulmonary Hypertension and a Measure of Elevated Mean Pulmonary Arterial Pressure. Circ Cardiovasc Imaging. 2008;1(1):23-30. doi:10.1161/CIRCIMAGING.108.780247
7. Gharib M, Rambod E, Kheradvar A, Sahn DJ, Dabiri JO. Optimal vortex formation as an index of cardiac health. Proc Natl Acad Sci U S A. 2006;103(16):6305-6308. doi:10.1073/pnas.0600520103
8. Kazemi A, Nath R, Negahdar MJ, Stodddard M, Amini AA. 4D flow MRI and CFD simulations of pulsatile flow in a phantom model of arterial stenosis: visualizing the vortex dynamics. SPIE Medical Imaging 2021;(February):51. doi:10.1117/12.2582312
9. Negahdar M, Kadbi M, Kendrick M, Stoddard MF, Amini AA. 4D spiral imaging of flows in stenotic phantoms and subjects with aortic stenosis. Magn Reson Med. 2016;75(3):1018-1029. doi:10.1002/mrm.25636
10. Callahan S, Singam NS, Kendrick M, et al. Dual-Venc acquisition for 4D flow MRI in aortic stenosis with spiral readouts. J Magn Reson Imaging. 2020;52(1):117-128. doi:10.1002/jmri.27004
Figures