4863
Dynamic Contrast Enhanced (DCE) MRI of the Abdominal Aortic Aneurysm (AAA) Wall1Department of Radiology and Biomedical Imaging, University of California San Francisco, San Francisco, CA, United States, 2Department of Radiology, University of Washington, Seattle, WA, United States
Synopsis
Abdominal Aortic Aneurysms (AAAs) are common in older men. Guidelines recommend repair at an aneurysm diameter greater than 5.5 cm, but some smaller aneurysms experience catastrophic rupture. Aneurysm features beyond diameter have been explored as markers of disease progression. We used DCE MRI to explore the inhomogeneity of contrast kinetics, including Ktrans, in the aneurysm wall and assess if these markers independently predict AAA progression. Significant differences in DCE metrics were identified around the AAA circumference. Area under enhancement-time curve and enhancement slope correlated with growth rate but not diameter, suggesting that DCE may provide diameter-independent information regarding AAA risk.
Introduction
AAA, a dilatation of the abdominal aorta to greater than 3cm diameter, has a pooled global prevalence of 4.8%1. Unrepaired AAAs sometimes progress to rupture, which has 80–90% mortality2. AAA maximum diameter (Dmax) remains the best-known predictor of rupture risk and is used to time elective repair. Nonetheless, 40% of ruptured AAAs are below repair thresholds at last surveillance3. AAA wall microvasculature has been identified as a source of inflammatory cells and matrix metalloproteinases that lead to loss of wall strength and AAA progression4. Dynamic contrast enhanced (DCE) MRI, which quantifies the uptake of gadolinium-based contrast agent in tissue, has been previously used to quantify vessel wall microvascular density in carotid artery atherosclerosis5. Our hypothesis is that increased mural contrast uptake, associated with increased microvascular density, is related to mural inflammation and aneurysm progression. Previous studies have shown that quantitative AAA DCE MRI analyses are feasible and reproducible6 but treated the entire AAA wall circumference as homogeneous, which is inconsistent with the localized nature of mural inflammation7. The purpose of this study was to assess the inhomogeneity of AAA wall DCE parameters by wall quadrants, and explore the association with both AAA maximum diameter and AAA growth rate.Methods
25 DCE scans were acquired at 3T in 19 AAA subjects using a 3D fast gradient-echo (Star-VIBE) sequence. Key acquisition parameters were: 5mm slice thickness, 1.5mm in-plane resolution, 13-15s temporal resolution, with a total of 21-30 phases. Two axial slices were selected for analysis per patient. AAA wall voxels were analyzed to obtain Ktrans using the Tofts pharmacokinetic model, as well as integrated enhancement as the area under the enhancement-time curve (AUC) and initial slope of the normalized relative wall enhancement curve. For AUC and enhancement slope, the peak AAA lumen mean relative enhancement was used as a normalization factor to account for the inter-subject variation of contrast concentration. DCE metrics were averaged around the entire AAA circumference as well as over each of its four quadrants (left/anterior/right/posterior). AAA growth rate was retrospectively estimated from each subject’s surveillance exams (MRI or CT) over the preceding 2 years, using the average of AAA maximal diameters measured by two independent reviewers. Pearson’s correlation was used to assess the association of Dmax and aneurysm growth rate with the above-described AUC, slope and Ktrans.Results
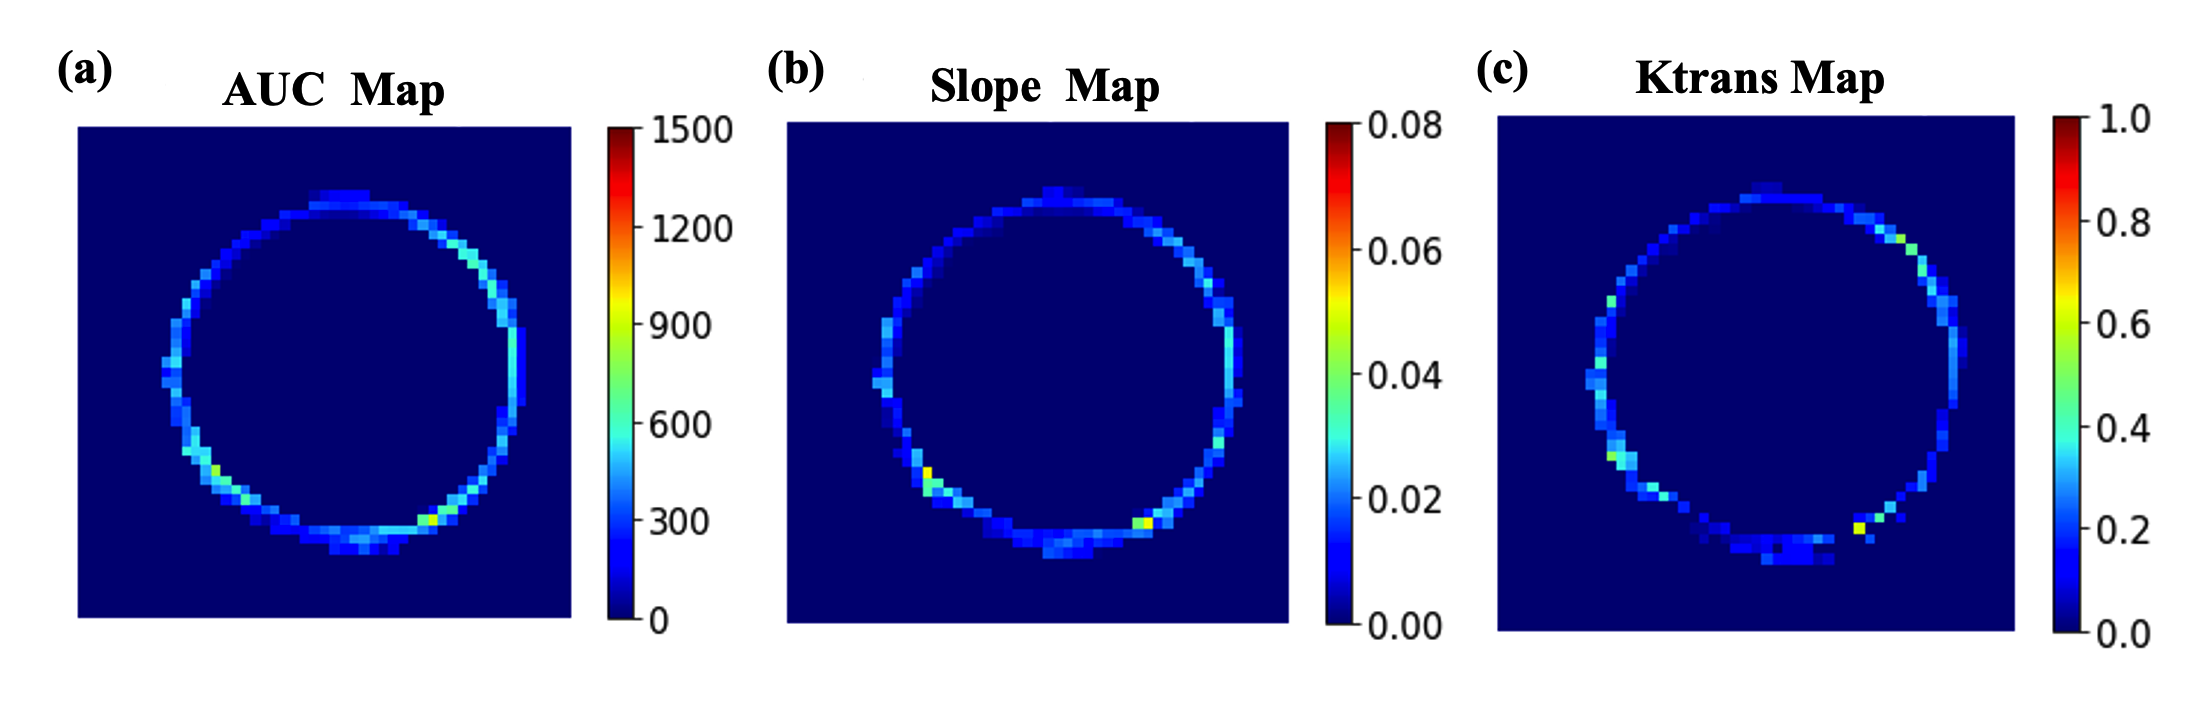
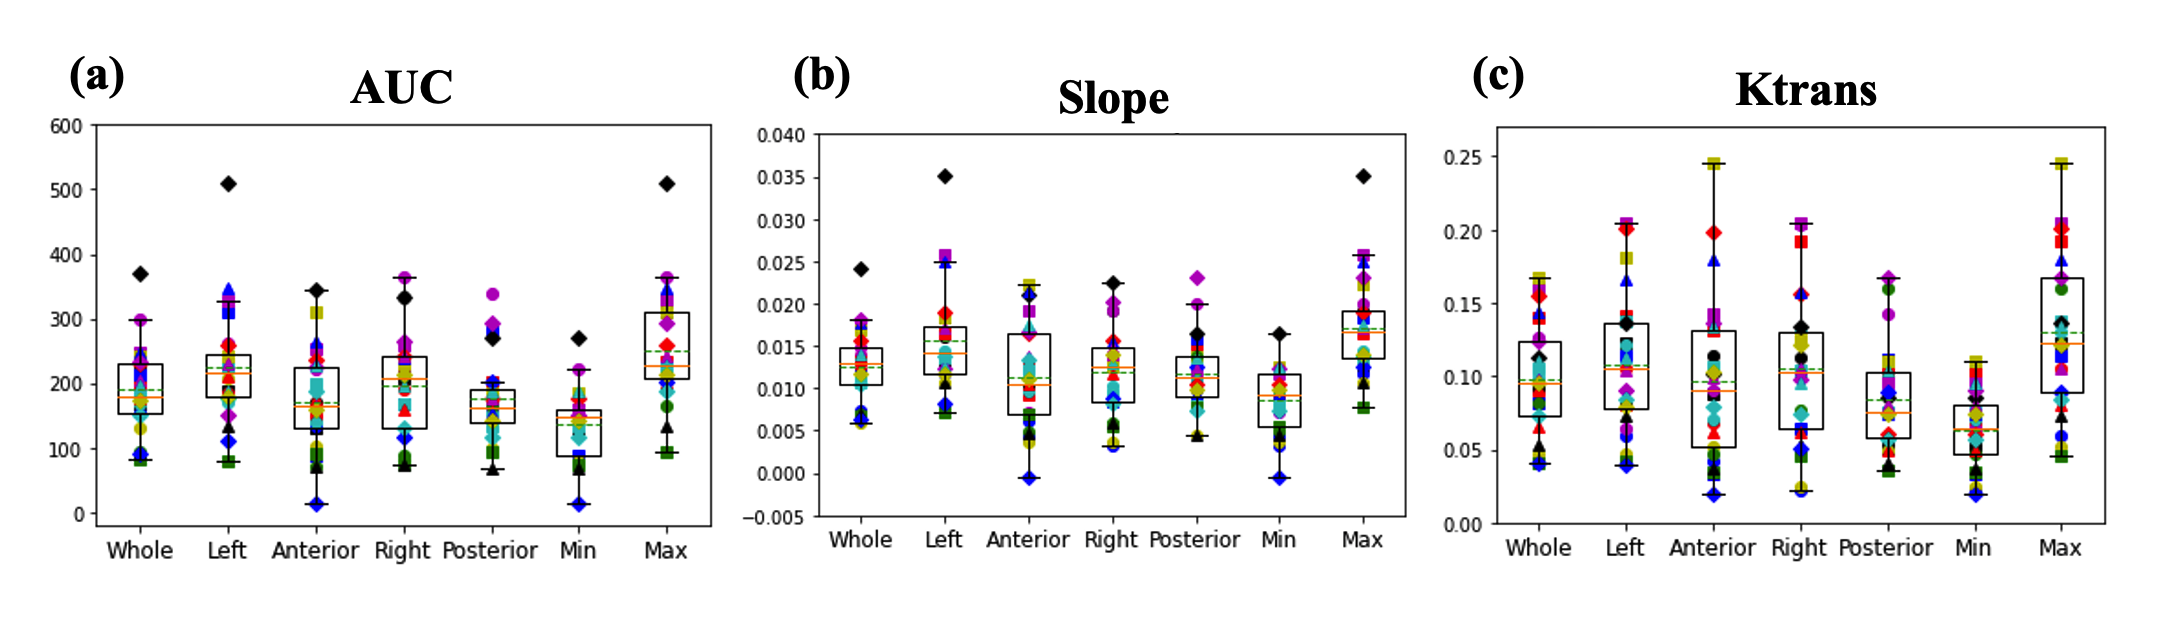
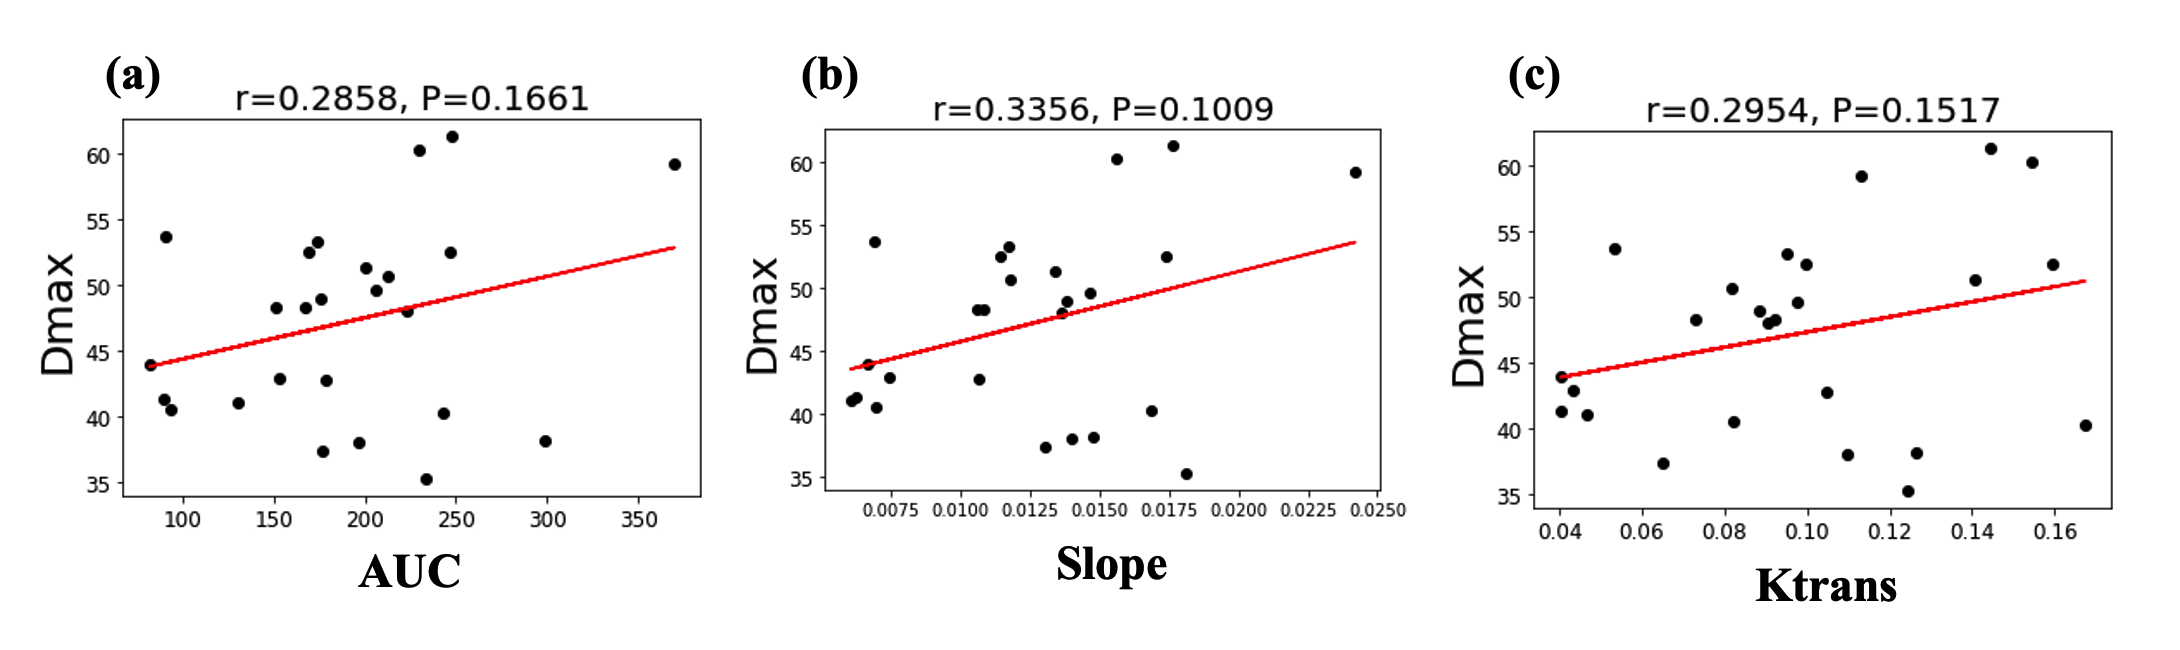
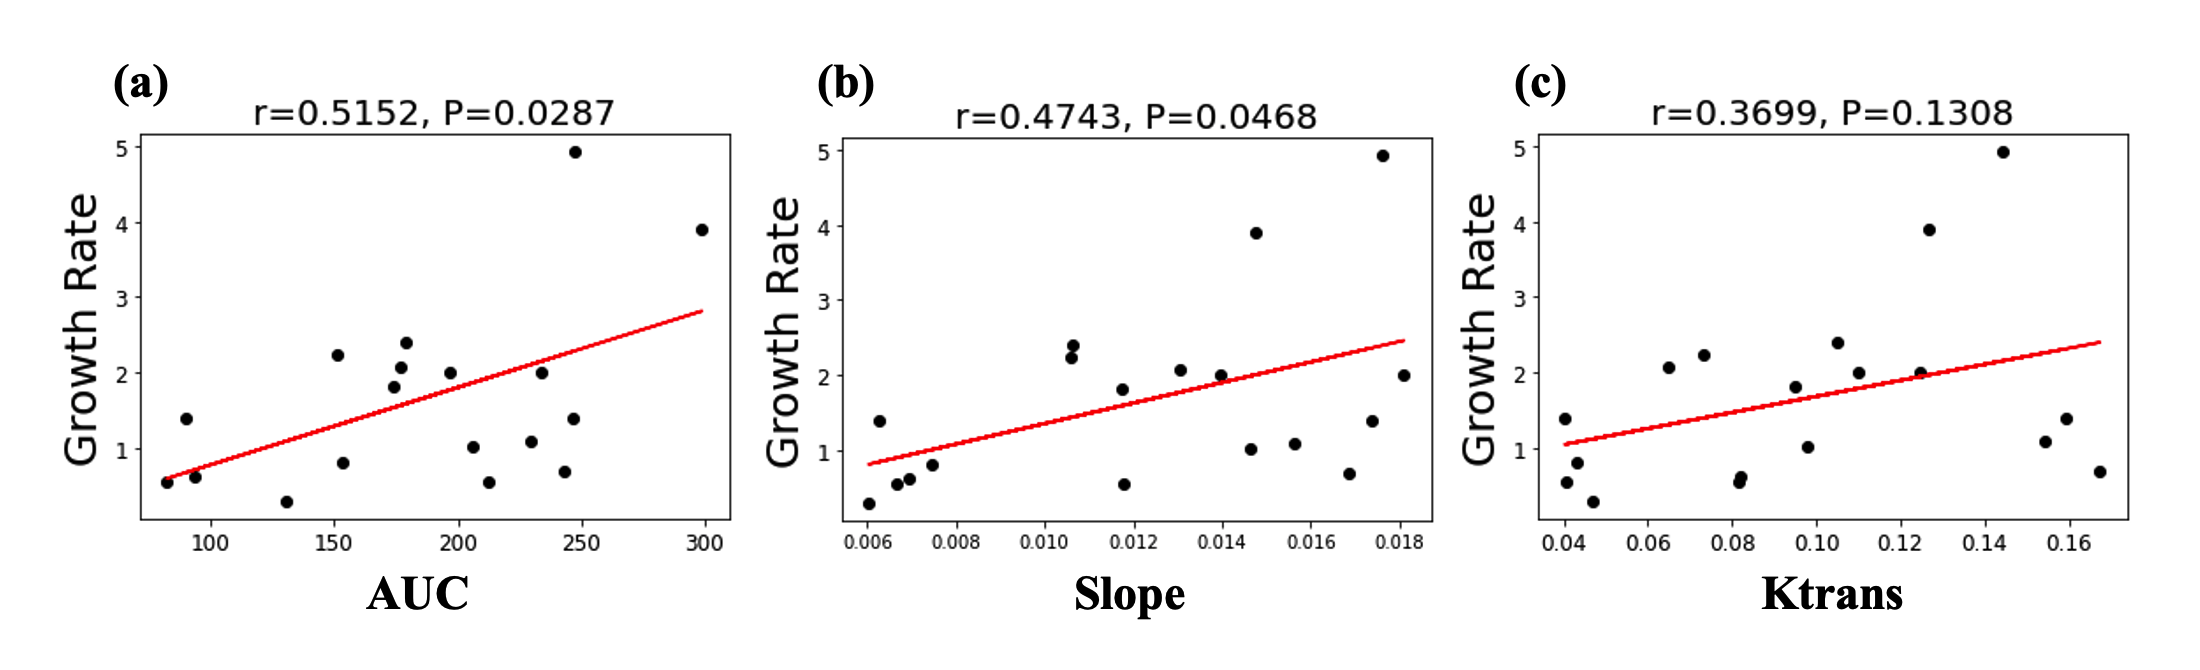
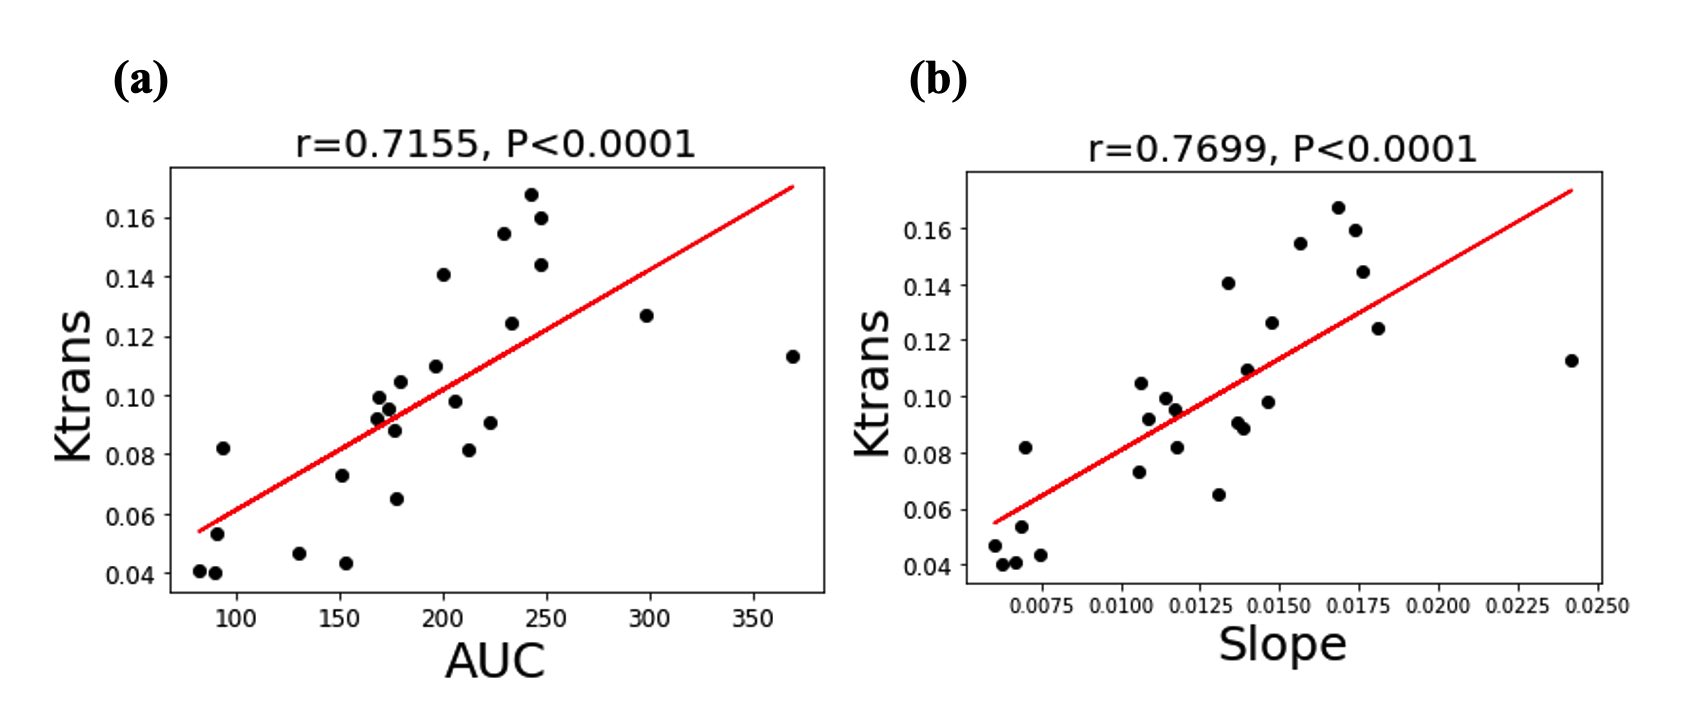
Figure 1 (a)-(c) shows the mean normalized wall relative enhancement AUC, slope (after contrast arrival) and Ktrans maps, respectively. An uneven distribution of AUC, slope and Ktrans over the circumference of the AAA wall is evident. Figure 2 (a)-(c) shows the wall AUC, slope and Ktrans boxplots respectively. All DCE MRI parameters varied significantly between subjects, both when measured over the entire wall and for individual quadrants. Furthermore, DCE metrics varied significantly (p<0.0001) over different wall quadrants for each individual subject, as can be seen in the per-subject quadrant minima and maxima (last two columns in Figure 2 (a)-(c)). Interestingly, the left quadrant exhibited faster (slope) and stronger (AUC) contrast uptake, and had higher microvascular permeability (Ktrans) than other quadrants. Figure 3 (a)-(c) shows the Pearson correlations of the wall AUC, slope and Ktrans with AAA Dmax, all were weak but not statistically significant. Figure 4 (a)-(c) show the Pearson correlations of the wall AUC, slope and Ktrans with the AAA growth rate. Although the AAA growth rate did not significantly correlate with Ktrans, its correlations with the wall AUC and slope were significant. Figure 5 (a) and (b) show the Pearson correlations of the wall AUC, slope with the Ktrans. Both wall AUC and slope significantly correlated with the Ktrans.Discussion
DCE MRI was applied to study the differential contrast uptake around the circumference of the AAA wall and associate it to AAA diameter and growth rate. The left quadrant of the AAAs exhibited faster, stronger contrast uptake, and relatively greater microvascular permeability, as quantified by Ktrans. The latter suggests increased inflammatory microvasculature in the aneurysm wall. This appears to be in agreement with the site where AAA rupture is most commonly observed, namely the left posterolateral wall. Enhancement AUC and slope significantly correlated to AAA growth rate but not to AAA maximum diameter.Conclusion
Our study of contrast kinetics in AAA revealed spatially inhomogeneous enhancement and suggests that DCE metrics may provide diameter-independent information on AAA progression.Acknowledgements
VA Merit Award: CX-002071-01A1.References
1. Koch, Alisa E., G. Kenneth Haines, Robert J. Rizzo, James A. Radosevich, Richard M. Pope, Philip G. Robinson, and William H. Pearce. "Human abdominal aortic aneurysms. Immunophenotypic analysis suggesting an immune-mediated response." The American journal of pathology 137, no. 5 (1990): 1199.
2. Bengtsson, Henrik, and David Bergqvist. "Ruptured abdominal aortic aneurysm: a population-based study." Journal of vascular surgery 18, no. 1 (1993): 74-80.
3. Ahmad, Mehtab, Rakesh Mistry, James Hodson, and Andrew W. Bradbury. "How quickly do asymptomatic infrarenal abdominal aortic aneurysms grow and what factors affect aneurysm growth rates? Analysis of a single centre surveillance cohort database." European Journal of Vascular and Endovascular Surgery 54, no. 5 (2017): 597-603.
4. Reeps, Christian, Jaroslav Pelisek, Stefan Seidl, Tibor Schuster, Alexander Zimmermann, Andreas Kuehnl, and Hans-Henning Eckstein. "Inflammatory infiltrates and neovessels are relevant sources of MMPs in abdominal aortic aneurysm wall." Pathobiology 76, no. 5 (2009): 243-252.
5. Kerwin, William S., Kevin D. O'Brien, Marina S. Ferguson, Nayak Polissar, Thomas S. Hatsukami, and Chun Yuan. "Inflammation in carotid atherosclerotic plaque: a dynamic contrast-enhanced MR imaging study." Radiology 241, no. 2 (2006): 459-468.
6. Nguyen, V. Lai, Walter H. Backes, M. Eline Kooi, Mirthe CJ Wishaupt, Femke AMVI Hellenthal, E. Marielle H. Bosboom, Rob J. van der Geest, Geert Willem H. Schurink, and Tim Leiner. "Quantification of abdominal aortic aneurysm wall enhancement with dynamic contrast‐enhanced MRI: feasibility, reproducibility, and initial experience." Journal of Magnetic Resonance Imaging 39, no. 6 (2014): 1449-1456.
7. MA3RS Study Investigators, David Newby, Rachael Forsythe, Olivia McBride, Jennifer Robson, Alex Vesey, Roderick Chalmers et al. "Aortic wall inflammation predicts abdominal aortic aneurysm expansion, rupture, and need for surgical repair." Circulation 136, no. 9 (2017): 787-797.
Figures