4862
Assessment of arterial pulsatility of cerebral perforating arteries using 7T high-resolution dual-VENC phase-contrast MRI1USC Mark and Mary Stevens Neuroimaging and Informatics Institute, Keck School of Medicine, University of Southern California, Los Angeles, CA, United States, 2Siemens Medical Solutions USA, Inc., Los Angeles, CA, United States, 3Department of Neurology, Keck School of Medicine, University of Southern California, Los Angeles, CA, United States
Synopsis
A dual VENC strategy was applied in 2D high-resolution phase-contrast MRI to improve the sensitivity of arterial pulsatility measurement in cerebral perforating arteries at 7T. Compared to a single VENC of 40cm/s, significant increase in the number of detected perforators was observed using a dual-VENC approach with VENC of 20cm/s and 40cm/s. Reproducibility of arterial pulsatility measurement in perforating arteries was evaluated in test-retest experiments. Good agreement was achieved between test-retest pulsatility measurements.
Introduction
Small vessel disease (SVD) refers to pathological changes in cerebral perforating arteries that play an essential role in maintaining the metabolic activities of deep brain nuclei1. Dysfunction of perforating arteries is associated with lacunar infarcts, basal ganglia hemorrhages, and deep microbleeds. Arterial pulsatility has emerged as a useful index of vascular dysfunction. Direct assessment of the pulsatility of perforating arteries could offer valuable insight into the role of vascular dysfunction in the pathogenesis of SVD. However, it is very challenging to directly image cerebral perforating arteries (<0.5mm) on conventional 1.5 and 3T MRI systems due to the small vessel size. Recent 7T studies have demonstrated the feasibility of detecting flow hemodynamics of perforating arteries using high-resolution phase-contrast MRI3. However, the number of perforators is often underestimated given some perforators have extremely small diameters and low flow velocities. In this study, we proposed a dual-VENC strategy to improve the perforator detection and avoid the effects of phase wrapping, thus improving the sensitivity and reliability of perforating artery assessment. The effect of temporal resolution on the perforator detection was also evaluated.Methods
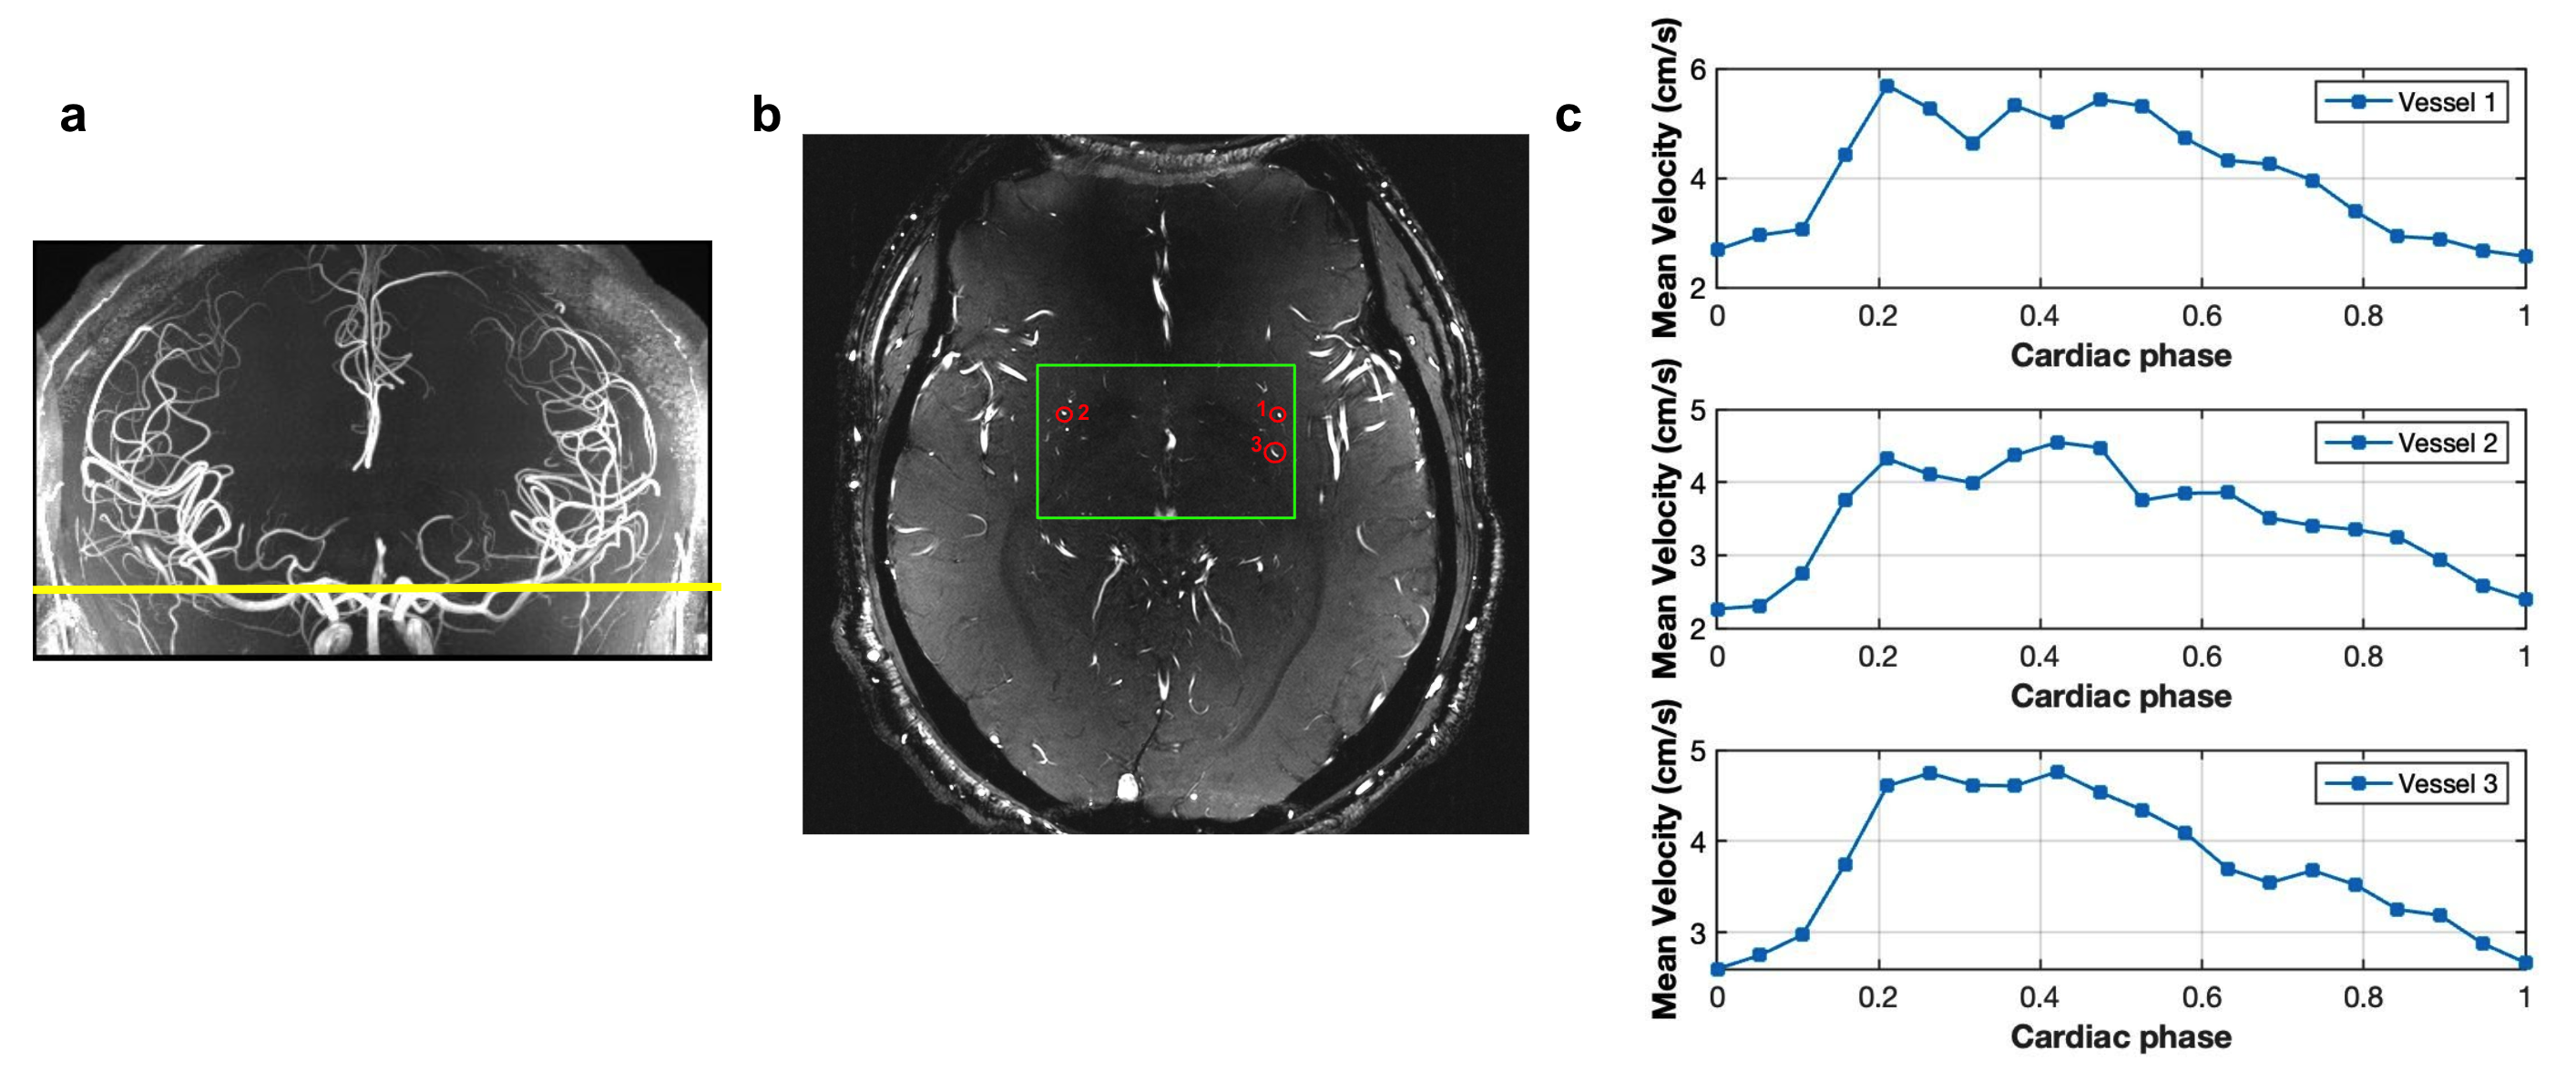
All experiments were performed on a 7T MRI MAGNETOM Terra (Siemens Healthcare, Erlangen, Germany) with an 8-transmit/32-receive head coil (Nova Medical, Wilmington, MA). Retrospective gated single-slice 2D phase-contrast MRI sequences with VENC of 20 cm/s and 40 cm/s were acquired on 5 participants (age: 33.6 ± 18.4 years). The other image parameters included: FOV= 180x200 mm2, slice thickness= 2 mm, voxel size= 0.2x0.2x2.0 mm, flip angle=50°, real temporal resolution= 126.72 mm, 20 phases across a cardiac cycle. A 3D high-resolution TOF was performed on each subject prior to PC-MRI scans to locate the perforating arteries (Figure 1a). Test-retest PC-MRI scans were performed to evaluate the reproducibility of arterial pulsatility measurement. Image processing included the following steps:1) Generate Maximum Intensity Projection (MIP) Image across cardiac phases from the phase-contrast magnitude images.
2) Manually identify the perforating arteries in the basal ganglia region on the MIP image with VENC of 20 cm/s.
3) Correct the phase offset by using a median filter on the mean phase image over a cardiac cycle and subtract this mean phase image from every phase image.
4) Apply the perforator mask to the magnitude and phase images of VENC = 40cm/s.
5) Use higher VENC data to anti-alias lower VENC phase data
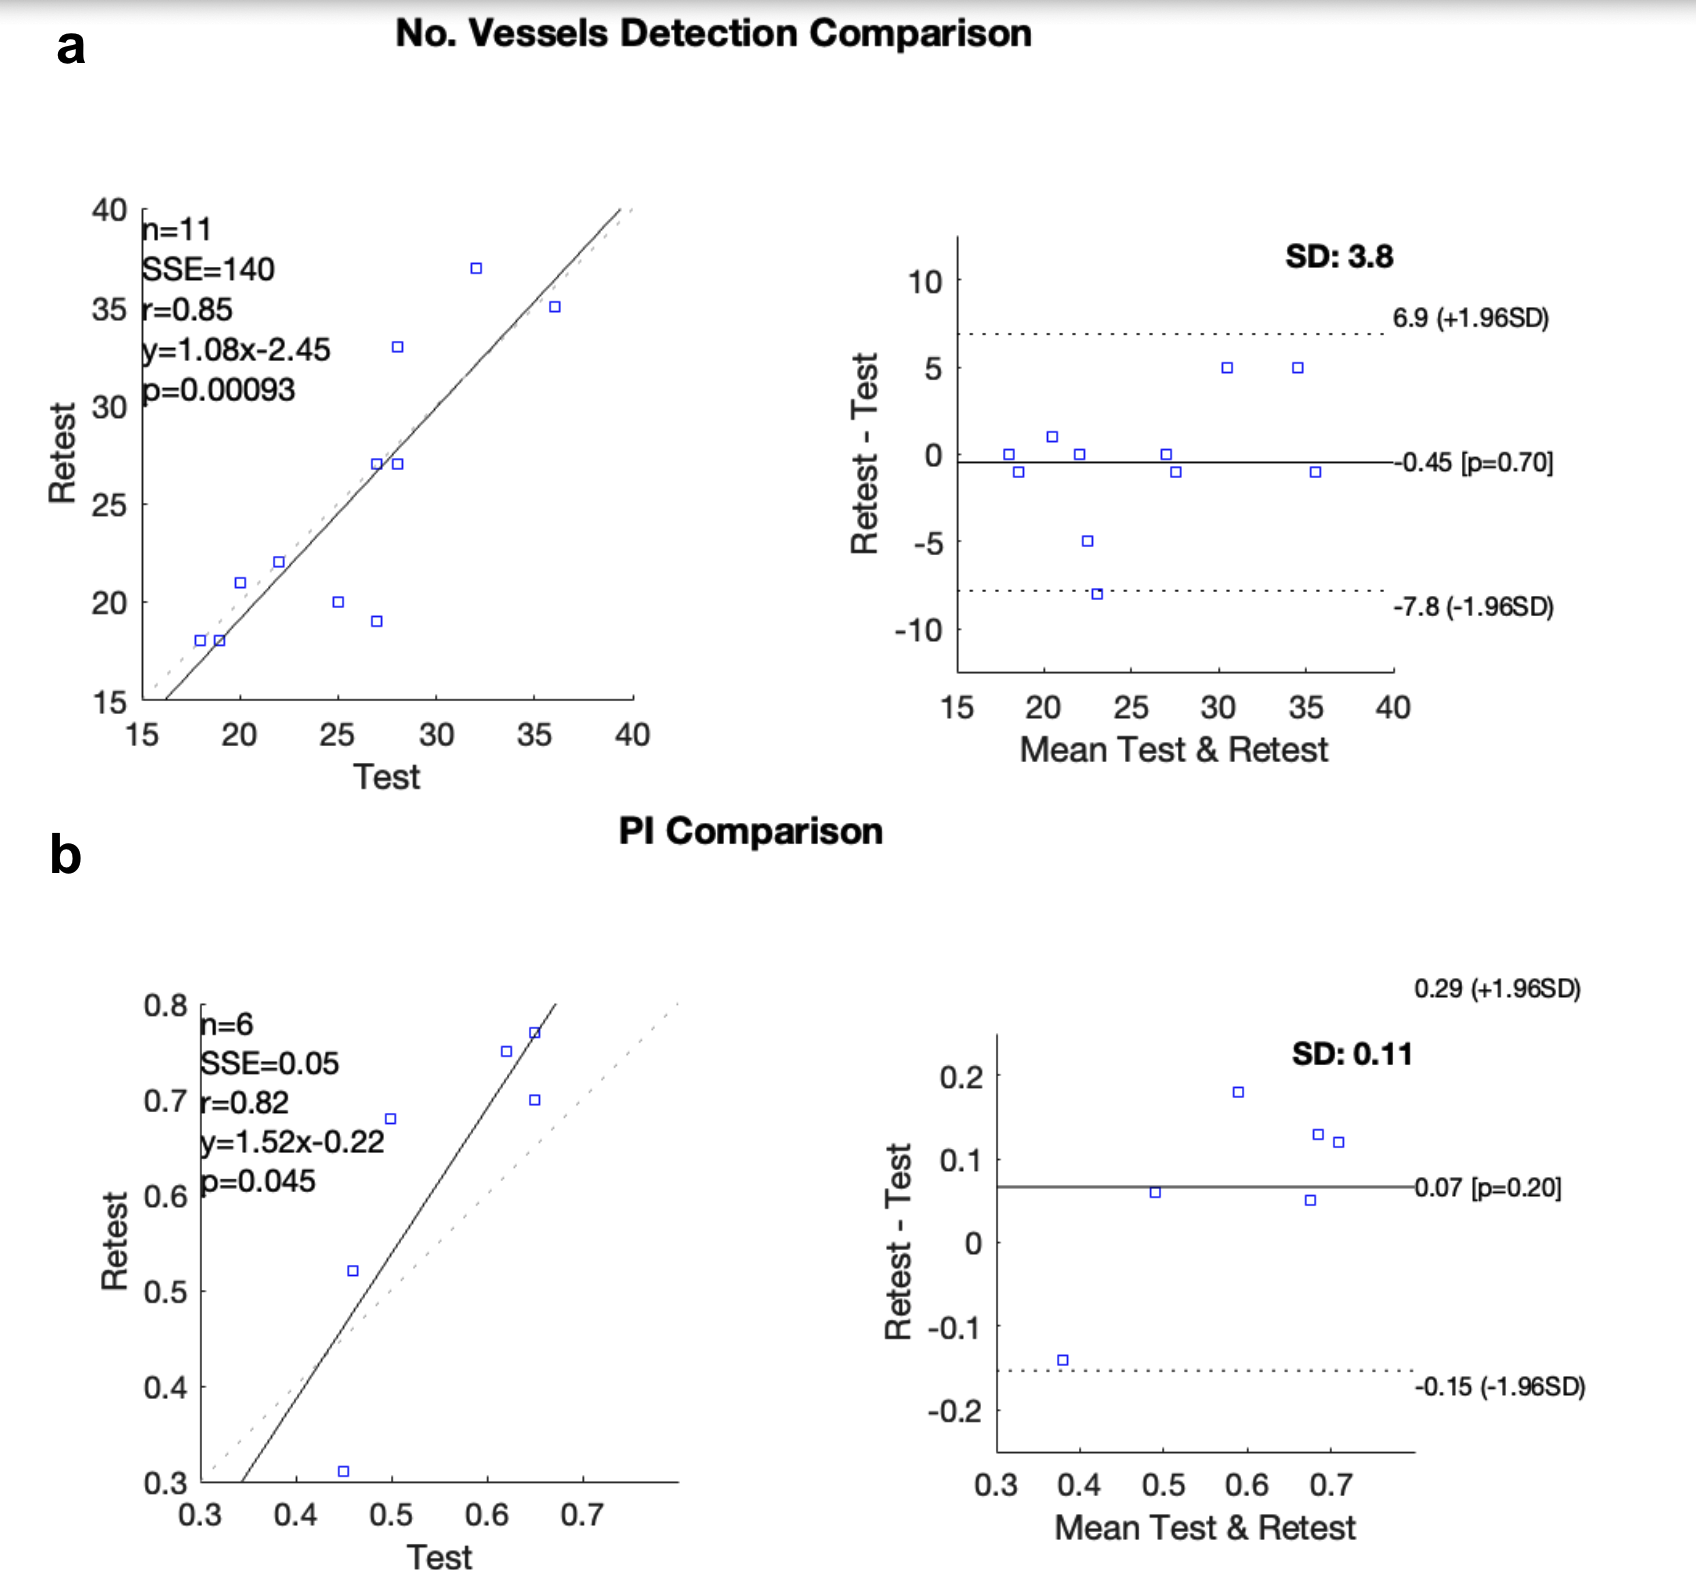
6) Calculate the Pulsatility Index (PI) as PI = (Vmax-Vmin)/Vmean of each vessel, and then average them to yield mean PI.
Results
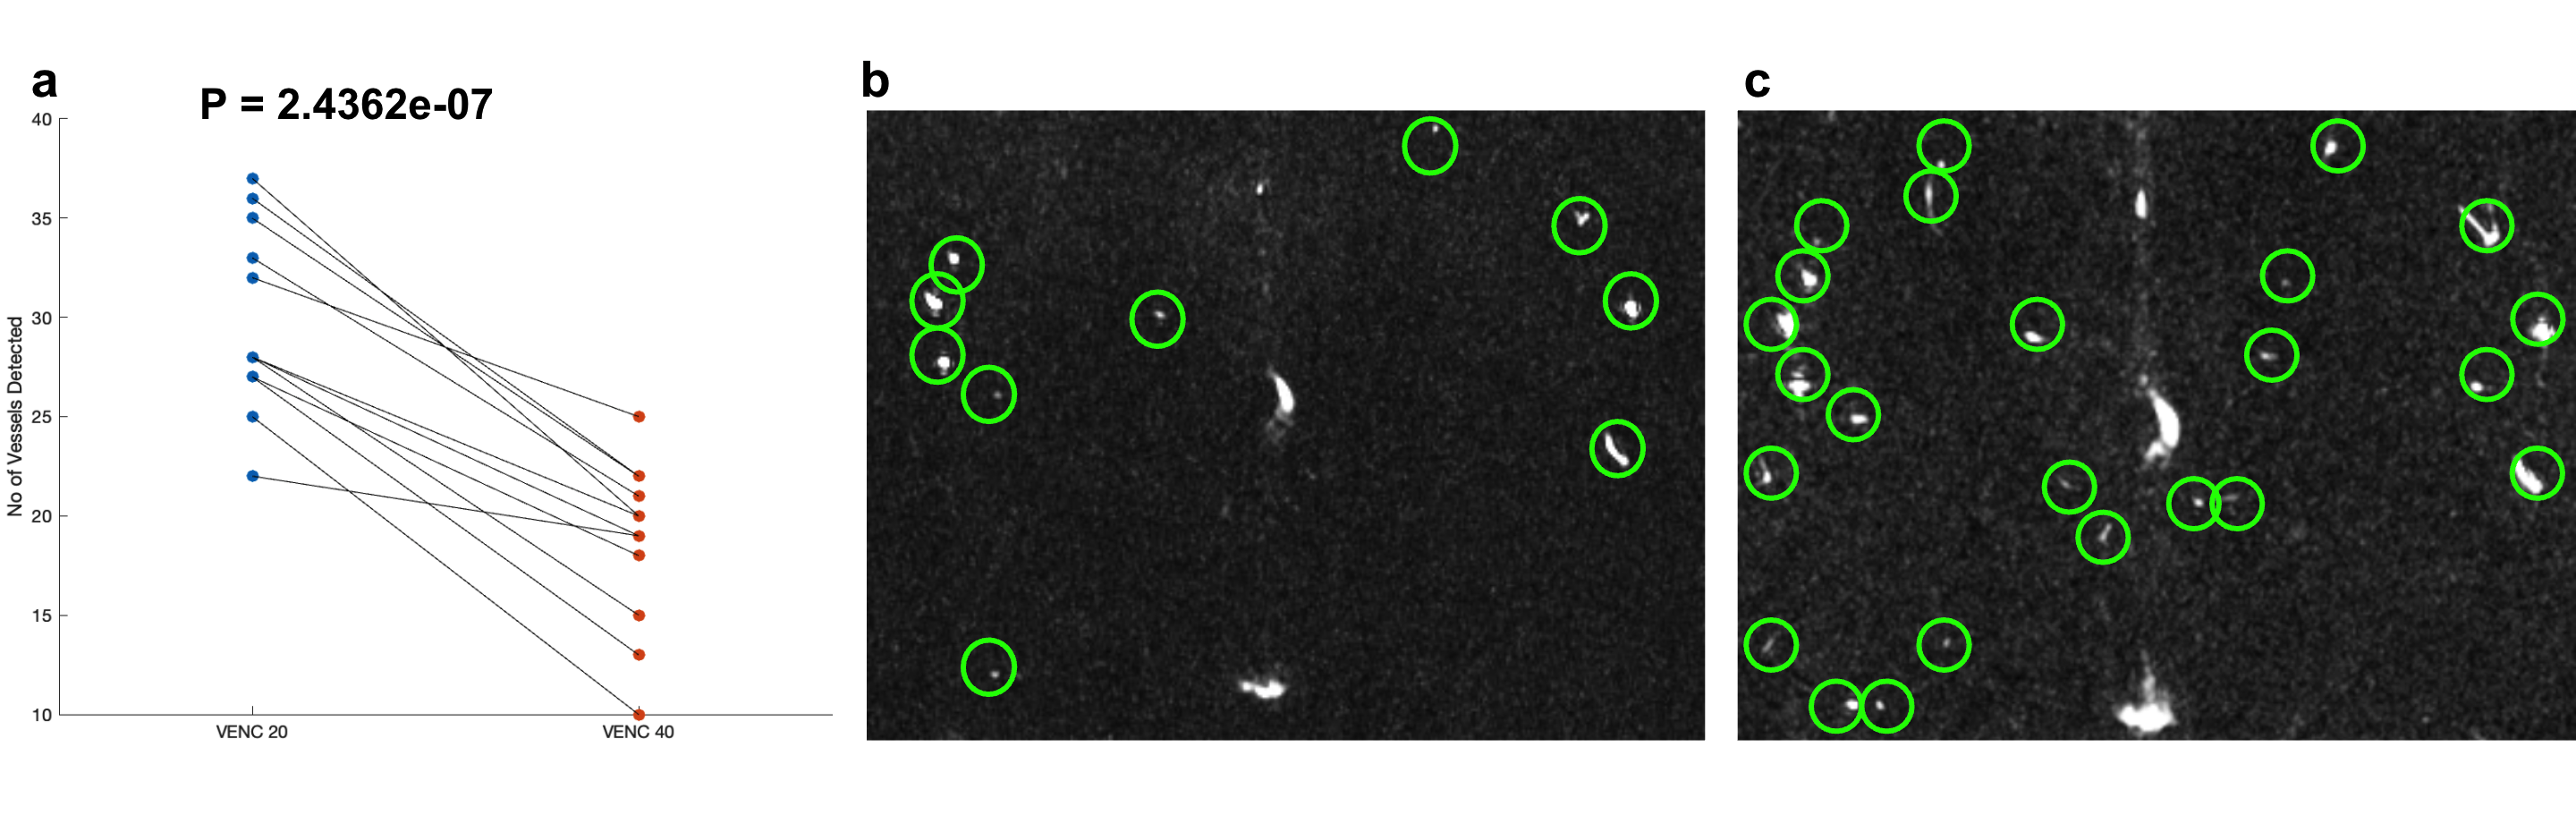
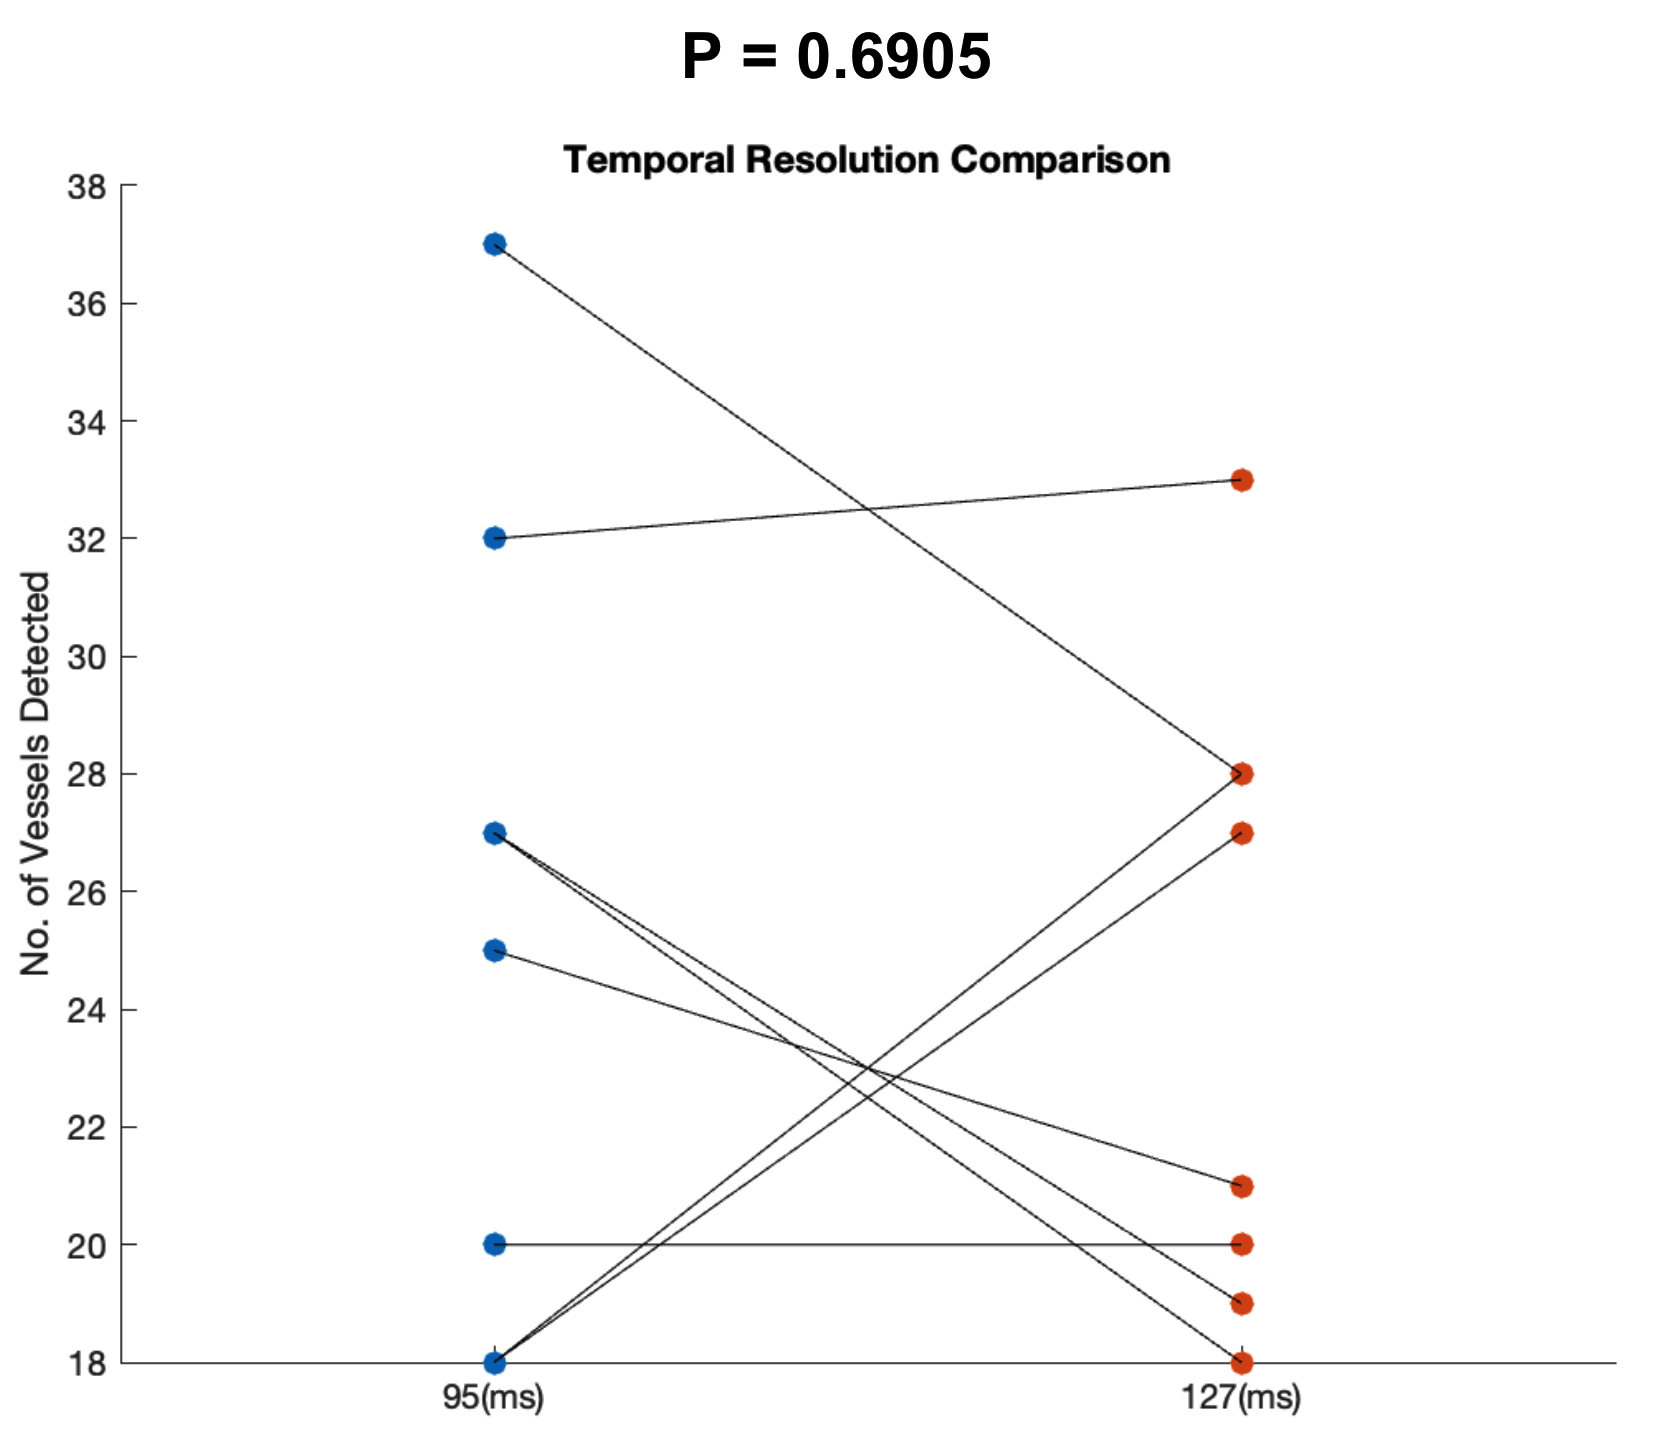
Perforating arteries and their velocity waveforms across a cardiac cycle were successfully detected using 2D high-resolution PC-MRI from all subjects. Figure 1b shows the detected perforating arteries from one exemplary subject. Velocity waveforms from three selected perforating arteries labeled in Figure 1b are shown in Figure 1c. Consistent velocity waveforms were observed across perforating arteries. Figure 2 shows the numbers of the detected perforators (Nperforator) using VENC of 20cm/s and VENC of 40cm/s from all subjects. Significantly more perforators (p<0.001) were detected using VENC = 20cm/s (Nperforator = 29.43 ± 4.43) than those using VENC = 40cm/s (Nperforator= 18.57 ± 3.86). The measured PI was 0.55 ± 0.16, which is in a reasonable range compared to those reported in the literature3. The reproducibility of Nperforator and PI was shown using Bland-Altman plots as shown in Figure 3a and b, respectively. Good correlation was observed from the linear regression corresponding to Nperforator (r=0.85) and PI (r=0.82), respectively. The 95% confidence intervals were [-2.07, 2.97] and [-0.18, 0.05 ] for Nperforator and PI, respectively, indicating a fairly good agreement between the two measurements. No significant difference (p = 0.6905) in Nperforator was obtained between the temporal resolutions of 95 ms and 127 ms (Figure 4).Discussion
To our knowledge, this is the first study to apply phase-contrast MRI with more than one VENC to assess the flow hemodynamics of cerebral perforating arteries. The diameter of perforating arteries can range from 175 to 668 μm, which results in different velocities5. Potential partial volume effects especially on smaller perforators could result in extremely low flow velocity. With a dual-VENC strategy, higher VENC can be used for anti-aliasing of the lower VENC data while preserving the favorable velocity to noise ratio (VNR) of the lower VENC data. Our preliminary data suggested that the sensitivity of perforating artery detection using PC-MRI was significantly improved by using the dual-VENC strategy. The number of detected perforators significantly increased with dual-VENC data, compared to that with a single VENC of 40cm/s. The reliability of PI measurement was demonstrated by the test-retest experiment. The effect of temporal resolution on perforator detection was also studied, which showed no significant difference. This finding is not consistent with the previous work6. The discrepancy may be attributed to the limited sample size in this study.Conclusion
We demonstrated that the use of 2D high-resolution PC-MRI with dual VENC can significantly improve the detection of cerebral perforating arteries including the extremely small ones and provide reliable pulsatility measurement at 7T. Future work will be carried out to validate the dual-VENC method with further sequence optimization in a larger sample size.Acknowledgements
This work was supported by NIH grants K25 AG056594, R01NS118019, RF1AG072490, and BrightFocus foundation A20201411S.References
1. Hakim AM. Small Vessel Disease. Front Neurol. 2019;10:1020. Published 2019 Sep 24. doi:10.3389/fneur.2019.01020
2. Fyfe, I. Global small vessel disease brain changes predict cognitive decline. Nat Rev Neurol 16, 2–3 (2020).
3. Bouvy WH, Geurts LJ, Kuijf HJ, et al. Assessment of blood flow velocity and pulsatility in cerebral perforating arteries with 7-T quantitative flow MRI. NMR Biomed. 2016;29(9):1295-1304. doi:10.1002/nbm.3306
4. Ran Klein (2021). Bland-Altman and Correlation Plot (https://www.mathworks.com/matlabcentral/fileexchange/45049-bland-altman-and-correlation-plot), MATLAB Central File Exchange. Retrieved November 8, 2021.
5. Djulejić V, Marinković S, Milić V, et al. Common features of the cerebral perforating arteries and their clinical significance. Acta Neurochir (Wien). 2015;157(5):743-754. doi:10.1007/s00701-015-2378-8
6. Geurts L, Biessels GJ, Luijten P, Zwanenburg J. Better and faster velocity pulsatility assessment in cerebral white matter perforating arteries with 7T quantitative flow MRI through improved slice profile, acquisition scheme, and postprocessing. Magn Reson Med. 2018;79(3):1473-1482. doi:10.1002/mrm.26821
Figures