4861
Highly accelerated 4D flow MRI using compressed sensing in type B aortic dissection1Department of Radiology, Feinberg School of Medicine, Northwestern University, Chicago, IL, United States, 2Department of Biomedical Engineering, Northwestern University, Chicago, IL, United States, 3Cardiovascular MR R&D, Siemens Medical Solutions USA, Inc., Cleveland, OH, United States, 4Cardiovascular MR R&D, Siemens Medical Solutions USA, Inc., Chicago, IL, United States, 5Division of Cardiac Surgery, Feinberg School of Medicine, Northwestern University, Chicago, IL, United States, 6Division of Vascular Surgery, Feinberg School of Medicine, Northwestern University, Chicago, IL, United States
Synopsis
4D flow MRI is an established quantitative MR imaging technique for evaluating complex blood flow patterns. However, clinical applications of standard 4D flow MRI technique is limited by long scan times associated with multidimensional imaging. Compressed sensing (CS) acceleration can significantly reduce scan time through dramatic data undersampling, but it is not clear how this undersampling impacts assessment of flow patterns in type B aortic dissection (TBAD). In this study, we investigate performance of highly accelerated CS 4D flow MRI at two different acceleration factor levels (R=7.7 and 10.2) to evaluate aortic flow dynamics in volunteers and patients with TBAD.
INTRODUCTION
Aortic dissection is a life-threatening vascular disease associated with a tear in the intimal layer of the aorta that allows blood flow into a false lumen (FL). Type B aortic dissection (TBAD) can be isolated or residual following type A aortic dissection repair. Noninvasive, rapid, imaging based evaluation is extremely important in patients with TBAD for effective treatment plan and best clinical outcomes. Current diagnostic imaging tools focus on morphologic features such as descending aorta size in TBAD, but do not fully characterize hemodynamics in the true lumen (TL) and FL. While the utility of 4D flow MRI in evaluating cardiovascular pathologies has long been investigated, its clinical adoption is hindered by long scan times and there remains a need for development and validation of faster 4D flow MRI protocol to evaluate TL/FL hemodynamics in TBAD. Here, we assess the capability of compressed sensing (CS) accelerated 4D flow MRI to characterize complex flow patterns in TBAD as compared to standard GRAPPA 4D flow MRI protocol.METHODS
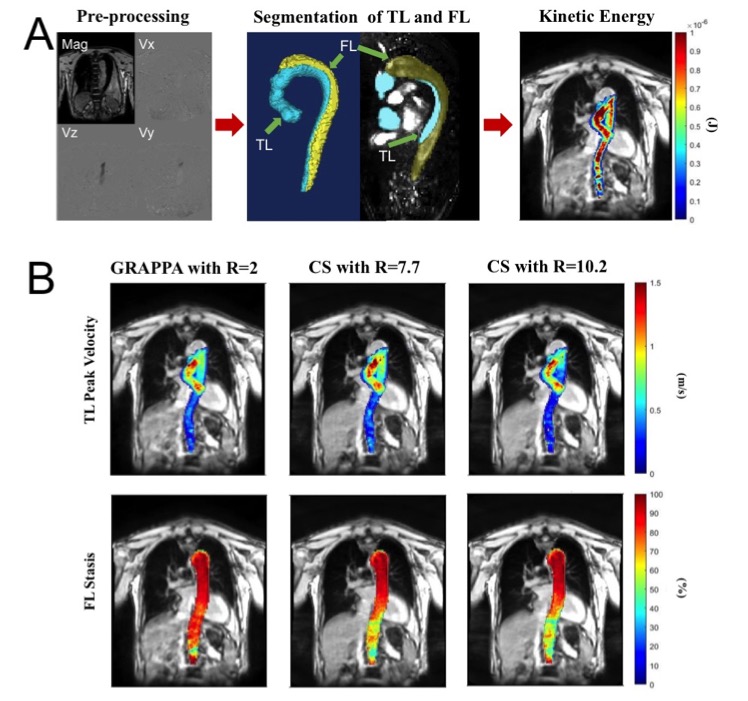
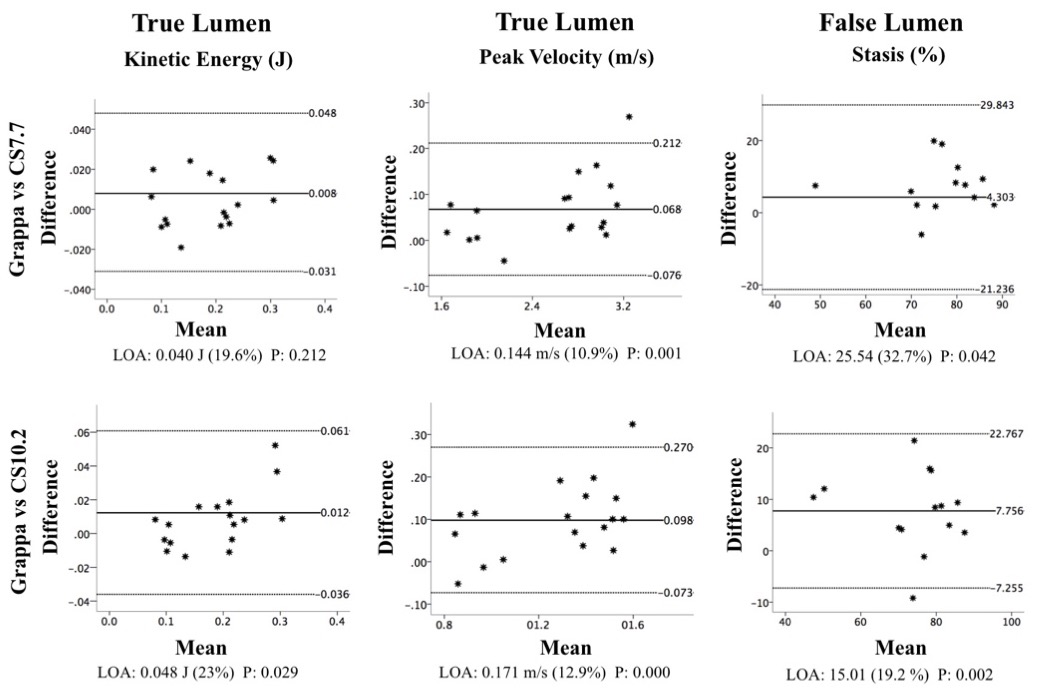
Seven TBAD patients (57.5 ± 8 years old; 2 female) including 3 medically managed isolated chronic TBAD and 4 chronic residual TBAD patients following type A aortic dissection repair and 2 healthy volunteers (28-year old male, 21-year old female) were prospectively recruited. The subjects were scanned with non-contrast, free-breathing prototype 4D flow MRI including one conventional GRAPPA accelerated (R=2) and two CS-accelerated 4D flow MRI scans with R=7.7 and 10.2 on a 1.5T MRI system (MAGNETOM Sola, Siemens Healthcare, Germany) using retrospective ECG-gating, the same spatial (~2.5 mm3) and temporal (40 ms) resolution, and velocity encoding (160 cm/s). Scans were performed twice, 5 to10 days apart for interscan reliability assessment of each acquisition type. Preprocessing of the 4D flow dataset was followed by manual segmentation of the TL and FL on a designated software (Mimics, Materialise NV, Leuven, Belgium). Voxelwise total kinetic energy (KE) and mean 5th percentile peak velocity (PV) over the entire volume through the cardiac cycle were calculated in TL and FL in patients and in the entire aorta of the volunteers. Voxelwise mean flow stasis was also measured in FL (Fig. 1). Groupwise comparisons between acquisition types were performed using paired t-test or Wilcoxon singed-ranks test as appropriate. Pearson correlation coefficients and Bland-Altman analysis were also used for groupwise comparisons and for interscan reliability assessment of each sequence type.RESULTS
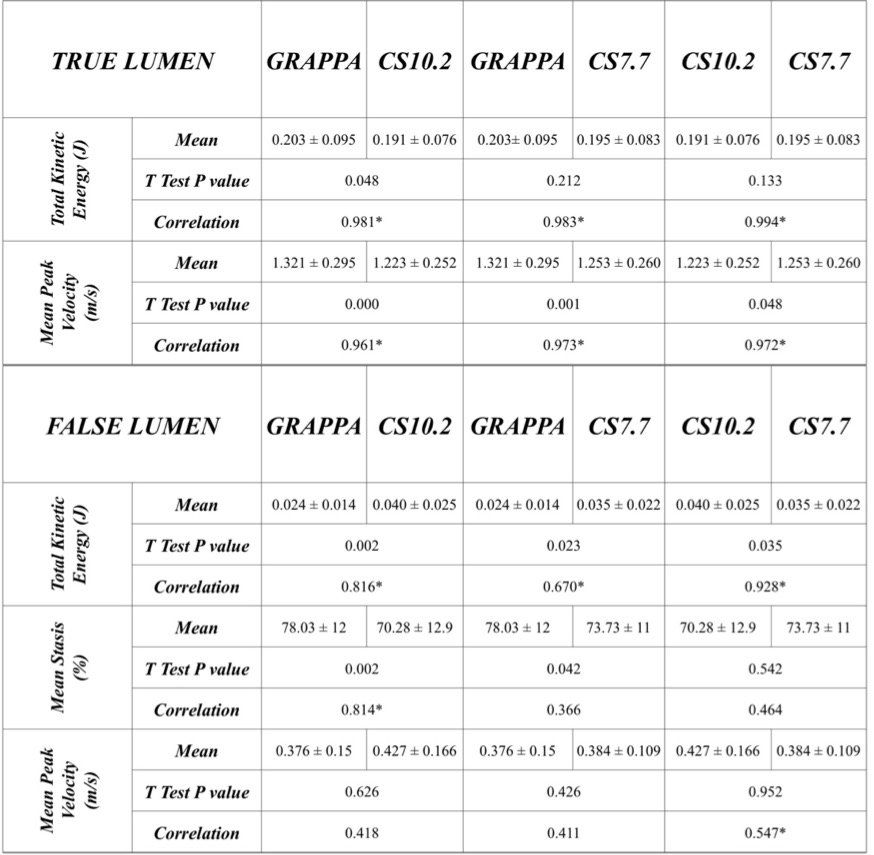
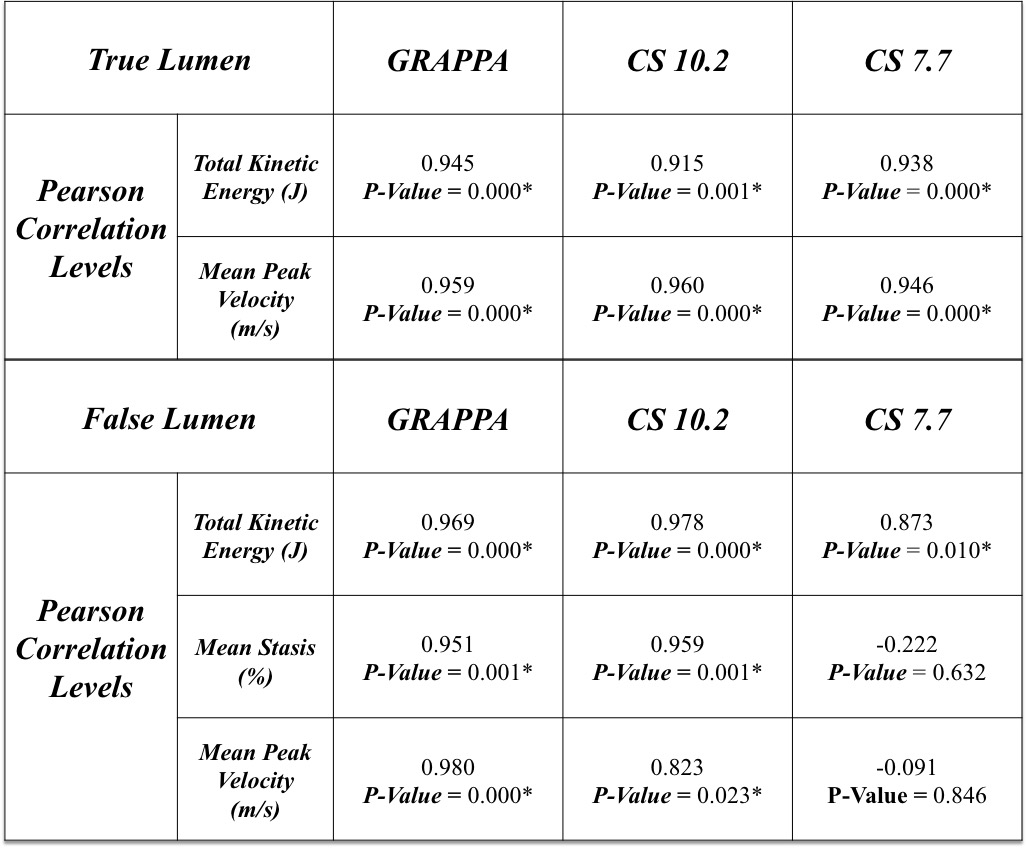
All 3 groupwise comparisons showed narrow limits of agreements and mean bias percentage levels for KE and PV in TL, and for stasis in FL (Fig. 2). The KE in TL between GRAPPA and CS10.2 and between CS7.7 and CS10.2 did not show any significant difference (p>0.05). The PV in FL showed no significant difference for any pairwise comparison (p>0.05, Fig. 3). The KE and PV in TL and KE in FL showed significant positive correlations between both CS-accelerated sequences and GRAPPA (p<0.01). Stasis between GRAPPA and CS10.2 in FL also showed significant positive correlation (r=0.814, p<0.01). Interscan comparisons showed significant positive correlation at the 0.01 level for all parameters in TL and for KE in FL for all acquisition types (Fig. 4). Stasis in FL showed significant positive correlation in GRAPPA and CS10.2 (p<0.01) and PV in GRAPPA (p<0.01) and CS10.2 (p<0.05) interscan comparisons. Bland-Altman plots revealed variable percentage levels in interscan comparisons with insignificant p-values for KE in both TL and FL for both CS accelerated scans and in FL stasis for CS10.2 only.DISCUSSION
4D flow MRI offers an opportunity to quantify blood flow and advanced hemodynamics. Here we demonstrate consistent results between CS accelerated 4D flow MRI acquisitions and regular 4D flow MRI acquisition in several FL/TL flow parameters with shorter scan times (~4-5 minutes) and we also see statistically significant strong positive correlations for most of the hemodynamic flow parameters in TL and FL between scans performed on two separate days, supporting the reproducibility of the results. These results indicate the potential of CS accelerated 4D flow MRI acquisition in accurate and reproducible quantification of TL/FL advanced flow hemodynamics improving the scan efficiency and patient comfort with shorter scan times in TBAD. While limited by a small sample size, ongoing patient recruitment will allow better assessment of the robustness and repeatibility of our results in a larger sample size.CONCLUSION
With shorter acquisition times, CS accelerated 4D flow MRI acquisition is a promising approach to incorporate 4D flow into the standard clinical practice as a noninvasive diagnostic tool to provide comprehensive quantitative assessment of the aorta hemodynamics in TBAD.Acknowledgements
No acknowledgement found.References
1. Jarvis. K., et al., Parametric Hemodynamic 4D Flow MRI Maps for the Characterization of Chronic Thoracic Descending Aortic Dissection. J Mag Reson Imaging, 2020. 51(5): p.1357-1368.
2. Ma, L.E., et al., Aortic 4D flow MRI in 2 minutes using compressed sensing, respiratory controlled adaptive k-space reordering, and inline reconstruction. Magn Reson Med, 2019. 81(6): p. 3675-3690.
3. Pathrose, A., et al., Highly accelerated aortic 4D flow MRI using compressed sensing: Performance at different acceleration factors in patients with aortic disease. Magn Reson Med, 2021. 85(4): p. 2174-2187.
4. Francois, C.J., et al., Four-dimensional, flow-sensitive magnetic resonance imaging of blood flow patterns in thoracic aortic dissections. Journal of Thoracic and Cardiovascular Surgery, 2013. 145(5): p. 1359-1366.
Figures