4860
Velocity to Pressure Mapping in Stenotic Pulsatile Flows with an Encode-Decoder Deep Network1ECE, University of Louisville, Louisville, KY, United States, 2Cardiovascular Division, Robley Rex VA Medical Centre, Louisville, KY, United States
Synopsis
We propose a novel deep learning based approach to estimate pressure drop inside a stenotic valve from 4D Flow MRI velocities. A neural network architecture learns the relationship of three directional velocities and predicts pressure as output. The network was tested on real 4D flow MRI data of aortic valvular flow both in-vitro and in vivo. Estimated in-vitro pressure drop by proposed method shows (3-5)% relative pressure drop error with corresponding CFD pressure. Estimated In-vivo pressure drop was also compared with doppler Echocardiography and simplified and modified Bernoulli at peak systole timepoints in 10 patients with aortic stenosis.
Introduction
To measure severity of a stenosis and to determine course of therapy, pressure drop assessment across the narrowing is a clinically established procedure [1]. Pressure measurements with X-ray angiography is an invasive procedure which is considered the clinical gold standard for the confirmation of functionally significant stenotic lesions. Doppler Echocardiography and 4D Flow MRI are non-invasive imaging methods involving non-ionizing radiation which can be used for measuring flow velocities and pressure. However, doppler echocardiography is known to overestimate the pressure drop. Pressure gradient can be estimated from 4D Flow MRI velocities using numerical methods such as Navier-stokes based method and pressure-Poisson equation [7,8] as well as the generalized Bernoulli equation [4]. However, pressure-Poisson method is sensitive to boundary condition, generalized Bernoulli equation is susceptible to small irregularities across time and space, and solving the Navier-stokes is computationally expensive. In this paper, we propose a novel deep learning based approach to estimate pressure drop across a stenotic narrowing from 4D Flow MRI velocities.Methods
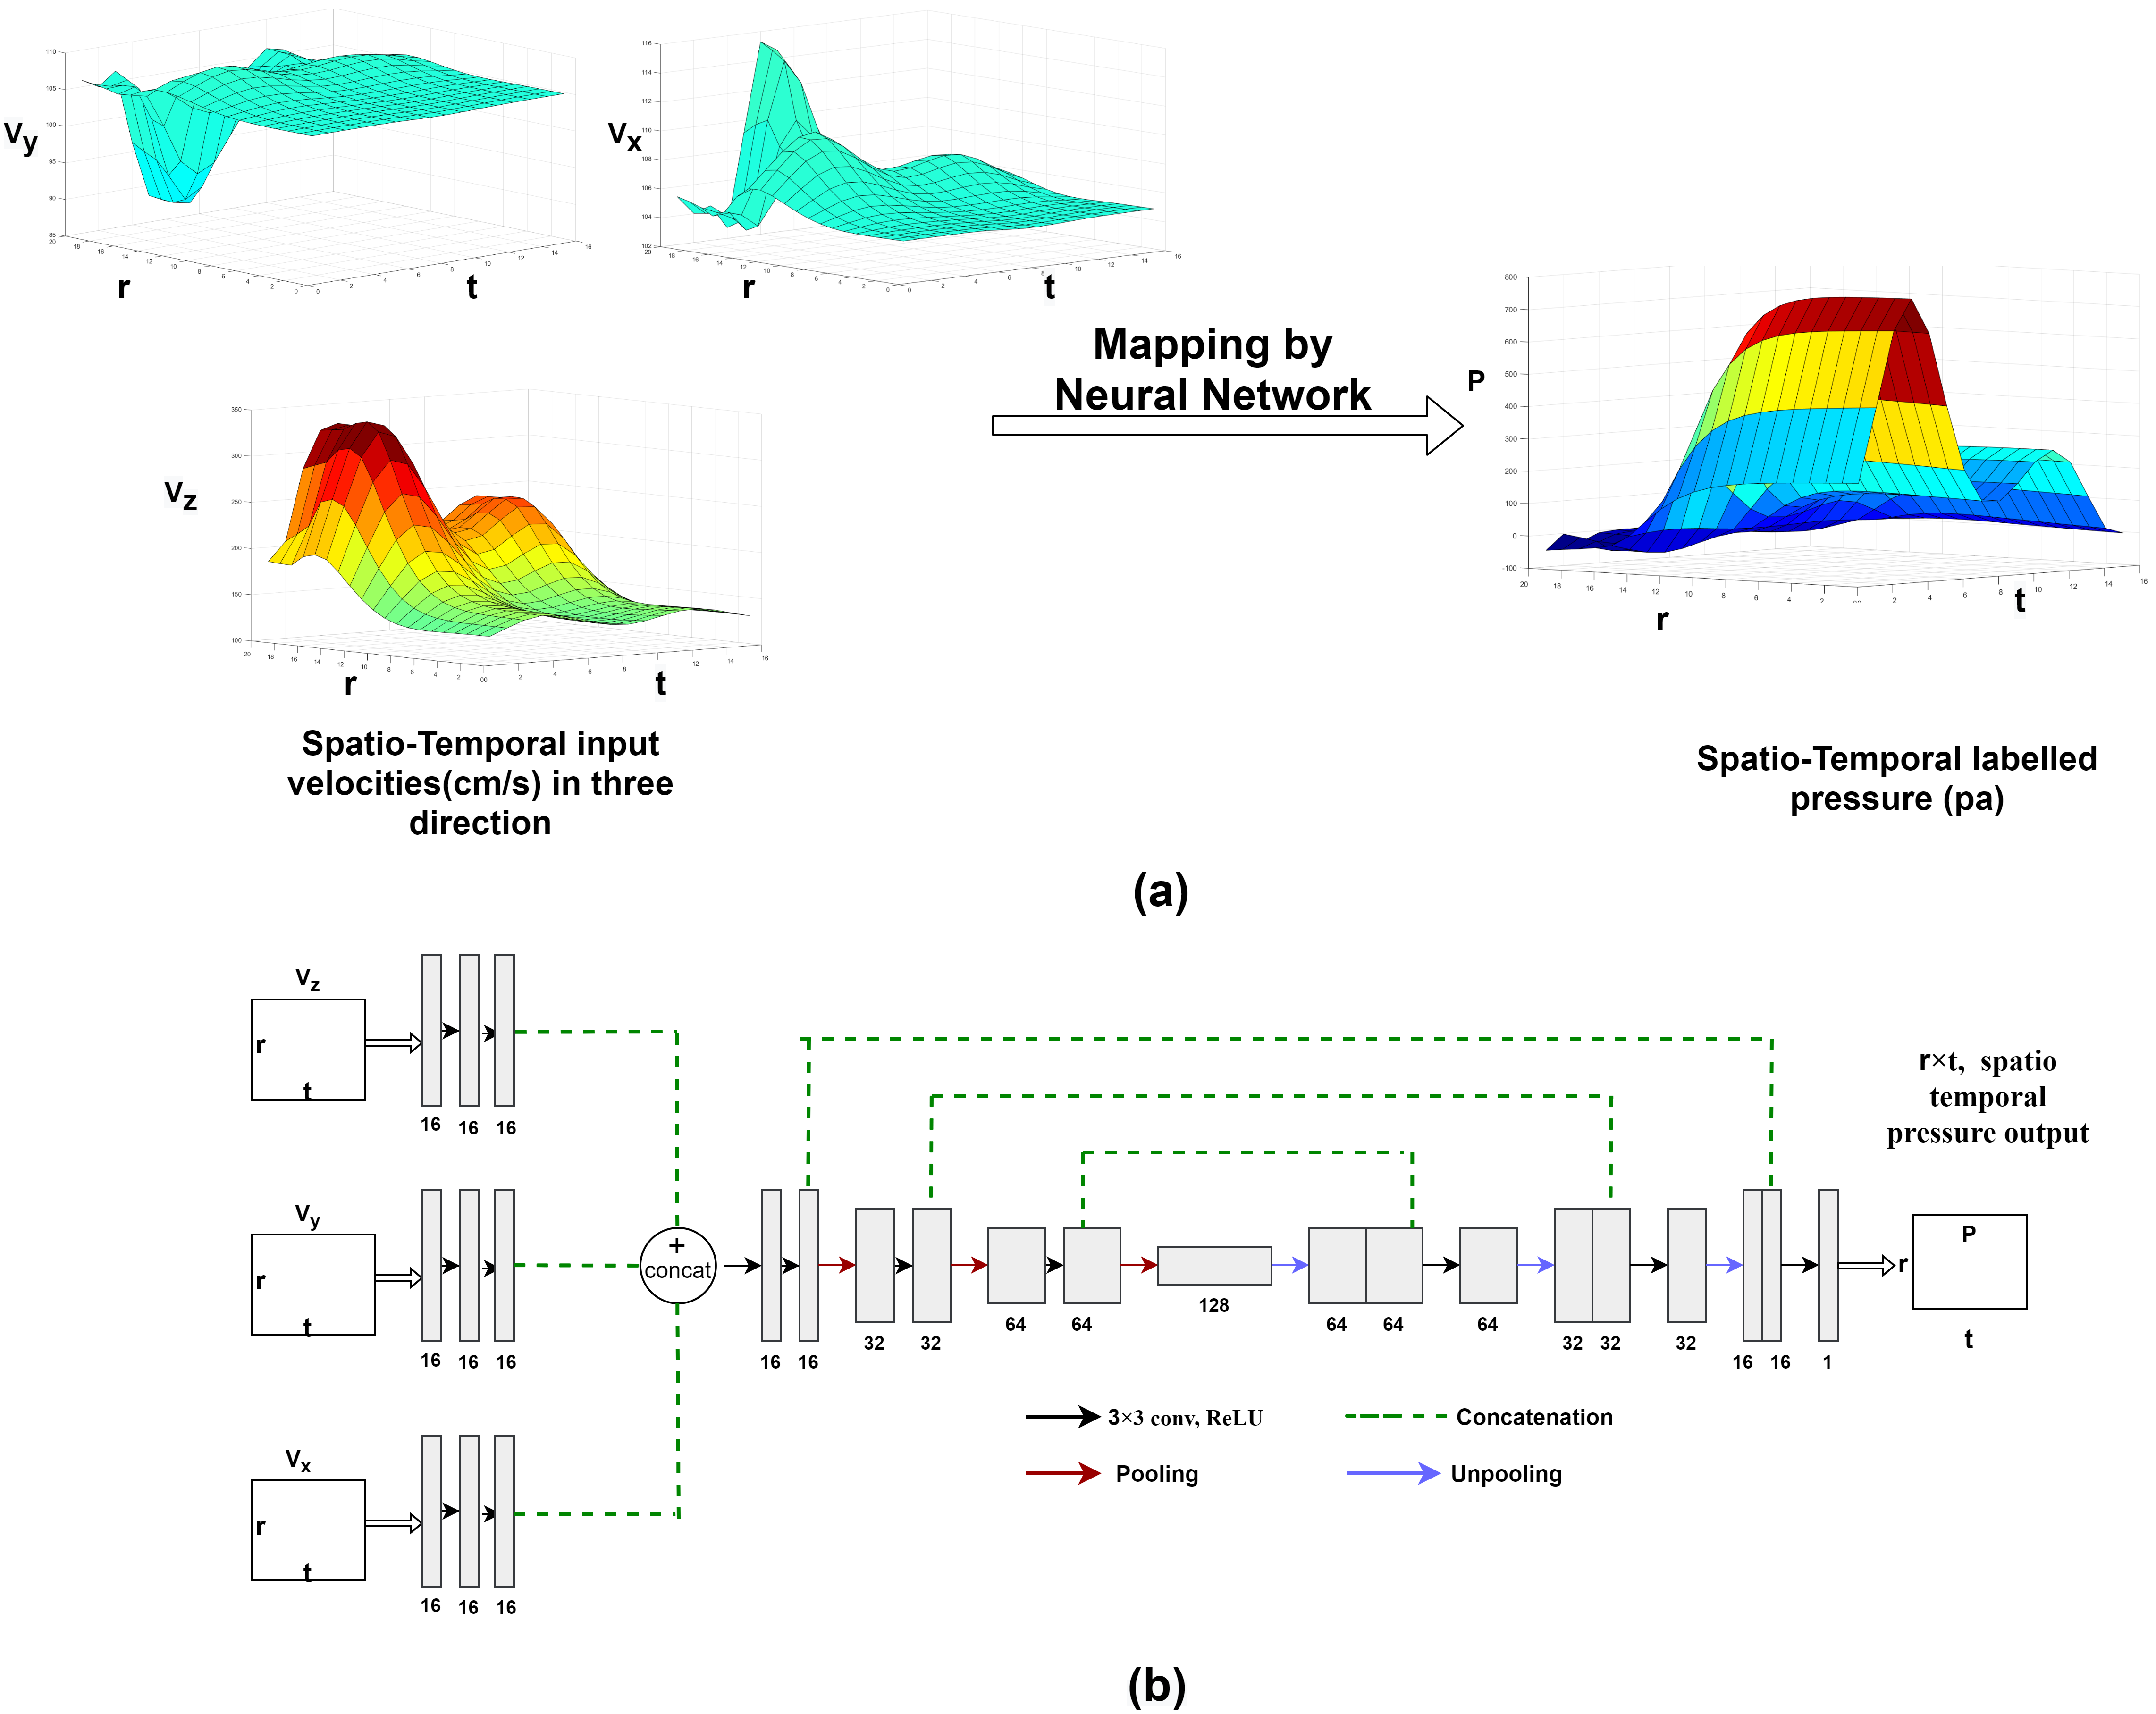
A 2D neural network architecture is proposed which learns the 4D spatiotemporal relationship of velocities to pressures at the center path line of the flow and as output predicts corresponding pressures. Figure 1(a) shows sample 2D velocity profile in x,y and z directions and the reference 2D pressure profile which will be learnt through velocity to pressure mapping by training the proposed 2D network. Figure-1(b) shows the proposed network architecture. The network takes three separate inputs of size $$$(Nr×Nt) $$$ where three inputs are velocities Vx, Vy and Vz along three Cartesian coordinate axes over the number of cardiac phases (time) and is the number of axial slices where each centre point in the flow forms the path line. The targeted output of the network is corresponding pressure in the path line of size $$$(Nr×Nt) $$$. Three separate inputs of the network go through three separate path consisting of three convolutional layers. The convolutional layers in the separate path in the initial layers detect low level velocity features of velocities separately. The features are then concatenated and go through an encoder-decoder path. A novel loss function is proposed which combines data fidelity across dimensions minimizes distance between predicted and labelled spatio-temporal pressure, the spatial pressure gradient at each time and temporal gradient at each spatial location. To train the network, a computational fluid dynamic model was utilized which identically matches the geometry of a stenotic flow phantom used in in-vitro 4D Flow MRI experiments. Velocity and pressure data were simulated in CFD by solving the Navier-Stokes equation for 300 different flow conditions. To augment the data, Gaussian noise with standard deviation starting from 0.01 to 0.3 with 0.01 increment was added and 9000 training samples were created. In splitting data, 2000 samples in different velocity range were kept for testing, 1000 samples were kept for validation and network was trained on 6000 training samples via 5 fold cross validation. Velocity and pressure values were normalized between 0 to 1. A batch size of 64 was used to train the network. Network weight was initialized using normal distribution with standard deviation of 0.01. Adam optimizer was used to minimize the loss function with a learning rate of 0.0001 over 300 epochs.Results
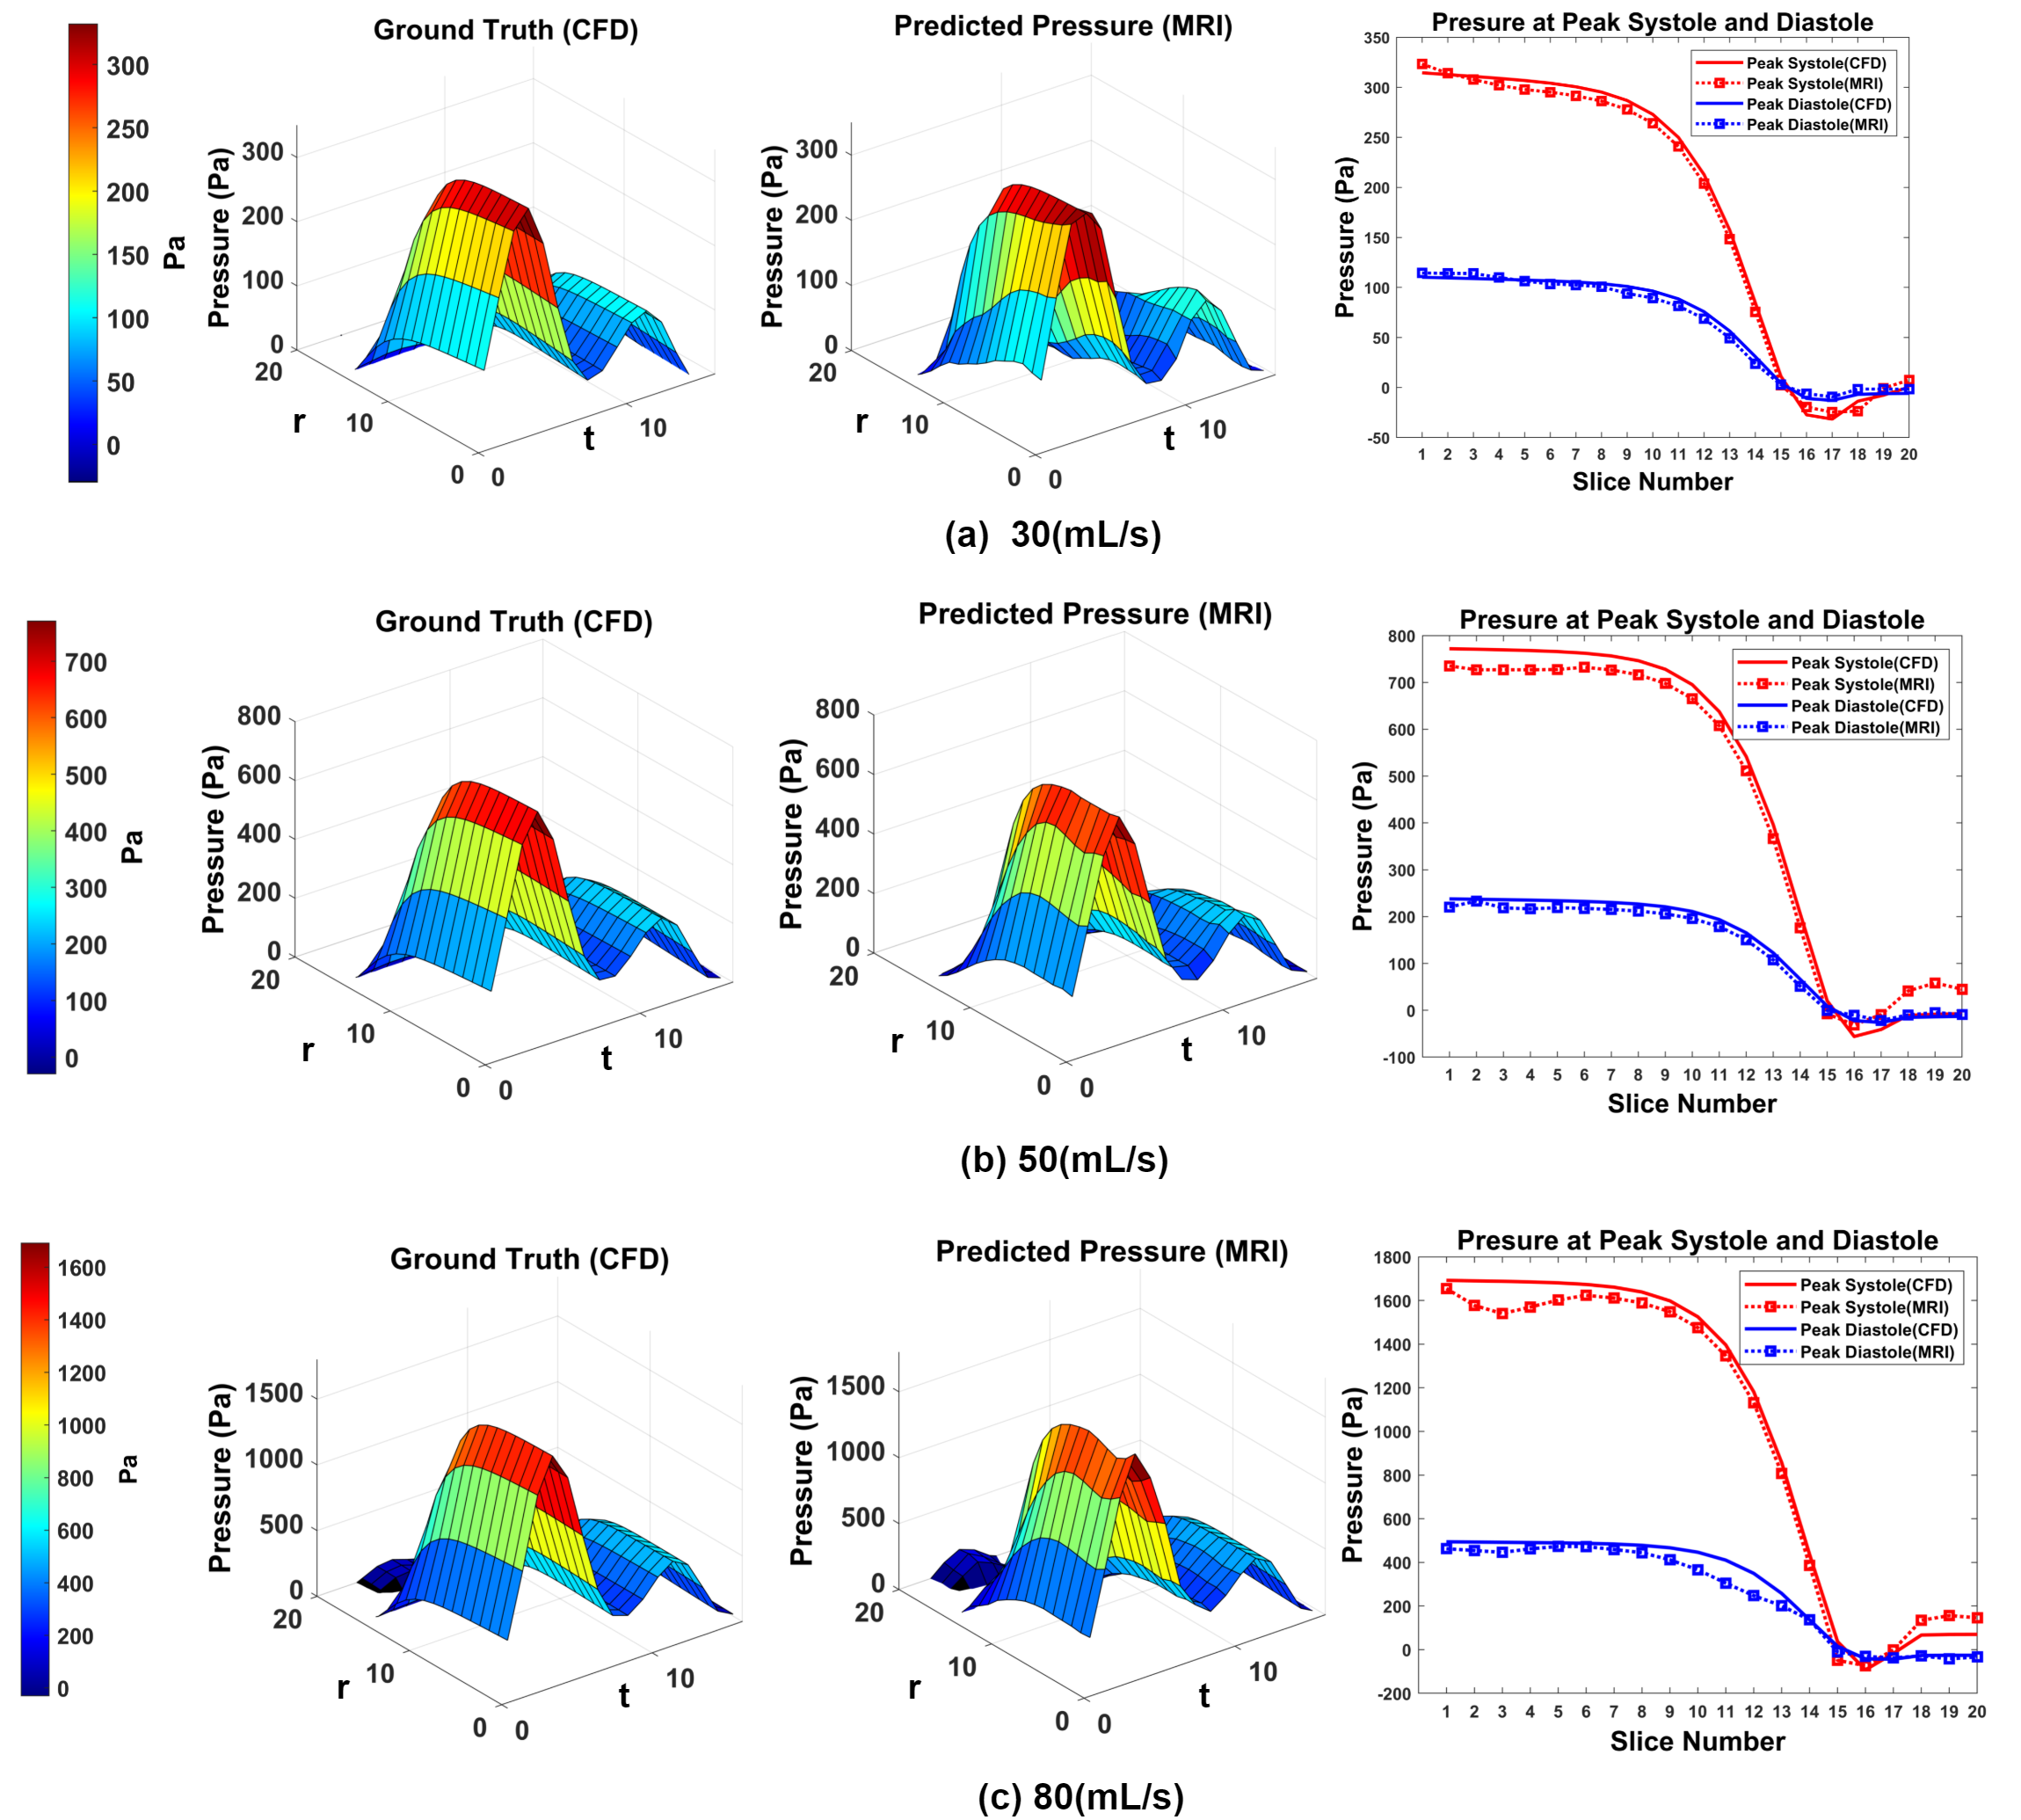
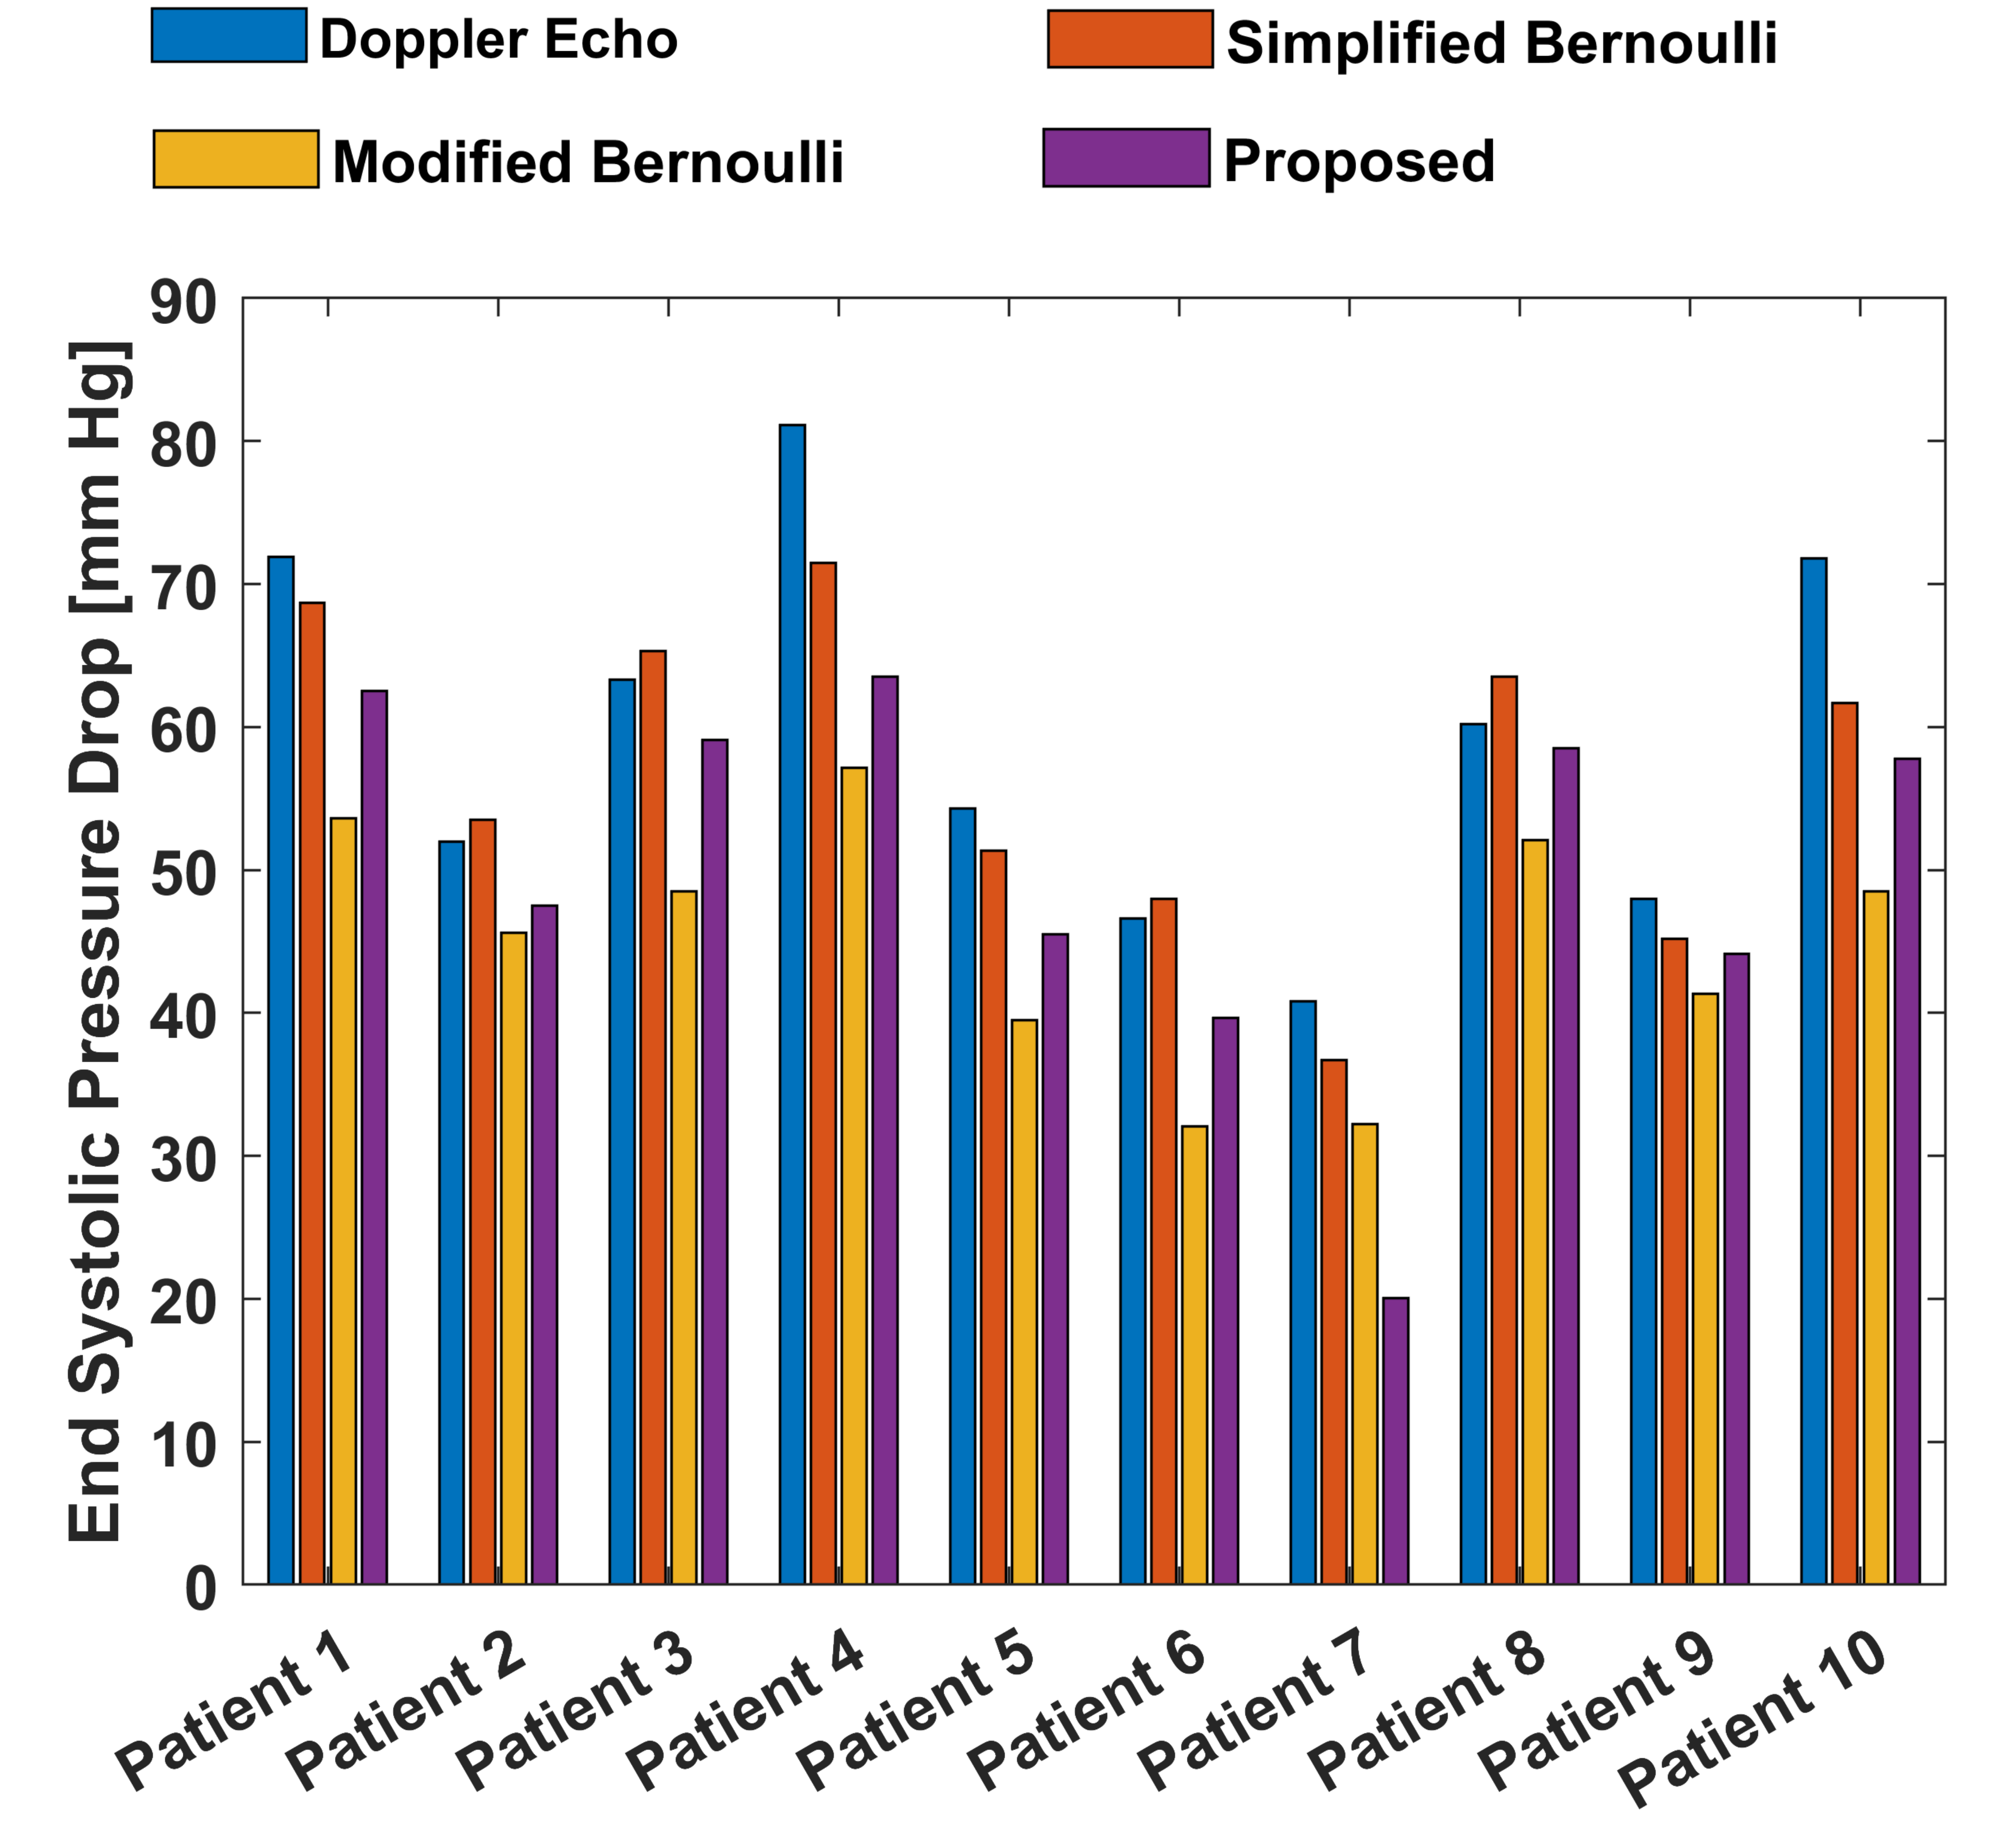
After training with CFD simulated data, the network was tested on 4D Flow MRI in-vitro data of 3 different flow conditions and compared with ground truth pressure from CFD for the similar flow conditions. Figure 2 (a), (b) and (c) shows output spatio-temporal pressure by the proposed method for 30mL/s, 50mL/s and 80mL/s peak flowrate in in-vitro phantom experiments. From predicted pressure, pressure drop (PD) at each timepoint was calculated by taking the difference of inlet pressure and minimum pressure along the center line. From spatio-temporal pressure output temporal PD was calculated and relative pressure drop error was estimated. Estimated pressure drop across stenosis by proposed method was compared with the pressure drop by simplified Bernoulli and modified Bernoulli method where simplified and modified Bernoulli were measured at all timepoints. Table I shows the pressure drop error for three different flow rates of in-vitro phantom - the proposed method shows significantly lower error in pressure drop. Further, the trained network was tested on time-resolved velocity input from 10 patients with various degree of severity of aortic stenosis and the predicted pressure drop at peak systolic timepoint was compared with corresponding ground truth pressure drop from doppler Echocardiography along with simplified and modified Bernoulli methods. Figure 3 shows bar plot of pressure drop value for 10 patients with aortic stenosis from different methods.Discussion
We have presented a novel end to end deep learning framework for measuring pressure drop from 4D flow MRI in aortic stenosis. The proposed method can learn spatio-temporal velocity features and can predict pressure drop with high fidelity.Acknowledgements
No acknowledgement found.References
[1] Garcia, D., Pibarot, P., Dumesnil, J., Sakr, F. and Durand, L., 2000. Assessment of Aortic Valve Stenosis Severity. Circulation, 101(7), pp.765-771.
[2] Negahdar MJ, Kadbi M, Cha J, Cebral J, Amini A. Noninvasive 3D pressure calculation from PC-MRI via non-iterative harmonics-based orthogonal projection: Constant flow experiment. In: Engineering in Medicine and Biology Society (EMBC), 2013 35th Annual International Conference of the IEEE; 2013, p 4390–4393.
[3] Ebbers, T. and Farnebäck, G., 2009. Improving computation of cardiovascular relative pressure fields from velocity MRI. Journal of Magnetic Resonance Imaging, 30(1), pp.54-61.
[4] Falahatpisheh, A., Rickers, C., Gabbert, D., Heng, E., Stalder, A., Kramer, H., Kilner, P. and Kheradvar, A., 2015. Simplified Bernoulli's method significantly underestimates pulmonary transvalvular pressure drop. Journal of Magnetic Resonance Imaging, 43(6), pp.1313-1319.
[5] Franke, B., Weese, J., Waechter-Stehle, I., Brüning, J., Kuehne, T. and Goubergrits, L., 2020. Towards improving the accuracy of aortic transvalvular pressure gradients: rethinking Bernoulli. Medical & Biological Engineering & Computing, 58(8), pp.1667-1679.
[6] Zhang, J., Brindise, M., Rothenberger, S., Schnell, S., Markl, M., Saloner, D., Rayz, V. and Vlachos, P., 2020. 4D Flow MRI Pressure Estimation Using Velocity Measurement-Error-Based Weighted Least-Squares. IEEE Transactions on Medical Imaging, 39(5), pp.1668-1680.
[7] A. Nasiraei-Moghaddam, G. Behrens, N. Fatouraee, R. Agarwal, E. T. Choi, and A. A. Amini, “Factors affecting the accuracy of pressure measurements in vascular stenoses from phase-contrast MRI,” Magnetic Resonance in Medicine, vol. 52, no. 2, pp. 300–309, 2004.
[8] Yang, G., Kilner, P., Wood, N., Underwood, S. and Firmin, D., 1996. Computation of flow pressure fields from magnetic resonance velocity mapping. Magnetic Resonance in Medicine, 36(4), pp.520-526.
Figures