4857
A Multi-Sequence, Interleaved MRI-DMI Protocol for Human Brain1Department of Biomedical Engneering, Yale University, New Haven, CT, United States, 2Department of Radiology and Biomedical Imaging, Yale University, New Haven, CT, United States
Synopsis
Deuterium Metabolic Imaging (DMI) is an emerging method to spatially map metabolism in vivo. To enhance the time efficiency of a combined MRI-DMI protocol, interleaved MRI-DMI acquisitions were developed for multiple clinical MRI sequences. The protocol includes four MRIs that are commonly used in neurological MRI exams, namely FLAIR, T2W, SWI and T1W MP-RAGE, with DMI acquisition in parallel, acquired in 28 minutes. We demonstrate the performance of the interleaved MRI-DMI protocol on healthy human brain and discuss the guiding principles as well as limitations of extending other MRI sequences with DMI using the presented interleaving strategy.
Introduction
Deuterium Metabolic Imaging (DMI)1-5 is a powerful and potentially clinical transformative method to map metabolism in vivo. To combine DMI with clinical MRI efficiently, an interleaved 1H/2H methodology has previously been established.6 Here we present a multi-sequence interleaved MRI-DMI protocol that combines four MRI sequences, namely FLAIR, T2-weighted spin-echo (T2W), multi-slice SWI and T1-weighted MP-RAGE, with DMI without prolonging the total scan time. These MRIs cover different 2D and 3D methods and are representative of the clinical neurological scans.7,8 In this abstract, we present the design of the interleaved sequences and demonstrate the protocol on healthy human brain. We then discuss the strategies and limitations of the presented interleaving methodology.Methods
MR system, Hardware
A detailed description of the system and hardware modifications are described in the previous studies.6,9Interleaved MRI-DMI sequence
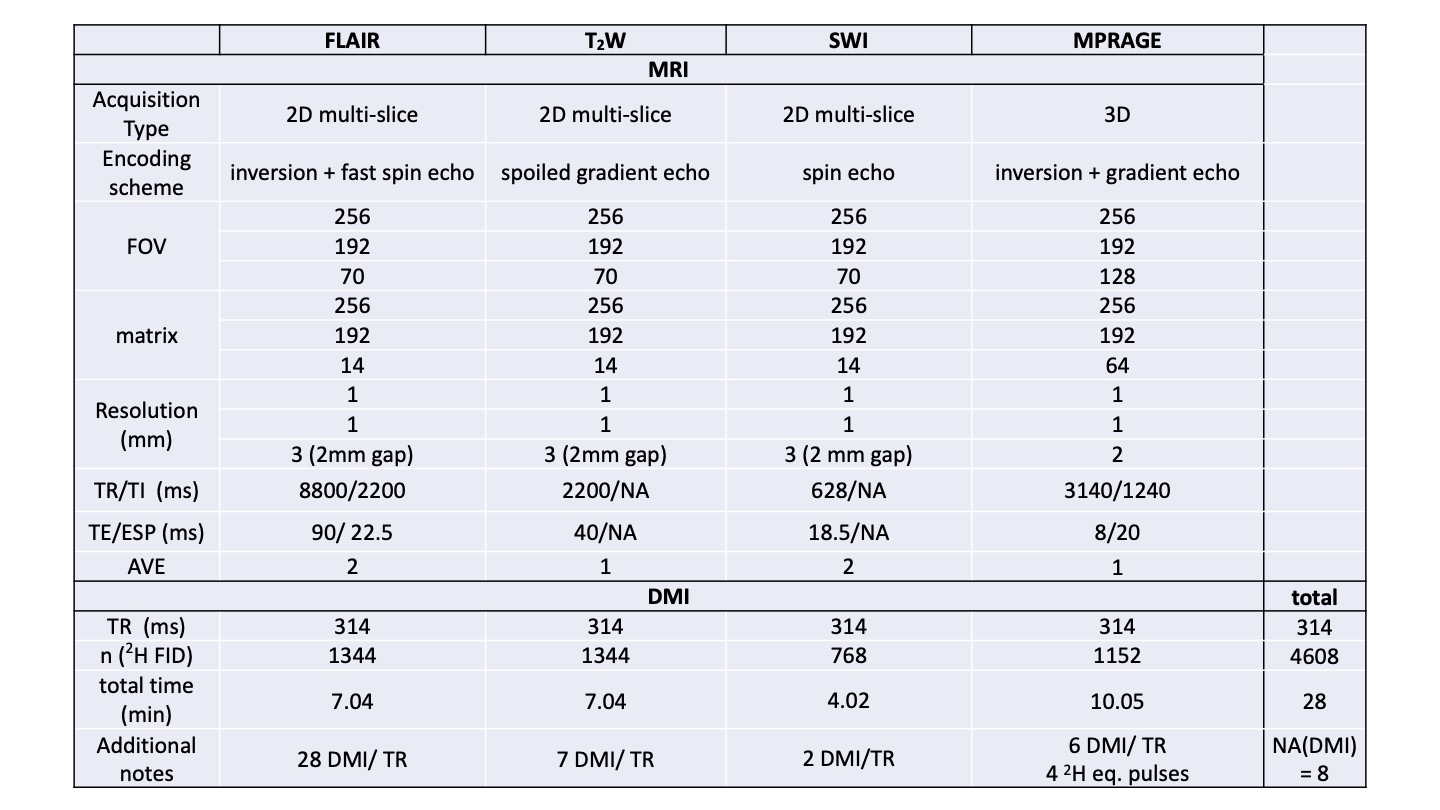
Interleaved DMI- FLAIR (Figure 1A-E), T2W (Figure 1F-J), SWI (Figure 2A-E) and MP-RAGE (Figure 2F-J) sequences are schematically illustrated, and the sequence parameters are summarized in Table 1. Briefly, for the multi-slice methods FLAIR, T2W and SWI, a total of 28, 7 and 2 DMI windows were inserted equidistantly using an acquisition time of 80 ms and TR of 314 ms. For 3D-T1W MP-RAGE, six DMI acquisitions (TR=314 ms) could be incorporated during each 1H-TR. To maintain the steady-state magnetization of 2H, four equal-distant 2H excitation RF pulses were applied during the rapid 1H acquisition window.The DMI phase-encoding scheme (spherical k-space-encoding, 491 steps) was independent from the MRI scheme and set to be continuous across the entire MRI+DMI routine. Non-phase-encoded, global 2H MR spectra were acquired in the first and last 55 2H acquisitions in each interleaved sequence. (Figure 3) During a total time of approximately 28 minutes, 8 complete DMI datasets were acquired.
Measurements
Natural abundance (N=2), and [6,6’-2H2]-glucose enriched DMI (N=2) were obtained on healthy volunteers. In the [6,6’-2H2]-glucose enriched measurements, data were acquired 60-75 min after oral intake of 55 g of [6,6’-2H2]-glucose dissolved in 250 mL of water, as described previously1. A direct global 2H MR spectrum (Figure 3) was recorded before performing the interleaved protocol.Signal processing
The proton MRIs were reordered and reconstructed via 2D or 3D Fast Fourier Transform (FFT) (Figure 4A-D). The DMI data from four interleaved measurements were phase-aligned and averaged. DMI data were fitted and processed using an in-house graphical user interface DMIWizard10. Glucose (Glc) and glutamate+glutamine (Glx) concentration maps (Figure 4G-H) were calculated based on the spectral fitting.
Results
Both the interleaved and directly acquired 2H MR spectra showed similar, anticipated patterns of water, Glc and Glx peaks (Figure 3A). SNR (Figure 3B) and linewidth (Figure 3C) were also found to be comparable in each experiment, proving that the individual DMI data acquired throughout four sequences can be re-combined to obtain high-quality DMI data.MRIs and DMI were acquired on a healthy brain using the interleaved protocol (Figure 4). Figure 4A-Dpresent images obtained using FLAIR, T2W, SWI and MP-RAGE in the same axial plane. All MRIs show the expected image contrast with high image quality. The localized DMI spectra of the highlighted voxels in Figure 4A are displayed in Figure 4E-F. The Glc concentration map (Figure 4F) indicates a relatively homogeneous glucose distribution across gray and white matter, and in the cerebrospinal fluid of the ventricles. On the other hand, the Glx (Figure 4H) distribution appears to be low in the CSF. These observations are consistent with previous reports.1,11 The lactate concentration remains low or undetectable for all the voxels as expected for a healthy brain.
Discussion
We have successfully designed and implemented a multi-sequence clinical interleaved MRI-DMI protocol and applied it on healthy human brain. The protocol includes four MRI scans (FLAIR, T2W, SWI and MP-RAGE), and allows DMI acquisition in parallel without prolonging the overall scan duration. The MRI sequences were selected to match clinical relevant scans used for brain tumour and neurological disease imaging. DWI, a prevalently used MRI scan, was not implemented due to the limited slew rate and amplitude of the current gradients. The T2W sequence can also be readily converted into DWI with choices on TE and b-value.The presented interleaved DMI-MRI strategy is able to interleave DMI into the majority of MRI acquisitions without additional scan time through the following principles. First, the DMI windows should be placed such that the 2H gradients do not affect the 1H signal and vice versa. Second, the 2H pulses need to be incorporated equidistantly. Equilibrium 2H pulses can be utilized to preserve the constant 2H-TR when necessary (i.e. in MP-RAGE). Third, the 2H acquisition windows need to be sufficiently long (circa 80 ms) to ensure a complete sampling of the 2H FID.
Limitations of the current interleaving method may appear for MRIs with extremely short TR (i.e. 3D SWI, TR equals circa 35 ms), where a full DMI acquisition cannot be directly placed within the inherent MRI delays. In the current study, we circumvented this problem by executing the SWI sequence as a multi-slice 2D method. However, to interleave DMI in short-TR MRIs without changing the sequence, alternative strategies, including gradient-echo-based DMI12 or short DMI acquisition windows combined with time-domain spectral fitting, could be used.
Acknowledgements
This research was funded, in part, by NIH grant NIBIB R01-EB025840.
References
1. De Feyter HM, Behar KL, Corbin ZA, et al. Deuterium metabolic imaging (DMI) for MRI-based 3D mapping of metabolism in vivo. Science Advances. 2018;4(8):eaat7314.
2. Kreis F, Wright AJ, Hesse F, Fala M, Hu D-e, Brindle KM. Measuring Tumor Glycolytic Flux in Vivo by Using Fast Deuterium MRI. Radiology. 2019;294(2):289-296.
3. Riis-Vestergaard MJ, Laustsen C, Mariager CØ, Schulte RF, Pedersen SB, Richelsen B. Glucose metabolism in brown adipose tissue determined by deuterium metabolic imaging in rats. International Journal of Obesity. 2020.
4. Mathy CS, Thomas MA, Mason GF, de Graaf RA, De Feyter HM. Validation of dynamic Deuterium Metabolic Imaging (DMI) for the measurement of cerebral metabolic rates of glucose in rat. ISMRM; 2021.
5. De Feyter HM, de Graaf RA. Deuterium metabolic imaging – Back to the future. Journal of Magnetic Resonance. 2021;326:106932.
6. Liu Y, De Feyter HM, McIntyre S, Nixon TW, de Graaf RA. Interleaved MRI and DMI on human brain in vivo. ISMRM; 2021.
7. Hajnal JV, Bryant DJ, Kasuboski L, et al. Use of fluid attenuated inversion recovery (FLAIR) pulse sequences in MRI of the brain. J Comput Assist Tomogr. 1992;16(6):841-844.
8. Ellingson BM, Bendszus M, Boxerman J, et al. Consensus recommendations for a standardized Brain Tumor Imaging Protocol in clinical trials. Neuro Oncol. 2015;17(9):1188-1198.
9. Nixon TW, Liu Y, De Feyter HM, McIntyre S, Graaf RAd. Hardware developed for phase and frequency locking of interleaved MRI and DMI studies. ISMRM; 2021.
10. Yale-School-of-Medicine. Deuterium Metabolic Imaging. https://medicine.yale.edu/lab/dmi/. Published 2019. Updated 01/15/2020. Accessed2021.
11. Ruhm L, Avdievich N, Ziegs T, et al. Deuterium Metabolic Imaging in the human brain at 9.4 Tesla with high spatial and temporal resolution. Neuroimage. 2021:118639.
12. Peters DC, Markovic S, Bao Q, et al. Improving deuterium metabolic imaging (DMI) signal-to-noise ratio by spectroscopic multi-echo bSSFP: A pancreatic cancer investigation. Magnetic Resonance in Medicine. 2021;86(5):2604-2617.
Figures
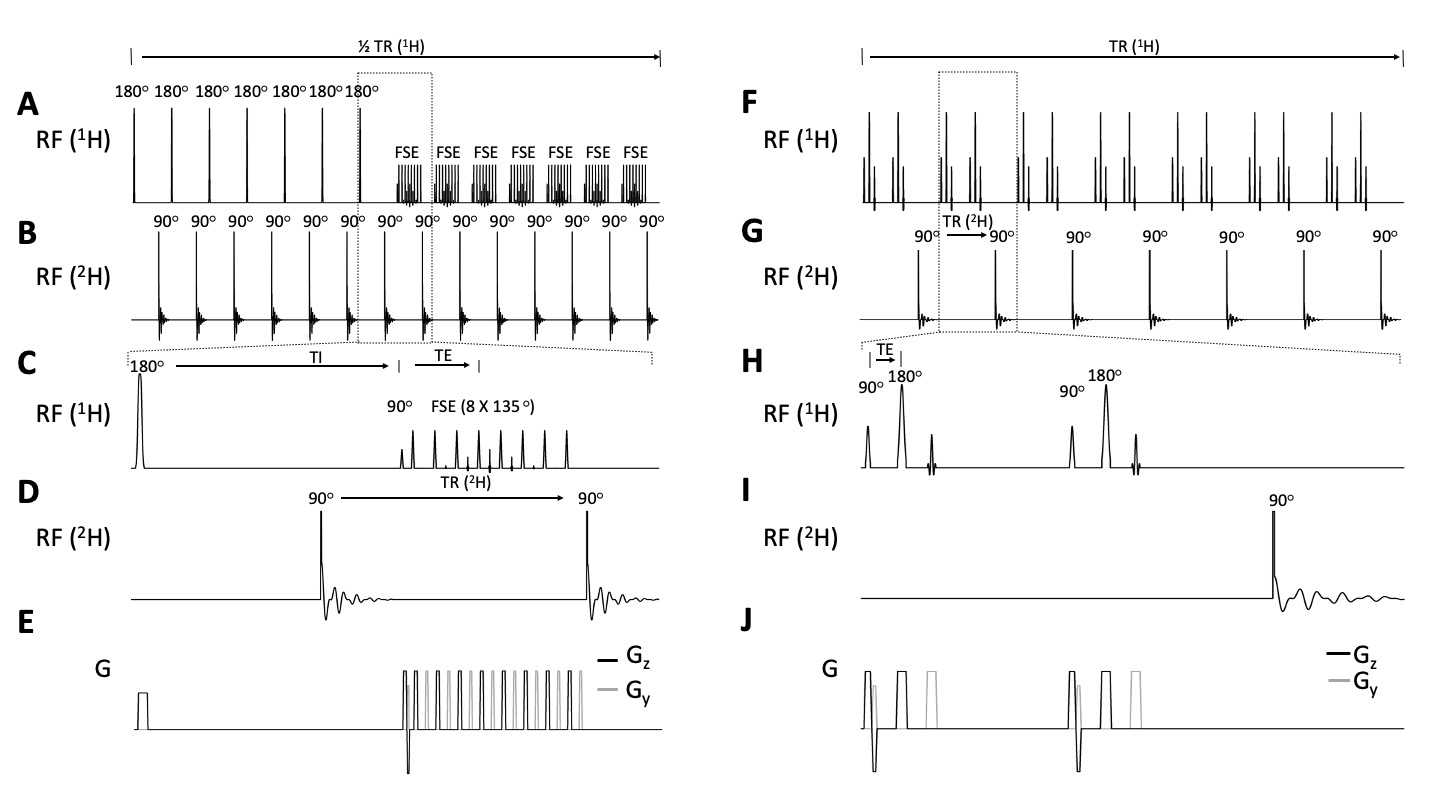
Figure 1. Interleaved FLAIR-DMI (A-E) and T2W-DMI sequence (F-J). (A) FLAIR1H pulse acquisition. 7 slices are inverted followed by FSE (TR/TI/TE = 8800/2200/90 ms). The 2H windows (B) are placed after TI and FSE with equal 2H TR (= 314 ms). 28 2H FID are achieved in 11H TR.(F) T2W 1H pulse acquisition. 14 slices are excited and refocused (TR/TE = 2200/40 ms). The 2H windows (G) are placed every 2 excitations to keep the2H TR = 314 ms. 7 2H FID are measured in 1 1H TR.(C-E) and (H-J) show detailed 1H, 2H pulse-acquisition and gradients schemes of Interleaved FLAIR and T2W -DMI respectively.
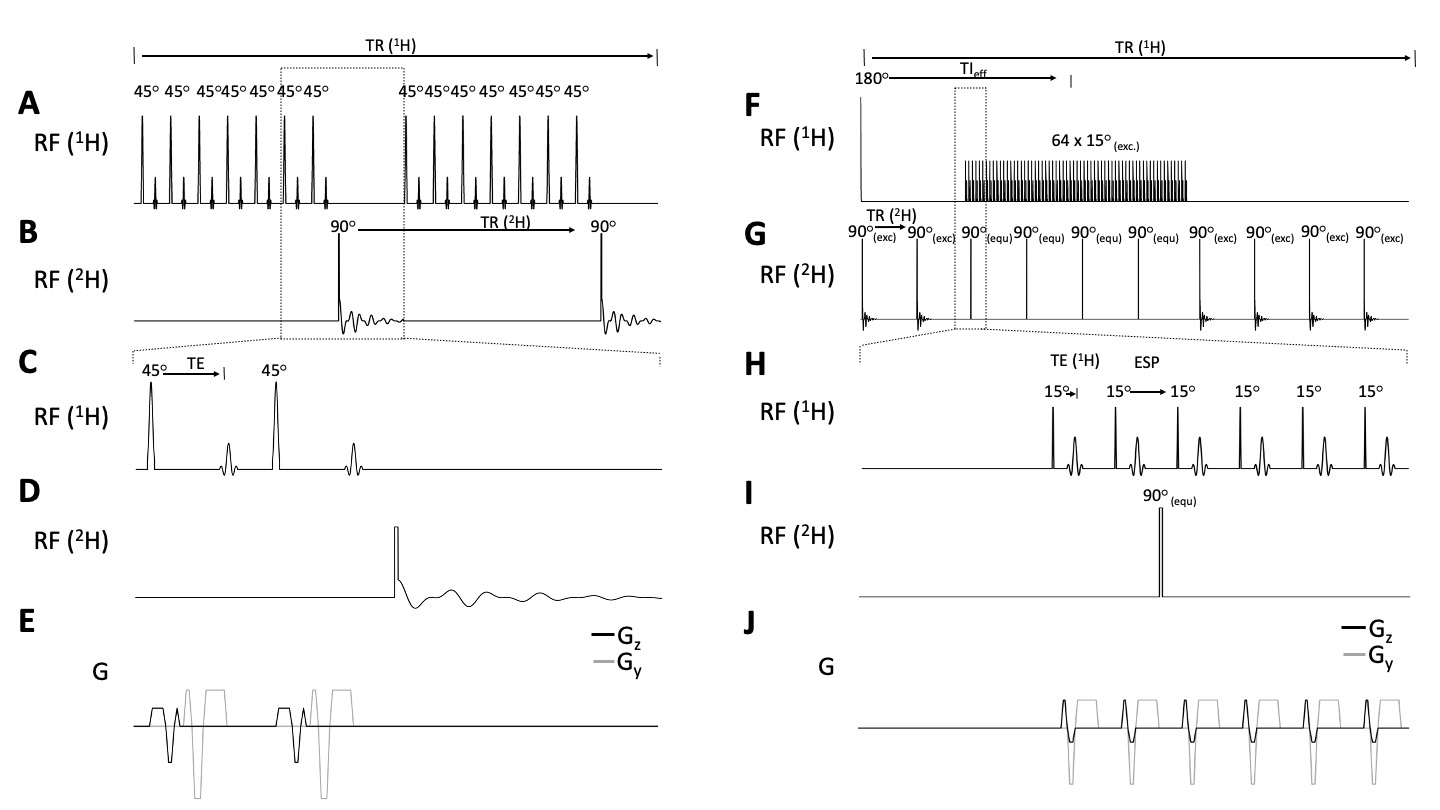
Figure 2. Interleaved multi-slice, flow-compensated SWI-DMI (A-E) and 3D MP-RAGE-DMI (F-J) sequence. (A) SWI 1H pulse acquisition (TR/TE = 628/18.5 ms, FA=45o). The 2H windows (B) are placed every 7 excitations (2H TR = 314 ms). (F) MP-RAGE 1H pulse acquisition (TE/ESP= 8/20 ms, TR/TIeff/T= 3140/1240 ms). A total of 6 2H pulse-acquisitions (G) are placed in 1H TR with equal TR (= 314 ms). 4 2H equilibrium pulses are inserted to preserve 2H magnetic steady-state. (C-E) and (H-J) show detailed 1H,2H pulse-acquisition and gradients schemes of Interleaved SWI and MP-RAGE -DMI respectively.
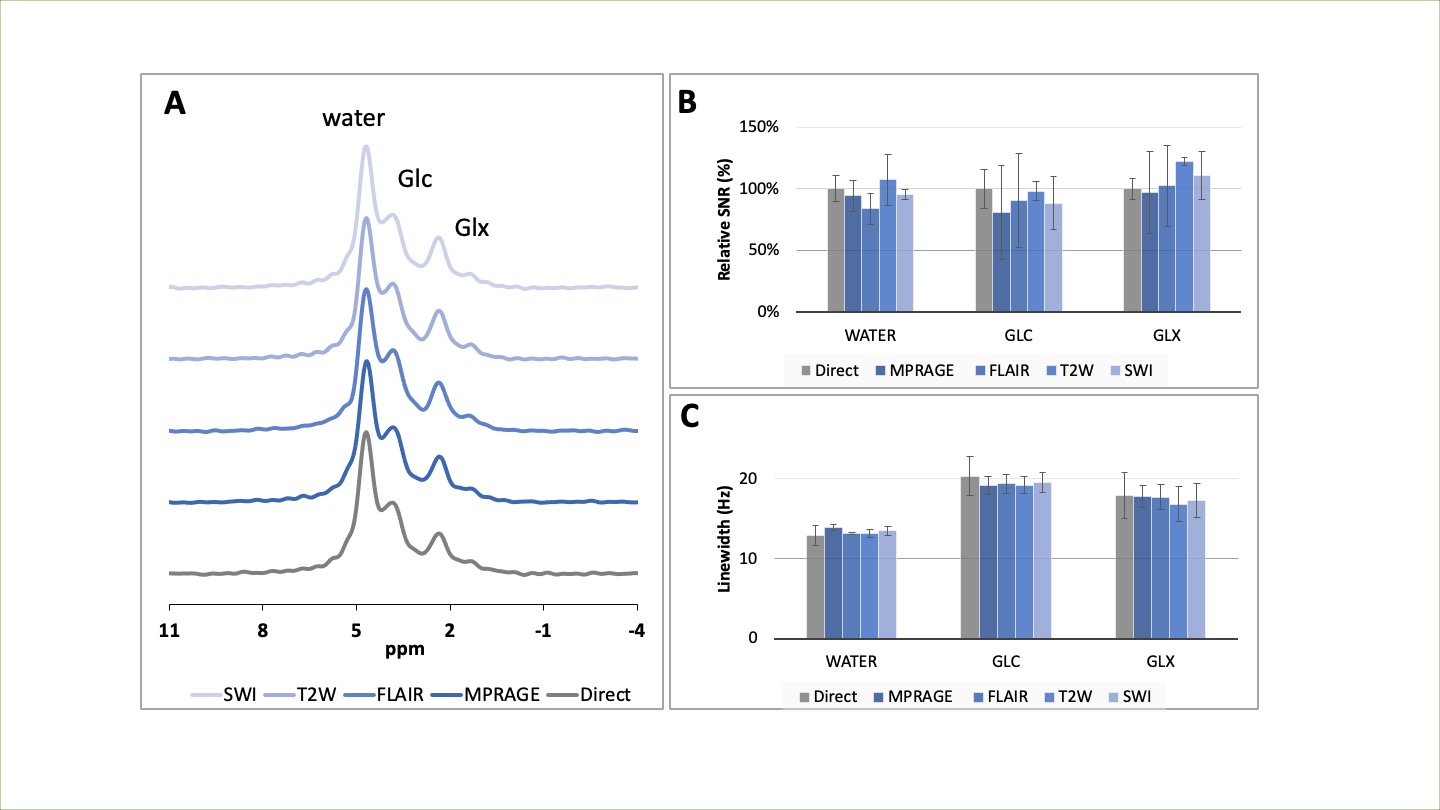
Figure 3. A comparison of global 2H MR spectra (NA=110) in healthy human brain (N=2) using interleaved and direct acquisitions. (A) Shows the direct and interleaved 2H MR spectra acquired in vivo. The peaks can be fitted with LC Model through least-squares minimization, using Lorentzian line shape and zero-order baseline estimation. The SNR was calculated using the integrated area of the peaks extracted from the spectral fit. (B) Shows the % SNR relative to that of the direct reference. The linewidth in Hz (C) of the signal was also compared. The error bars represent S.D. across 2 subjects.
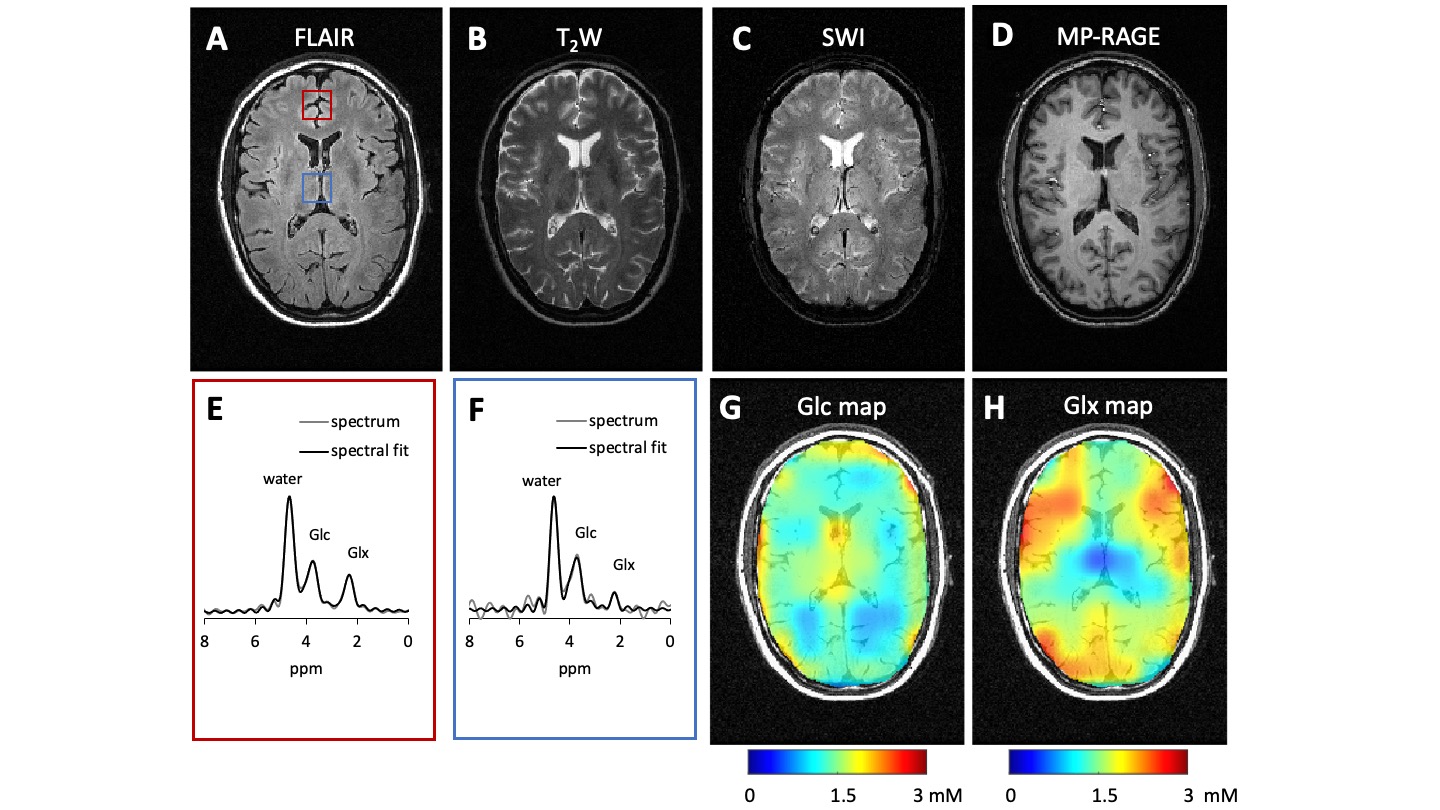
Figure 4. Interleaved MRI and DMI of a healthy brain. DMI and MRIs were acquired using parameters indicated in Table 1. During the 28 min acquisition, the DMI data could be acquired 8 times (i.e. NA = 8). (A-D) The FLAIR, T2W, SWI and MP-RAGE images of the same slice position. (E-F) The localized 2H MR spectra correspond to the voxels highlighted in (A). (G-H) Concentration maps of 2H-labelled Glc and Glx based on LCM spectral fitting, assuming the amount of deuterium in water remains constant across voxels (10 mM). All the maps were corrected for T1 and B1 effects and 2H label loss.