4855
Correlates of Perivascular Spaces Volume Based on Automated Segmentation of T1-weighted MRI1Department of Bioengineering, School of Engineering and Applied Science, University of Pennsylvania, Philadelphia, PA, United States, 2Department of Neurology, Perelman School of Medicine, University of Pennsylvania, Philadelphia, PA, United States, 3Department of Radiology, Perelman School of Medicine, University of Pennsylvania, Philadelphia, PA, United States, 4Laboratory of Neuroimaging, Keck School of Medicine of USC, University of Southern California, Los Angeles, CA, United States
Synopsis
Perivascular spaces (PVS) are a component of the glymphatic system, the brain-wide waste drainage pathway, but the pathophysiological significance of enlarged perivascular space volume is incompletely characterized. We obtained PVS segmentations from 167 cognitively intact or mildly symptomatic older subjects from high-resolution T1-weighted MRI using an automated approach and correlated PVS volume with both amyloid status, as determined by amyloid PET, and cortical thickness changes from normative values. Automated PVS segmentations required additional masking of CSF spaces and manual exclusion of some lacunar infarcts. PVS volume was correlated with brain atrophy and not amyloid status.
Introduction
Perivascular spaces (PVS) are the fluid spaces that surround small blood vessels in the brain parenchyma. PVS were first described in the 1840s but has only come to attention in the past decade due to improved visualization, as enlarged PVS are readily seen on high-resolution MRI1,2. PVS are thought to be a critical component of the glymphatic (‘glial lymphatic’) system, which is a brain-wide waste drainage pathway, implicated in clearance of ß-amyloid peptides3. Glymphatic dysfunction is associated with proteinopathies, such as Alzheimer’s disease4. Based on this notion, PVS volume has been proposed as a biomarker of glymphatic function. However, enlarged non-parenchymal spaces may also be due to brain atrophy.Assessment of PVS has primarily been based on visual inspection and qualitative scoring; manual segmentation is extremely challenging and labor intensive5,6. Recently, methods for automated segmentation of PVS from structural MRI have been reported. The approach described by Sepehrband et al. can derive PVS in both white matter (WM) and basal ganglia (BG) from T1-weighted MRI scans7. Although both T1-weighted and T2-weighted scans results in better segmentation, only T1-weighted 3D MRI data were available from our cohort of 167 older subjects. Following automated segmentation, we then manually corrected the errors of the automated PVS segmentation by removing extra-axial CSF and lacunar infarcts from the PVS mask. We then correlated the WM PVS volume with PET amyloid status and cortical thickness.
Methods
Data from 167 cognitively intact or mildly symptomatic older subjects with age of 73 ± 7 years old (78 male) were used for the study. The median Global Clinical Dementia Rating (CDR) of the cohort was 0.T1-weighted MRI images were acquired in a 3 T scanner (MAGNETOM Prisma, Siemens Healthineers, Erlangen, Germany) using 3D MP-RAGE (0.8 x 0.8 x 0.8 mm3, TE/TR/TI = 2.24 ms/2.4 s/1060 ms)8. Cortical thickness was calculated using ANTs (Advanced Normalization Tools), and w-scores, representing age- and sex-adjusted deviation in thickness compared to N = 868 normative scans with the same acquisition protocol, were calculated in 200 cortical regions (Schaefer 2018) for further analysis9,10. 18F-Florbetaben PET was acquired on an Ingenuity TF PET/CT scanner (Phillips Healthcare, Amsterdam, Netherlands) with CT attenuation correction. Amyloid status was subsequently determined by a radiologist. 64 subjects (38.3%) were amyloid-positive.
Automated PVS segmentation was performed on T1-weighted images using the method described in Sepehrband et al. with the default threshold and parameters7. Cerebrospinal fluid (CSF) and lacunar infarct artifacts partially misclassified as WM PVS (Figure 1). CSF regions were segmented through FAST (FMRIB's Automated Segmentation Tool) and were excluded from the WM PVS segmentation11. Out of 167 segmentations, 92 were free of additional artifacts, 46 required additional manual exclusion of scattered lacunar infarcts, and 29 segmentations (14 amyloid-positive) were rejected due to extensive overlap between white matter lesions and PVS segmentations that could not be manually edited.
Results
WM PVS volume correlated with age (p = 0.0112, Figure 2) as suggested in previous literature using qualitative assessment6. A two-sample t-test performed to evaluate the association between WM PVS volume and amyloid status showed no significant difference (p = 0.471, Figure 3).Linear regression was performed to evaluate correlations between WM PVS volume and both overall and regional cortical thickness using the weighted average of w-scores for cortical regions based on the Schaefer 2018 atlas10. Results shown in Figure 4 show that increased WM PVS volume is strongly correlated with reduced overall cortical thickness (p < 0.001). At the regional level, similar significant correlations were observed for all but a few parcellations located dorsally, including the sensorimotor cortex and adjacent association cortices (Figure 5a). After applying Bonferroni correction for N = 200 comparisons, significant correlations remain primarily in prefrontal, orbitofrontal, and visual cortices (Figure 5b).
Discussion
Although impaired glymphatic function is thought to contribute to Alzheimer’s pathogenesis, WM PVS volume was not associated with amyloid status, suggesting that changes in PVS volume are not a biomarker for preclinical Alzheimer’s disease. However, this relationship might differ in more advanced disease or with measures of amyloid flux. A strong inverse correlation between WM PVS volume and cortical thickness was present, suggesting that PVS volume is sensitive to parenchymal loss. Less than 15% of the variance in PVS volume was explained by cortical thickness changes, suggesting the potential for multiple contributing mechanisms, including glymphatic function. The use of both T1-weighted and T2-weighted MRI, if available, for automated PVS segmentation may strengthen the observed correlations.Conclusions
In cognitively intact or mildly symptomatic older subjects, PVS volume is reflective of brain atrophy and not alterations in glymphatic function reflected in amyloid status. Automated Artifacts in PVS segmentation based only on T1-weighted MRI can readily be corrected in most cases.Acknowledgements
This work was funded by P30 AG072979 and R01-AG066152.References
1. Kwee, R. M. & Kwee, T. C. Virchow-Robin spaces at MR imaging. Radiographics 27, 1071-U1037, doi:10.1148/rg.274065722 (2007).
2. Woollam, D. H. & Millen, J. W. The perivascular spaces of the mammalian central nervous system and their relation to the perineuronal and subarachnoid spaces. J Anat 89, 193-200 (1955).
3. Rasmussen, M. K., Mestre, H. & Nedergaard, M. The glymphatic pathway in neurological disorders. Lancet Neurol 17, 1016-1024, doi:Doi 10.1016/S1474-4422(18)30318-1 (2018).
4. Mestre, H., Kostrikov, S., Mehta, R. I. & Nedergaard, M. Perivascular spaces, glymphatic dysfunction, and small vessel disease. Clin Sci 131, 2257-2274, doi:10.1042/Cs20160381 (2017).
5. Wardlaw, J. M. et al. Perivascular spaces in the brain: anatomy, physiology and pathology. Nat Rev Neurol 16, 137-153, doi:10.1038/s41582-020-0312-z (2020).
6. Heier, L. A., Bauer, C., Schwartz, L., Zimmerman, R. D. & Deck, M. D. F. Large Virchow-Robin Spaces - Mr-Clinical Correlation. Am J Neuroradiol 9, 1033-1033 (1988).
7. Sepehrband, F. et al. Image processing approaches to enhance perivascular space visibility and quantification using MRI. Sci Rep-Uk 9, doi:ARTN 1235110.1038/s41598-019-48910-x (2019).
8. Mugler, J. P. & Brookeman, J. R. 3-Dimensional Magnetization-Prepared Rapid Gradient-Echo Imaging (3dmp-Rage). Magn Reson Med 15, 152-157, doi:DOI 10.1002/mrm.1910150117 (1990).
9. Das, S. R., Avants, B. B., Grossman, M. & Gee, J. C. Registration based cortical thickness measurement. Neuroimage 45, 867-879, doi:10.1016/j.neuroimage.2008.12.016 (2009).
10. Schaefer, A. et al. Local-Global Parcellation of the Human Cerebral Cortex from Intrinsic Functional Connectivity MRI. Cereb Cortex 28, 3095-3114, doi:10.1093/cercor/bhx179 (2018).
11. Zhang, Y. Y., Brady, M. & Smith, S. Segmentation of brain MR images through a hidden Markov random field model and the expectation-maximization algorithm. Ieee T Med Imaging 20, 45-57, doi:Doi 10.1109/42.906424 (2001).
Figures
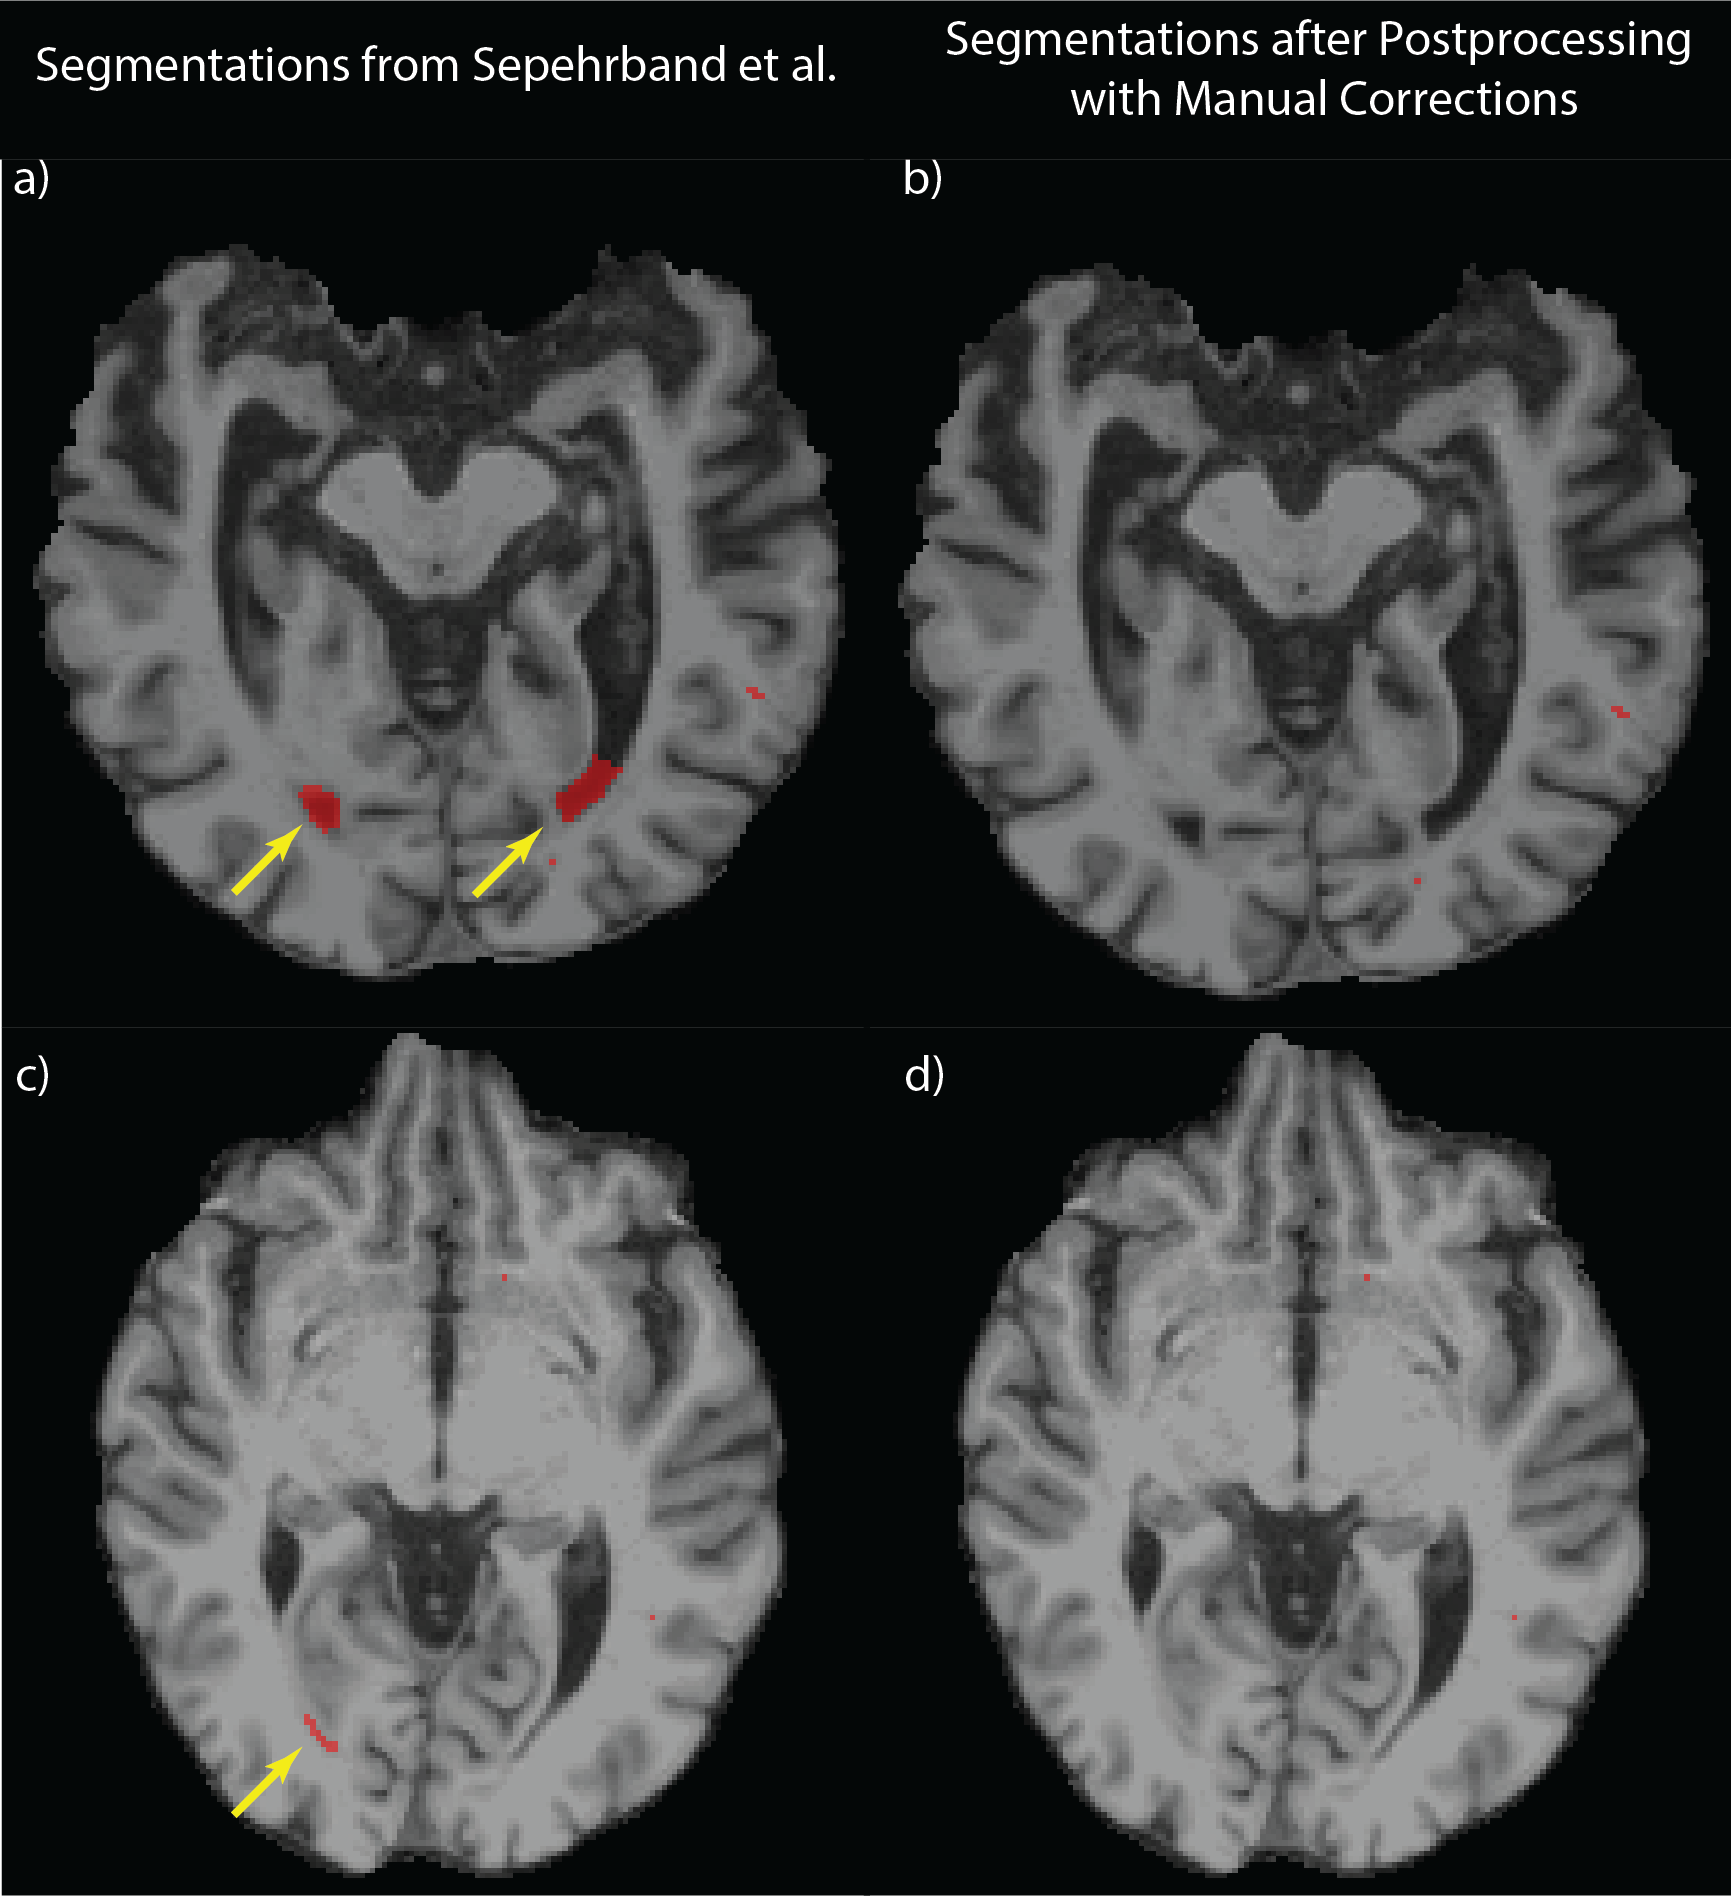
Figure 1: Artifacts from Automated PVS Segmentation
a) demonstrates the artifacts (yellow arrows) due to the misclassification of CSF at ventricles using the method described in Sephrband et al7. b) shows that the artifacts are eliminated by the automated postprocessing without the manual correction. c) shows the artifacts (yellow arrow) due to the misclassification of lacunar infarcts, d) shows that the automated postprocessing failed to remove the artifacts and the manual correction was performed instead.
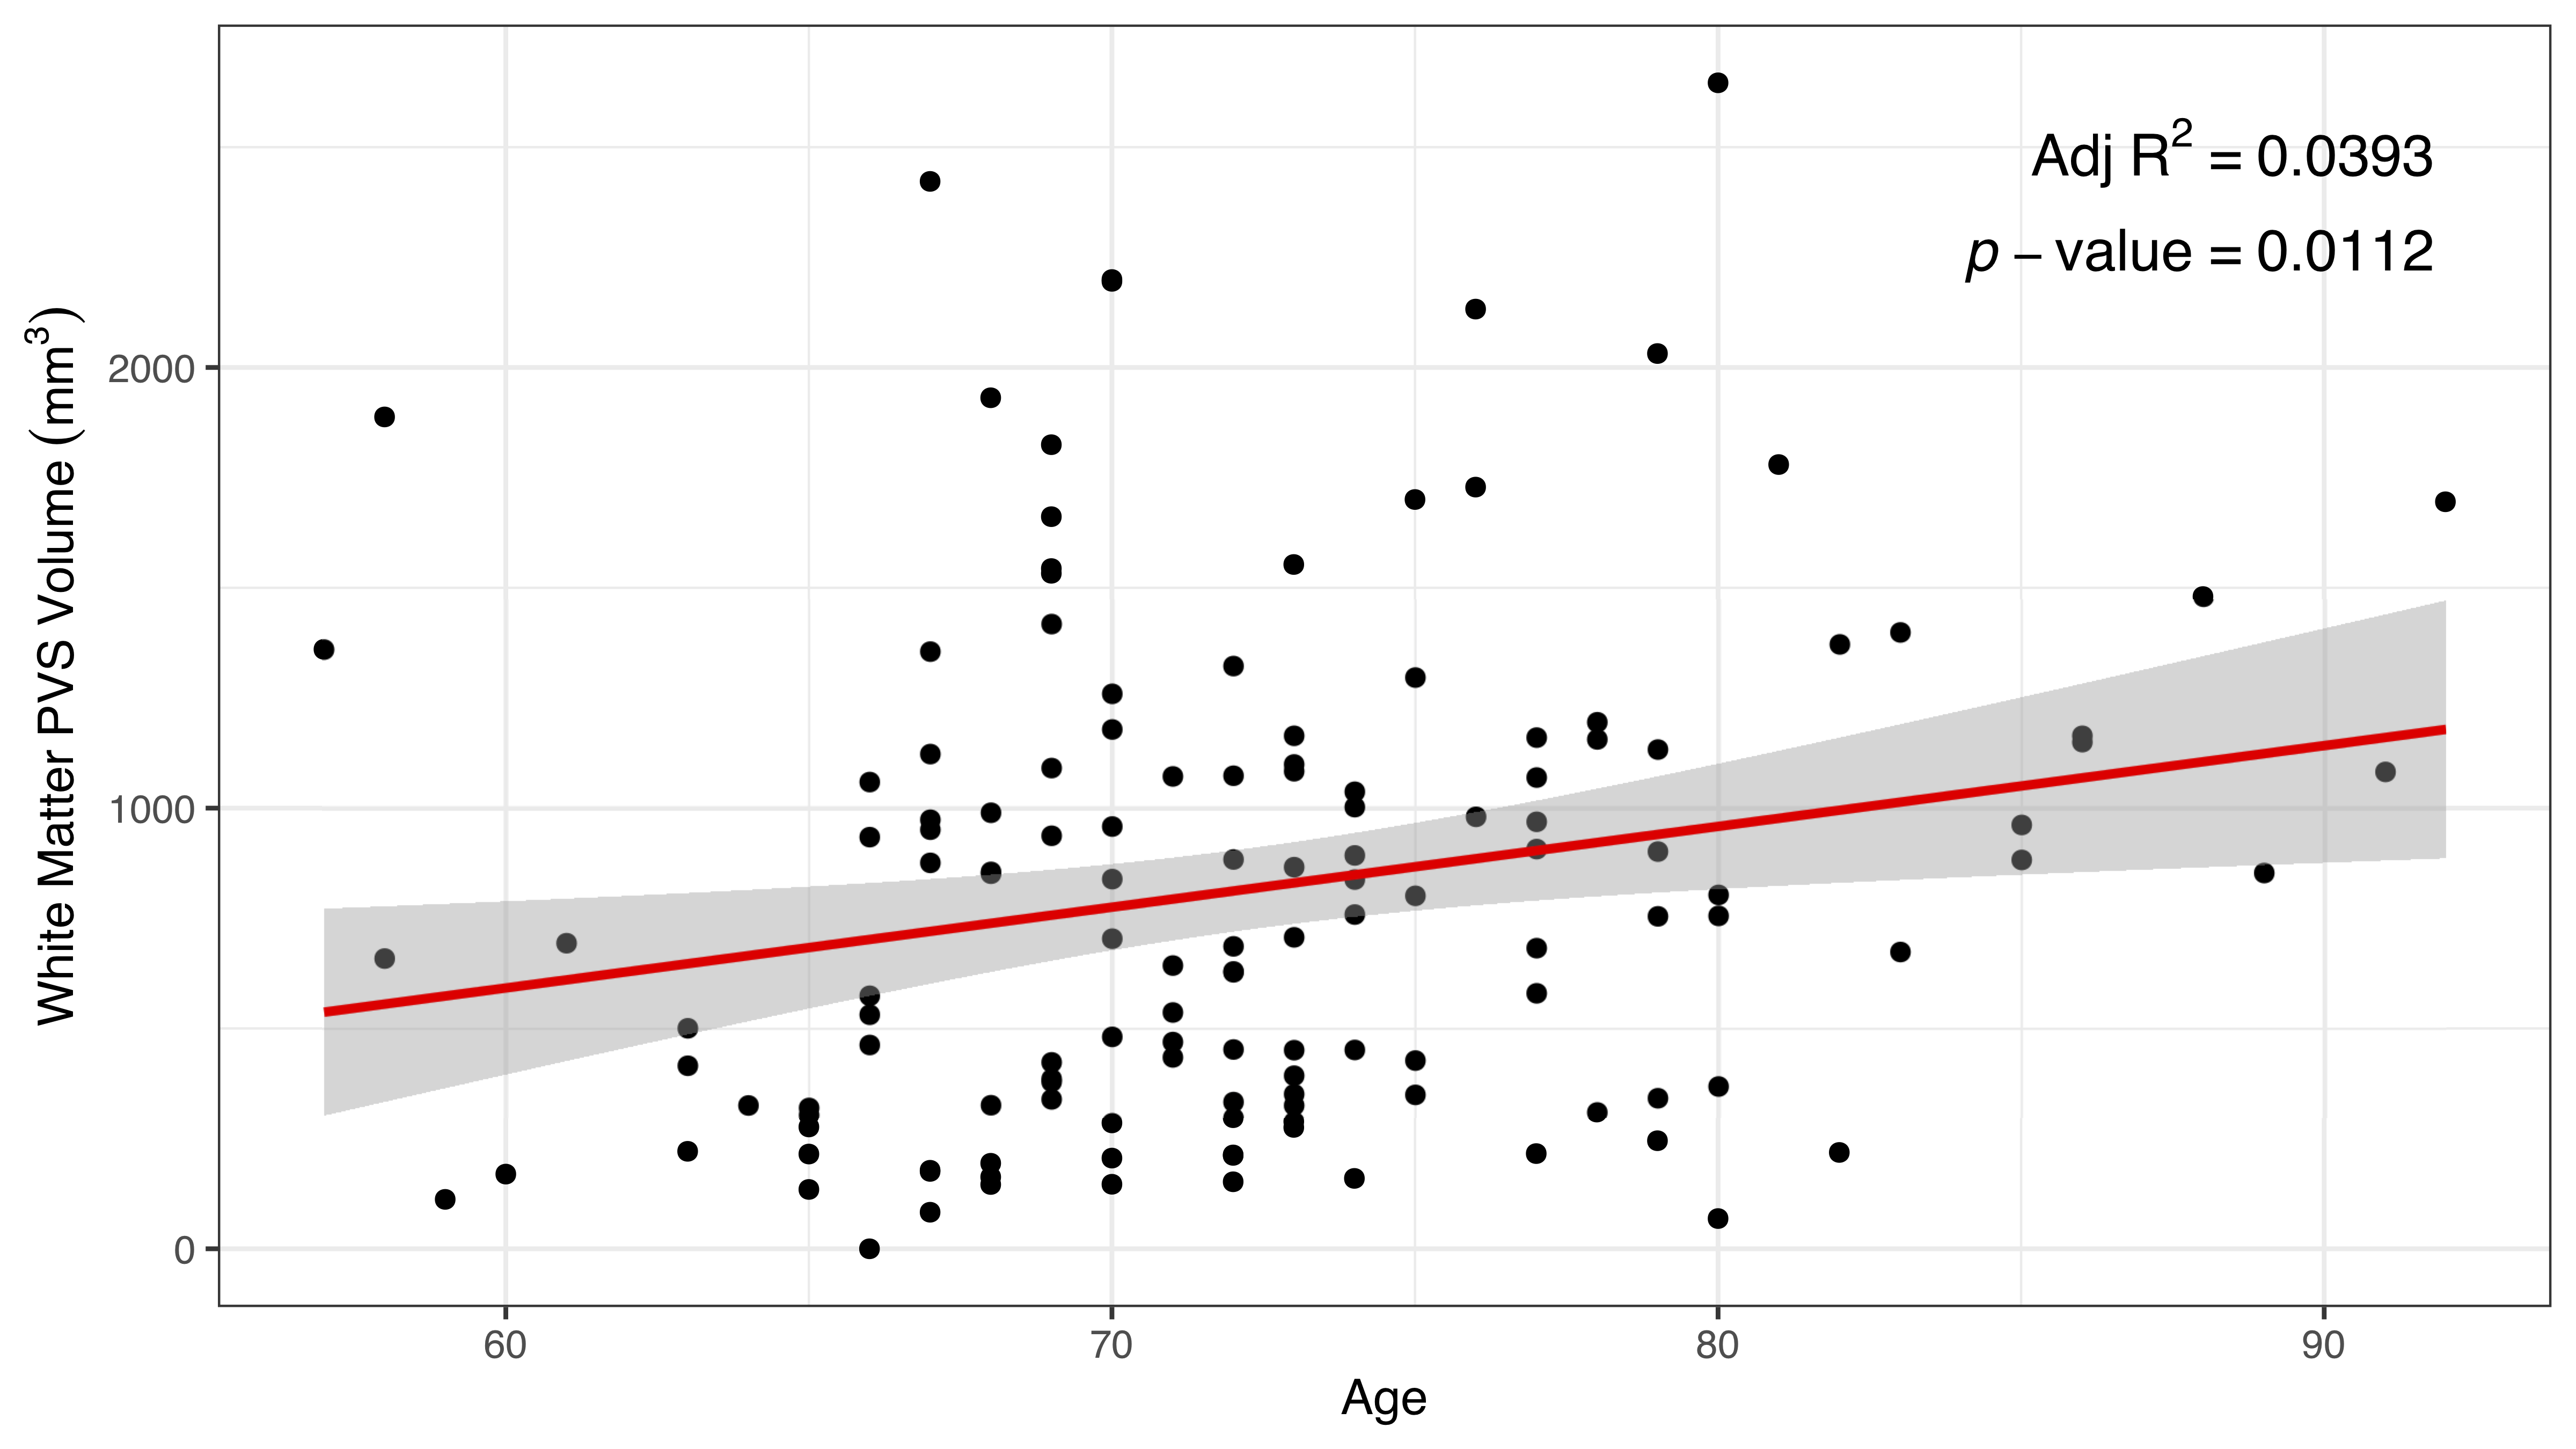
Figure 2: Association Between Age and White Matter PVS Volume
Linear regression was performed on 138 WM PVS segmentations. The result shows a strong correlation between age and WM PVS volume as suggested qualitatively in previous literature (p = 0.0112)6.
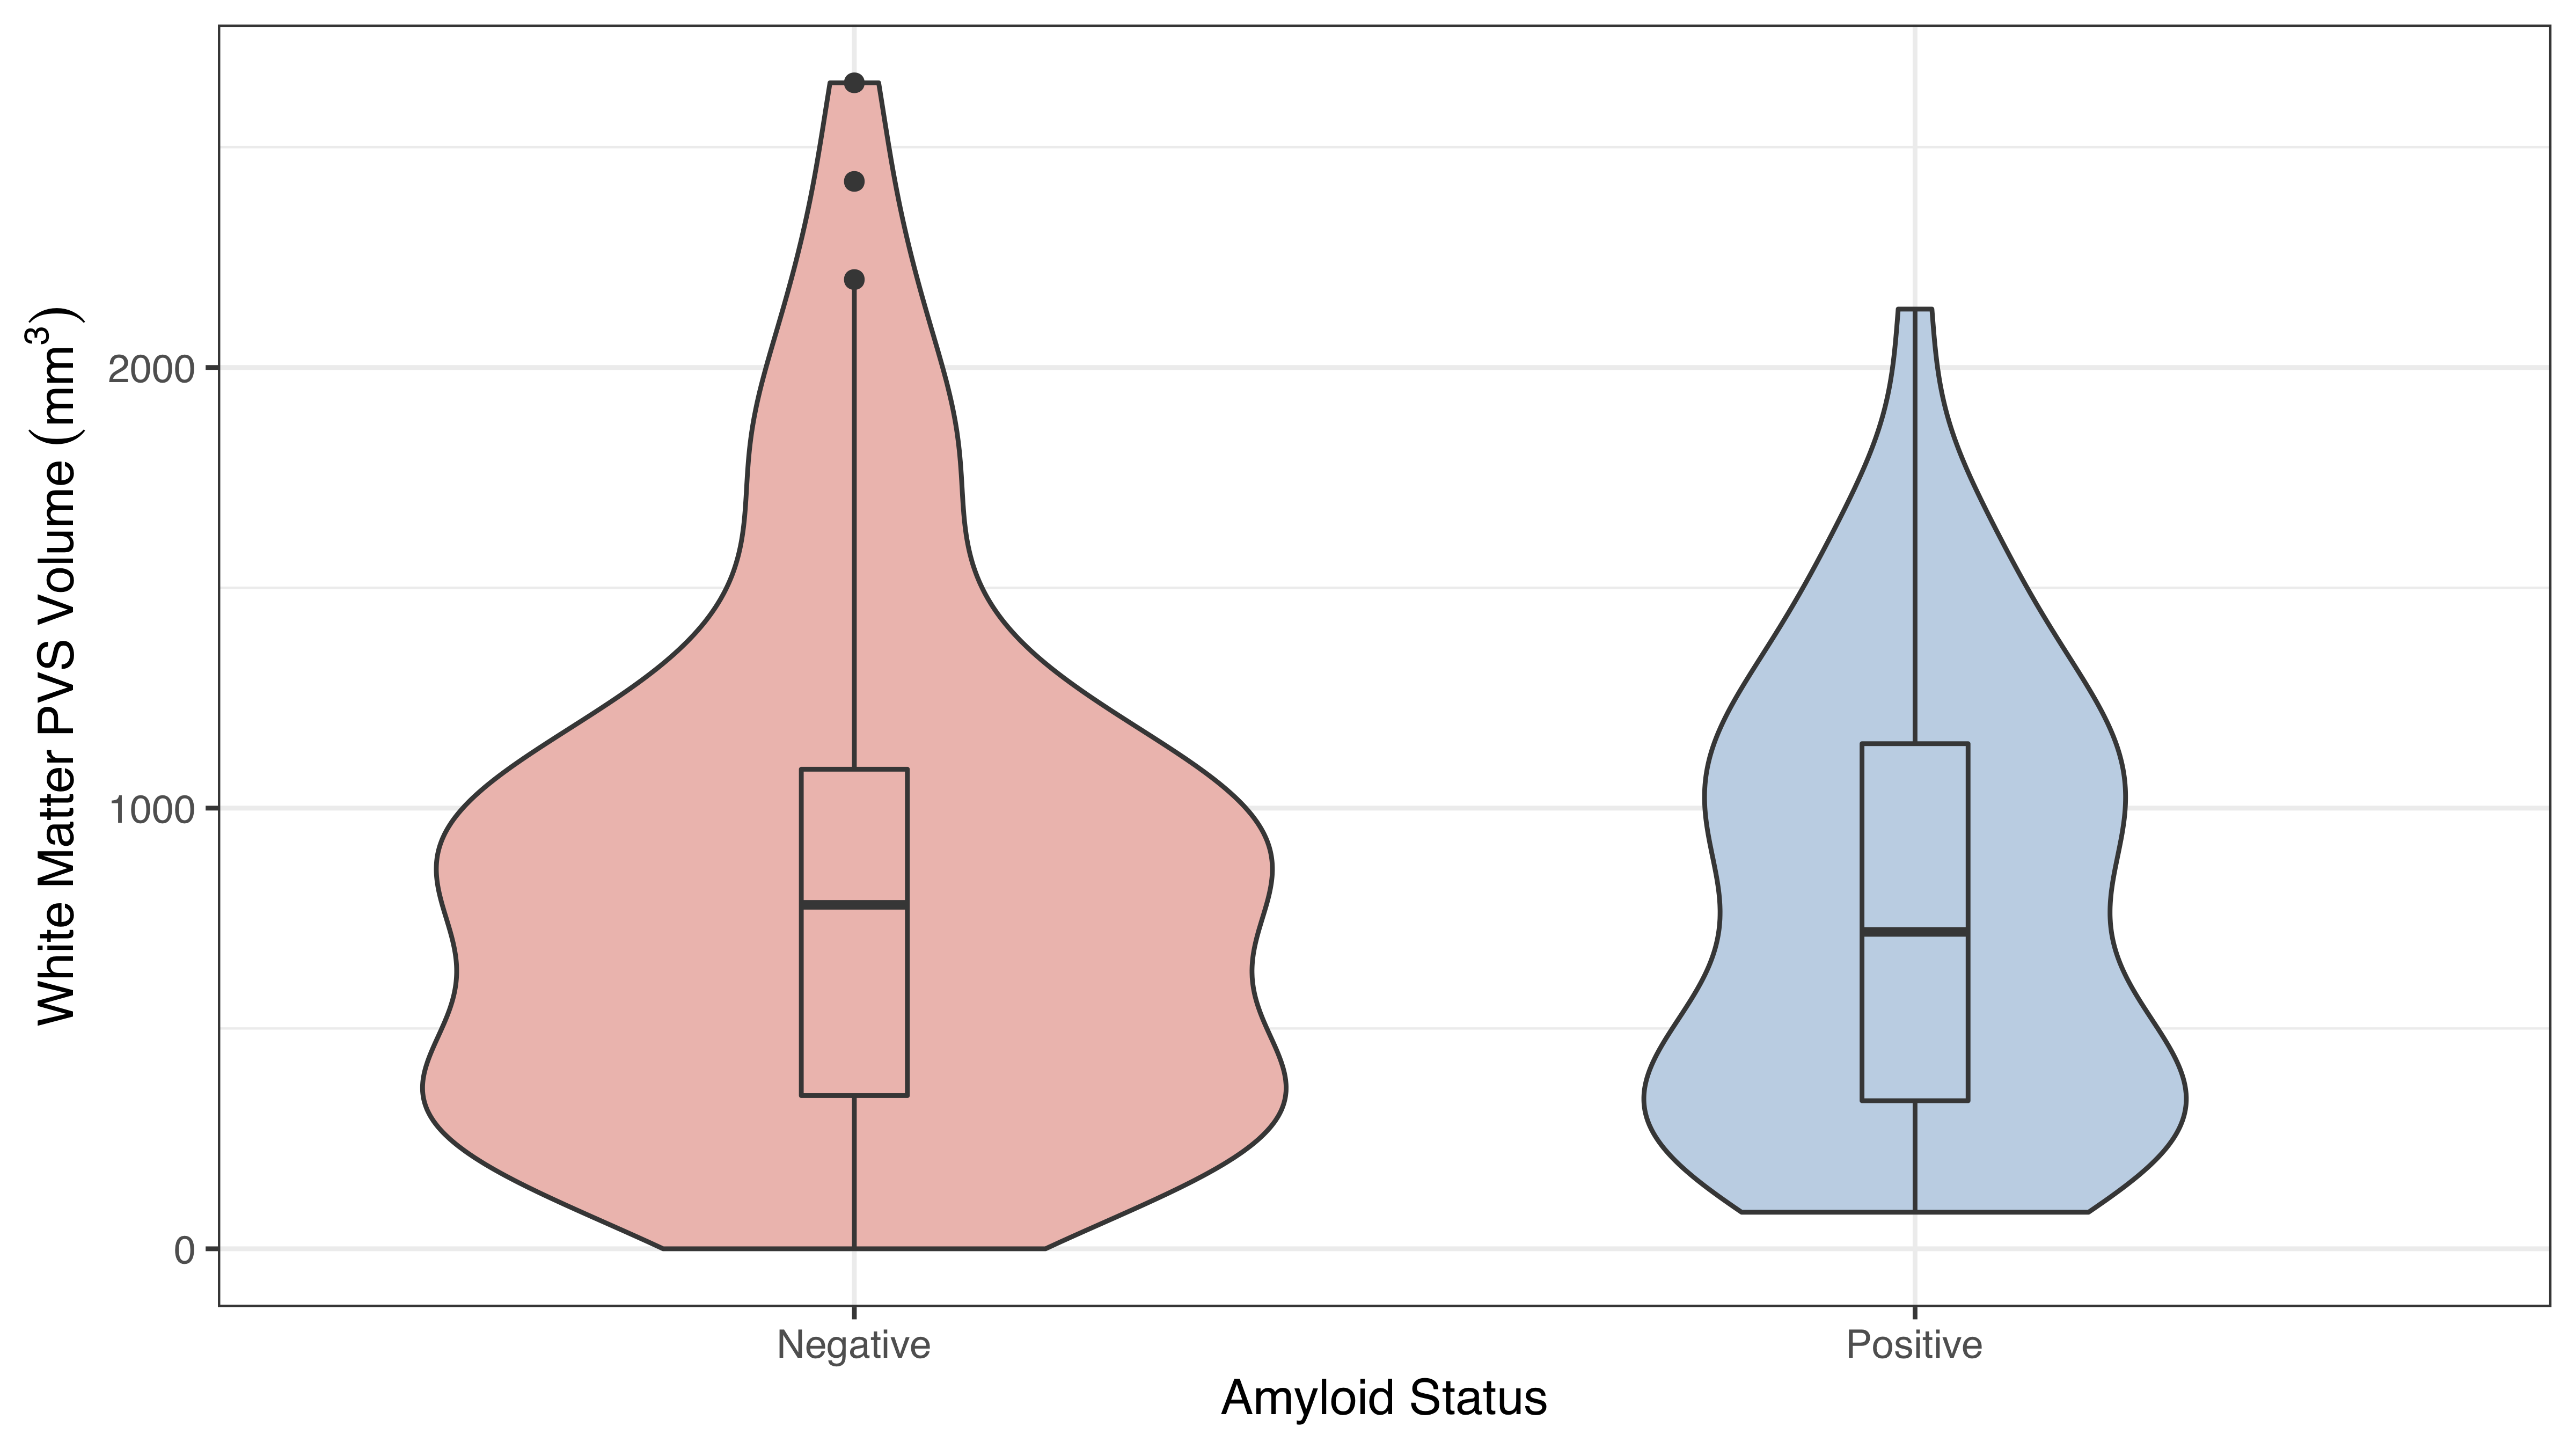
Figure 3: Correlation Between Amyloid Status and White Matter PVS Volume
A two-sample t-test was performed based on amyloid status for WM PVS volume. The result suggests no statistical significance among the two groups (p = 0.471). This may indicate PVS volume is less reflective as altered glymphatic function.
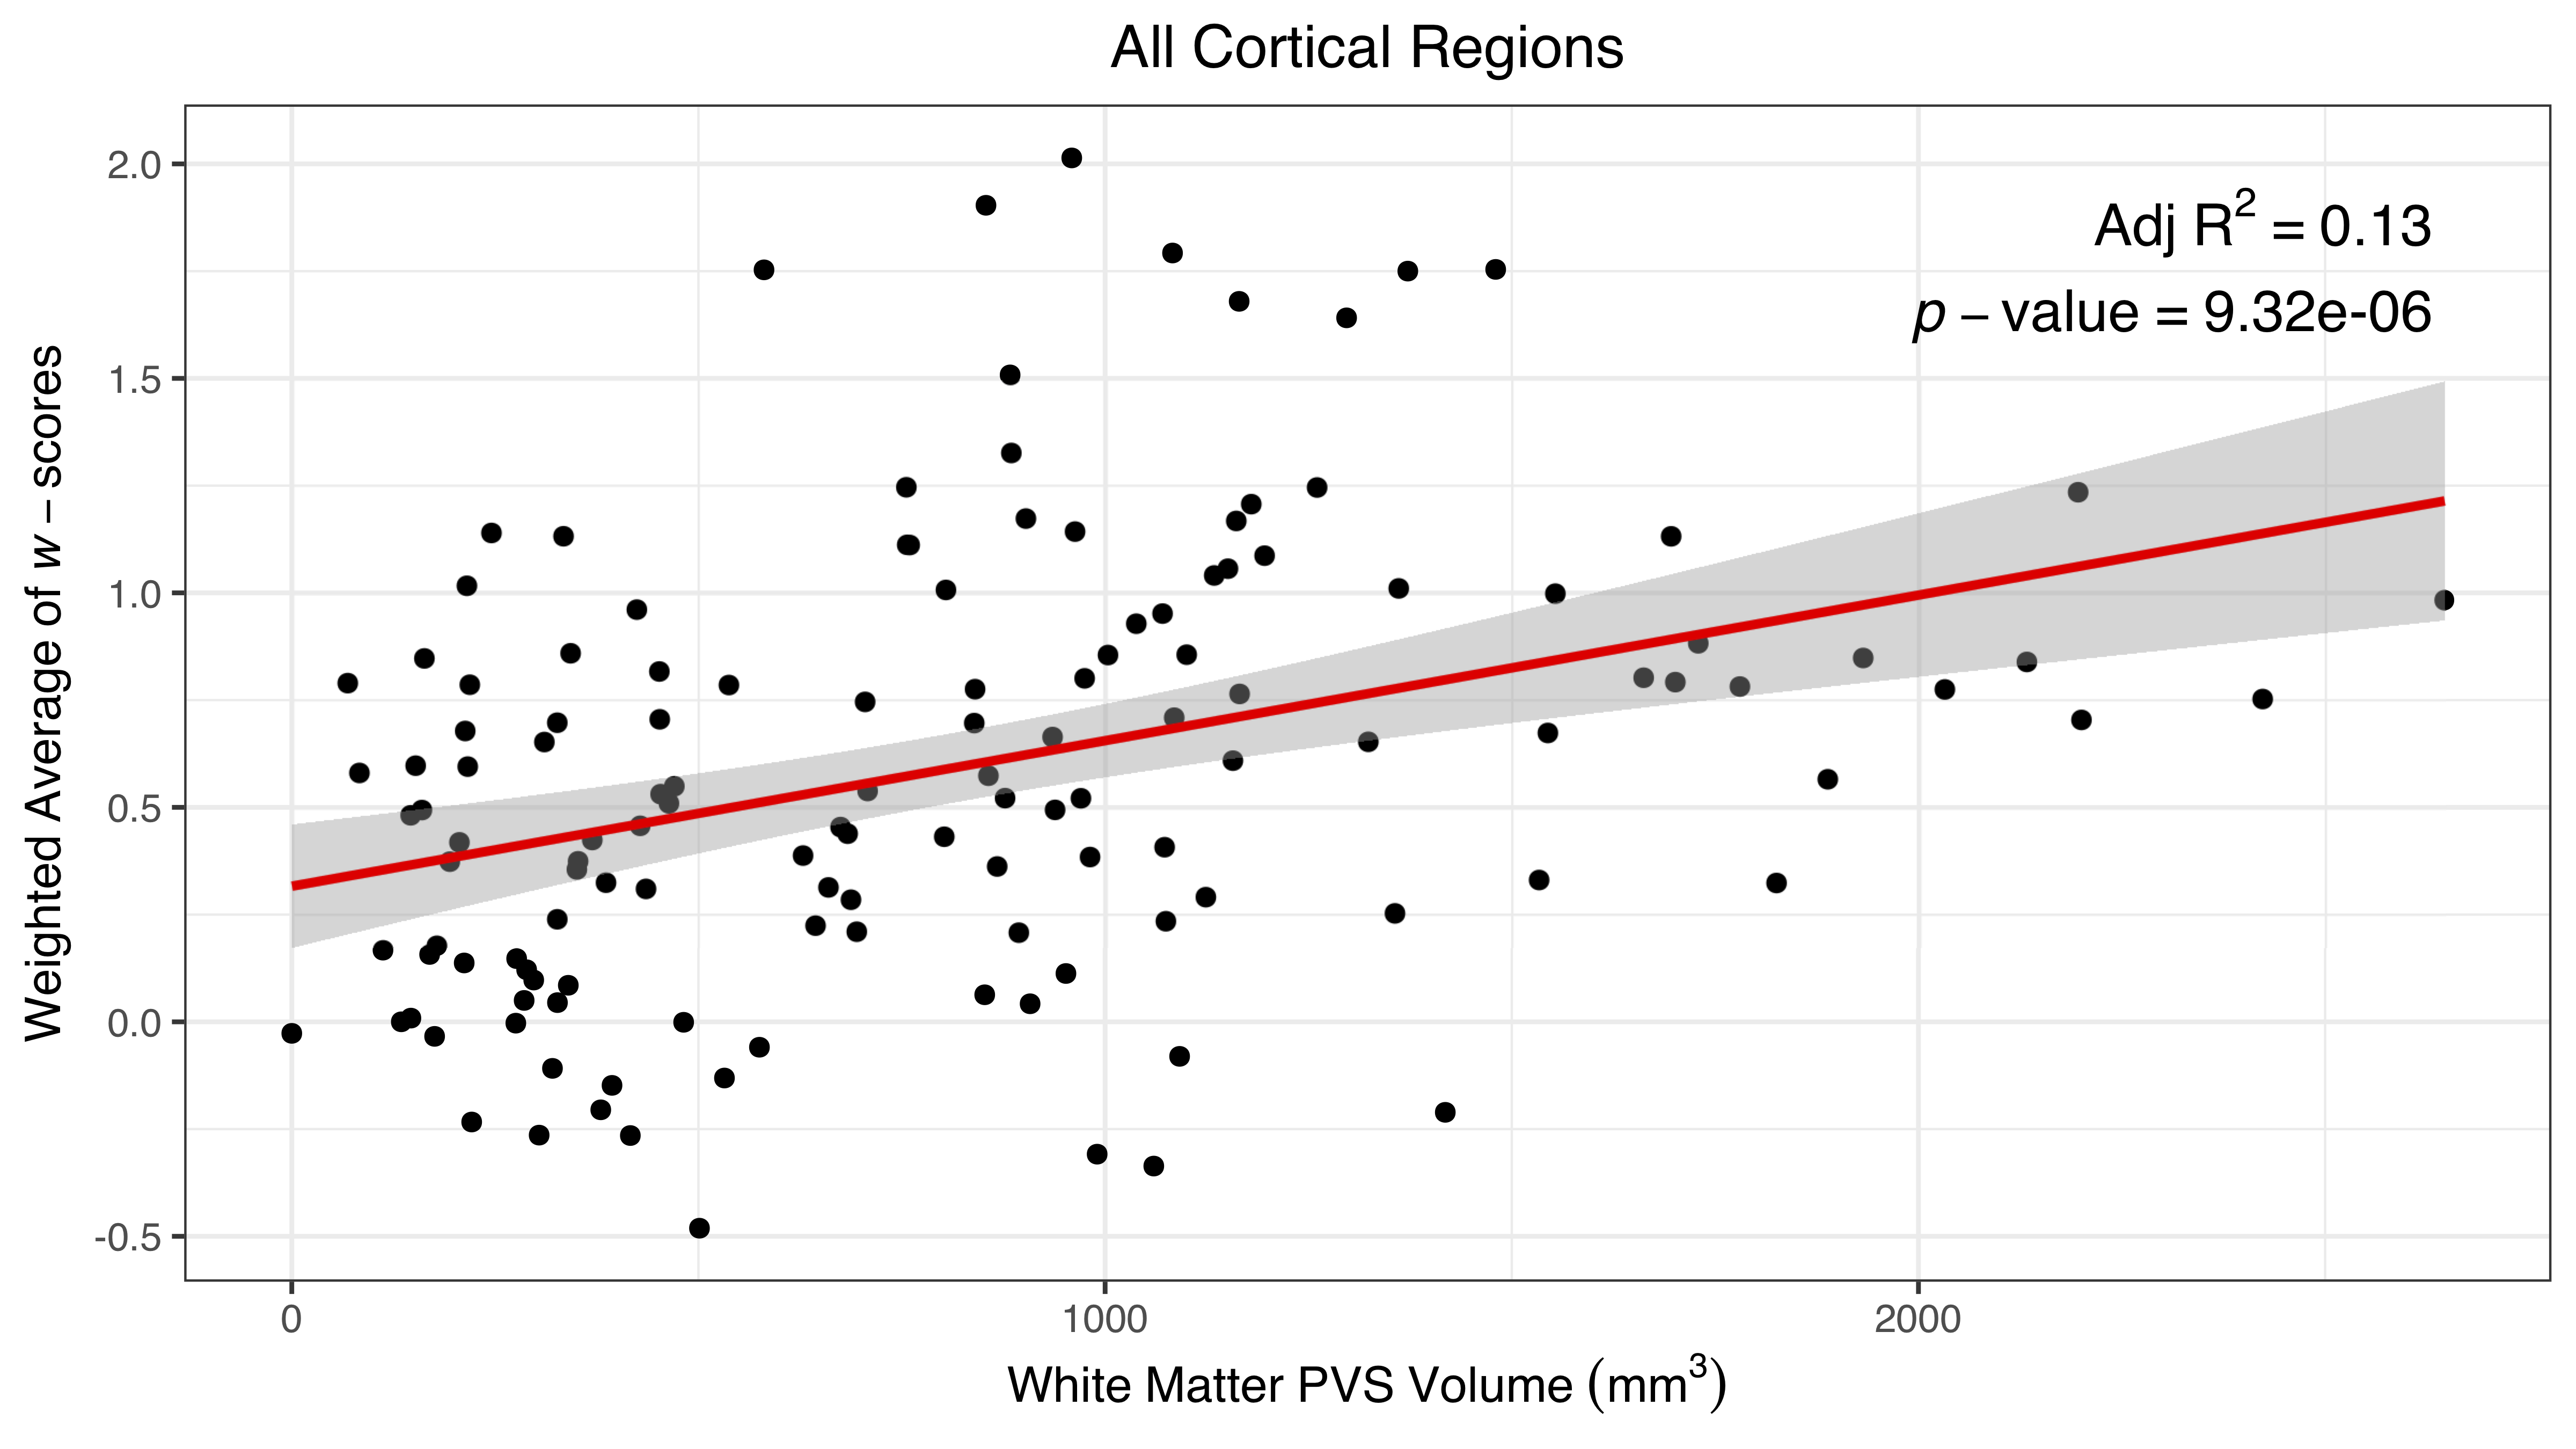
Figure 4: Correlation Between WM PVS Volume and Overall Cortical Thickness
Linear regression was performed between WM PVS volume and a weighted average of cortical thickness w-scores for all cortical regions. The result shows a correlation between higher PVS volume and thinner overall cortical thickness. Note w-score is a standard score; higher w-scores indicate thinner cortical thickness compared to the control group.
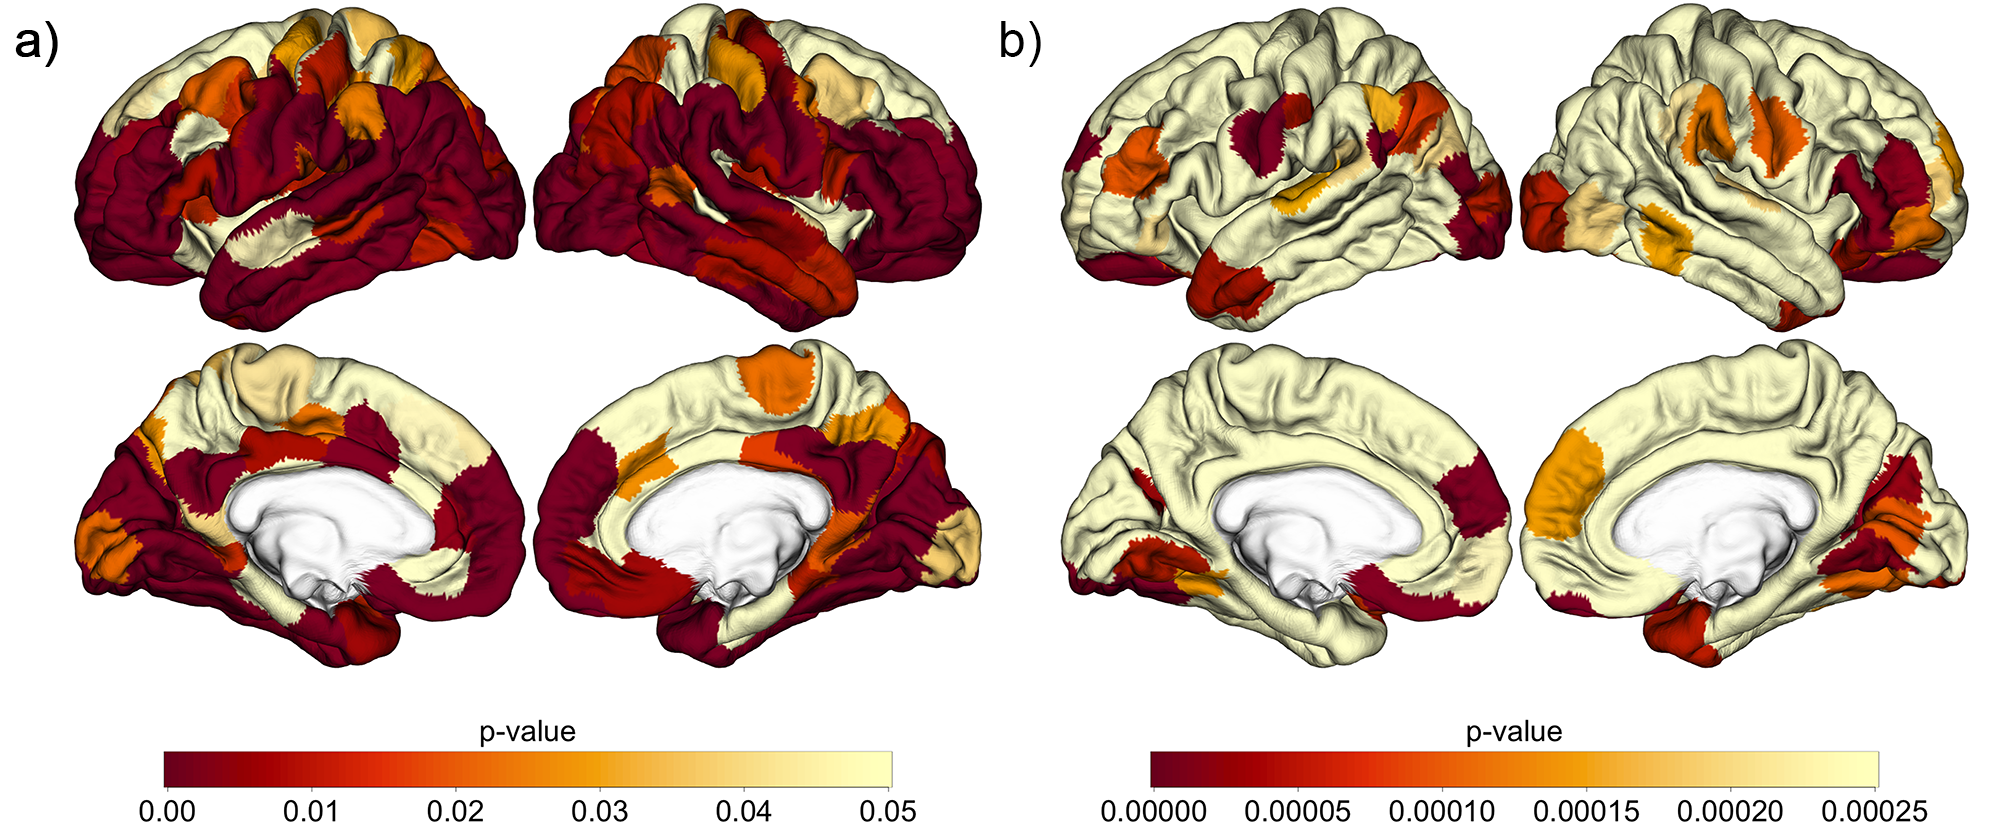
Figure 5: Correlation Between WM PVS Volume and Regional Cortical Thickness
Regression analyses were performed for 200 subregions. a) uses uncorrected significance threshold (p = 0.05). Significant correlations were observed across all but a few parcellations located dorsally. b) uses significance threshold (p = 2.5x10⁻⁴) adjusted by Bonferroni correction. Significant correlations remain primarily in prefrontal, orbitofrontal, and visual cortices.