4852
Is T2 a biomarker of inflammation in normal appearing gray matter: Maybe!1Department of Radiology, University of Calgary, Calgary, AB, Canada
Synopsis
With the reduction in use of gadolinium enhanced MRI for assessment of neuroinflammation, it is important to identify new non-invasive biomarkers of brain inflammation, as well as to understand the link between inflammation induced pathology and MRI. We used quantitative T2, behaviour and histology to study gray matter in an LPS mouse model of inflammation. There was a significant reduction in T2, along with behaviour and histological markers indicating inflammation. Although T2 appears useful as biomarker for inflammation, it may be that the precision needed will make it difficult to implement in patients.
Introduction
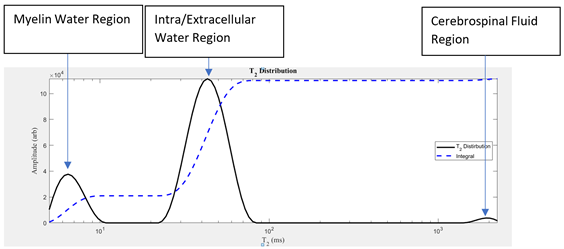
Inflammation is a pathological component of many neurological conditions such as multiple sclerosis (MS)1. Immune cell activation in the central nervous system (CNS) is beneficial as it aids in tissue repair and clearing of cellular debris – however, prolonged neuroinflammation can be highly detrimental and can inhibit the regeneration of damaged brain cells2. Quantitative biomarkers of inflammation are needed, especially since there is a reduction in the use of gadolinium-enhanced MRI for detecting inflammation. This is especially important in MS, for which Gd-enhanced MRI was used to monitor plaque evolution3.T2 is one possible biomarker for inflammation. Studies showed that T2 is sensitive to CNS pathology4. However, measuring changes in T2 relaxation is not enough to reach an adequate level of pathological specificity. Thus the T2 signal decay and the resulting T2 distribution were determined to be appropriate for characterizing CNS microstructure4. In particular, the T2 distribution of a normal brain has three major components: myelin water (0 ms – 25 ms), intra/extracellular water (25 ms – 200 ms), and cerebrospinal fluid (>2000 ms) (Figure 1)4. T2 was sensitive to chronic myocardial inflammation5. It may also be sensitive to structural brain damage caused by inflammation.
We used an inflammatory mouse model induced by lipopolysaccharide (LPS) to assess the potential for quantitative T2 MRI (at 9.4T) to detect pathology or inflammation. The differences in the T2 distribution between LPS and control mice were associated with histological evidence of inflammation.
Methods
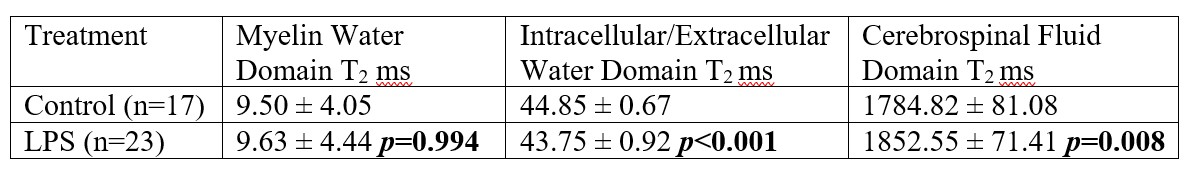
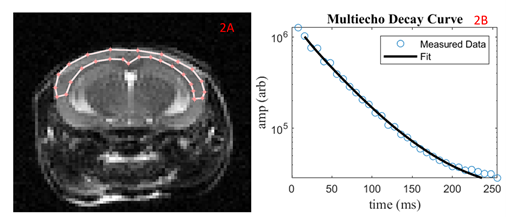
Female C57BL/6 mice received saline (n=17) or 2 mg/kg (n=23) lipopolysaccharide (LPS) intraperitoneally once everyday for a three-day period. In-vivo 9.4T MRI occurred three hours following the third injection. A subset (LPS mice = 11, Control mice = 10) had open-field (OF) behaviour analysis to track locomotion. The T2 was calculated from multi-spin-multi-echo (MSME) acquisition protocol (TR = 5000 ms, TE= 32 ms, echo spacing = 8 ms, number of Averages= 2, slices = 12, matrix size = 128x128, FOV = 2.56 cm x 2.56 cm). The slices were 1 mm. A 0.5 mm gap was included to help reduce between slice RF contaminations. The brain was extracted fresh and CD45 was used to stain for leukocytes in the cortex.A T2 distribution was created for the cortex region using AnalyzeNNLS. The geometric mean was calculated for three domains: 0 ms – 25 ms, 25 ms – 200 ms, and 200 ms – 3000 ms. The geometric mean of each region was reported as a T2 value in ms. A student’s t-test was used to compare the geometric means of the three domains (myelin water, intra/extracellular water, and CSF) in control mice vs. LPS mice.
Results
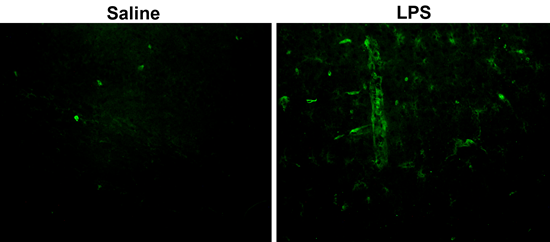
There was no significant difference in the T2 for the myelin water region for both groups. The T2 for the intra/extracellular water region (25 ms – 200 ms) was significantly lower for LPS mice compared to controls. The T2 for the cerebrospinal fluid region (200 ms – 3000 ms) was significantly higher for LPS mice compared to controls. Histological staining shows what appears to be more leukocytes (more immunofluorescence) in the cortex of the LPS as compared to control (Figure 3). Open field data showed greatly reduced movement and exploration consistent with significant functional impairment associated with inflammation.Discussion
Through the mapping of the T2 distribution in three regions, it was demonstrated that the LPS mice had a decrease in the geometric mean T2 for the intra/extracellular water region and an increase for the cerebrospinal fluid region. A portion of the analyzed region appeared to have a greater amount of green immunofluorescence (labelling leukocytes) in LPS mice compared to controls (Figure 3). The constitution of CSF undergoes changes following neuroinflammation. Given it’s proximity to the CNS, it has been successfully used to map inflammation histologically and through T2w MRI6,7. Thus, these changes can be reflected in the altered T2 distribution in the 200 ms – 3000 ms domain. The lack of change in the myelin water T2 could relate to the relatively long echo time and spacing, so we have reduced confidence in these values. Inflammatory processes have been shown to result in a reduction in interstitial fluid pressure, thus resulting in the formation of an oedema in tissues. This can increase intracellular and extracellular water8. This change can be detected by T2 MRI9. In our model, the T2 showed a small reduction with inflammation. This could be due to increased deoxyhemoglobin from hypoxia or iron deposition from a combination of demyelination and inflammation. It was a very small change, indicating that, although it was possible to detect inflammation with T2, it is unlikely that this would be a useful biomarker in patients due to the required precision.Conclusion
The geometric means of T2 in intra/extracellular water were reduced in normal-appearing gray matter and increased in CSF in LPS mice. This indicates that T2 may be sensitive to changes that occur following neuroinflammation. Technically, this supports the hypothesis that T2 could be a biomarker of inflammation. However due to the small change, a very high level of precision would be required to detect this change, making it unlikely that quantitative T2 alone would be a useful biomarker of inflammation.Acknowledgements
This work was funded by Natural Sciences and Engineering Research Council (RGPIN-2015-06517), Canadian Foundation for Innovation, and Brain Canada. QS received undergraduate funding from Alberta MS Network, UCalgary Biomedical Engineering, and Alberta Innovates Health Solutions. RT received undergraduate funding from Alberta Innovates.References
1. Amor, S., Puentes, F., Baker, D., & van der Valk, P. (2010). Inflammation in neurodegenerative diseases. Immunology, 129(2), 154–169. https://doi.org/10.1111/j.1365-2567.2009.03225.x
2. Kwon, H.S., Koh, S.H. (2020). Neuroinflammation in neurodegenerative disorders: the roles of microglia and astrocytes. Translational Neurodegeneration, 9(42). https://doi.org/10.1186/s40035-020-00221-2
3. Rovira, A., Auger, C., Alonso, J. (2013). Magnetic resonance monitoring of lesion evolution in multiple sclerosis. Therapeutic advances in neurological disorders, 6(5), 298–310. https://doi.org/10.1177/1756285613484079
4. Mackay, A., Laule, C.L., Vavasour, I., Bjarnason, T., Kolind, S., Madler, B. (2006). Insights into brain microstructure from the T2 distribution. Magnetic Resonance Imaging, 24(4), 515-525. https://doi.org/10.1016/j.mri.2005.12.037
5. Emrich, T., Hahn, F., Fleischmann, D., Halfmann, M. C., Düber, C., Varga-Szemes, A., Escher, F., Pefani, E., Münzel, T., Schultheiss, H. P., Kreitner, K. F., & Wenzel, P. (2020). T1 and T2 mapping to detect chronic inflammation in cardiac magnetic resonance imaging in heart failure with reduced ejection fraction. ESC heart failure, 7(5), 2544–2552. https://doi.org/10.1002/ehf2.12830
6. Janelidze, S., Mattsson, N., Stomrud, E., Lindberg, O., Palmqvist, S., Zetterberg, H., Blennow, K., Hansson, O. (2018). CSF biomarkers of neuroinflammation and cerebrovascular dysfunction in early Alzheimer disease. Neurology, 91(9). https://doi.org/10.1212/WNL.0000000000006082
7. Lamb, C.R., Croson, P.J., Cappello, R., Cherubini, G.B. (2005). Magnetic resonance imaging findings in 25 dogs with inflammatory cerebrospinal fluid. Veterinary Radiology & Ultrasound, 46(1), 17-22. doi.org/10.1111/j.1740-8261.2005.00003.x
8. Wiig H. (2011). Pathophysiology of tissue fluid accumulation in inflammation. The Journal of physiology, 589(Pt 12), 2945–2953. https://doi.org/10.1113/jphysiol.2011.206136
9. Watanabe, T., Wang, X., Tan, Z., Frahm, J. (2019). Magnetic resonance imaging of brain cell water. Scientific reports, 9, 5084. https://doi.org/10.1038/s41598-019-41587-2
Figures