4849
Quantitative Mapping of Brain Tissue Oxygenation around chronically implanted neural interfaces
Yuka Sugamura1, Arati Sridharan1, Umu Jalloh1, Babak Moghadas1, Livia De Mesquita Teixeira1, Jitendran Muthuswamy1, and Vikram Kodibagkar1
1Arizona State University, Tempe, AZ, United States
1Arizona State University, Tempe, AZ, United States
Synopsis
Chronic implantation of neural interfaces often experiences decrease in signal reliability over time. Tissue response, including the alteration of the oxygen kinetics, is thought to be a major cause. Here, we report the spatial mapping of brain oxygenation around chronically implanted electrodes using a previously developed quantitative MRI-based oxygen sensing technique, PISTOL. Seven 200 um diameter electrodes implanted in four mice allowed quantitative pO2 mapping throughout the 7-week study. No changes were observed in the baseline brain tissue oxygenation as well as the response to respiratory challenge. Future studies will combine this approach with electrophysiology, and ultimately perform simultaneous assessment.
INTRODUCTION:
Implantable neural interfaces have been a valuable
tool to understand neurological activities, however, suffers from the
limitation of long-term signal reliability1. The presence of the
implant evokes undesired chronic tissue responses which can alter the
neurochemical environment, causing impairment in the reliability of the
neurorecordings1,2. Alteration of the oxygenation kinetics around
the implant is suggested to be one of the factors involved in this chronic tissue
response2. Given that neural activity and function are dependent on
the availability of oxygen for energy metabolism3,4, we hypothesized
that measuring the pO2 levels around the implant could provide insights
in the temporal and progressive changes that occur at the implant site and the
local neural activities. Previously, we have created prototypes of implantable
microelectrodes of 400 um diameter which allow direct pO2
measurement by applying 1H MRI based tissue oximetry technique,
proton imaging of siloxanes to map tissue oxygenation levels (PISTOL). PISTOL
utilizes siloxanes as MRI pO2
probes. pO2 can be quantified based on the linear relationship
between the spin lattice relaxation rate (R1) of siloxanes and the
surrounding pO2 levels5,6.
In this study, we have reduced the electrode diameter
to 200 um to minimize injury upon insertion. The electrodes
were implanted in mice brain up to 7 weeks. The tissue oxygenation at the
implant site as well as the response to respiratory challenge were evaluated at
various time points.
MATERIALS AND METHODS: Tetradecamethylhexasiloxane (L6) with molecular weight of 459 g/mol was used as an MRI pO2 probe. L6-loaded microelectrodes were fabricated by coating carbon electrodes with a mixture of Polydimethylsiloxane (PDMS) and carbon nano tubes (CNTs) containing L6. Two types of coated electrodes were fabricated which differ in the crosslinker ratio of PDMS. One was prepared using the crosslinker at 1:10 (referred to as “soft”), while the other used 1:20 (referred to as “ultrasoft”). The final diameters of the coated electrodes were 150 um and 200 um for soft and ultrasoft, respectively. The coated electrodes were implanted in mice brains (C57bl6 wildtype, n = 4). A craniotomy (~3.5 - 4.0 mm) was made on either side of the hemisphere centered approximately 3.0 mm posterior to bregma and 3.5 mm lateral to midline. The array was inserted up to 2.5 mm depth into the brain stereotaxic frame and sealed using gelfoam followed by bone cement. For each mouse, two soft and two ultrasoft electrodes were implanted in left and right hemisphere respectively. MRI scanning was performed using a preclinical 7T scanner (BRUKER), with a surface coil using the PISTOL sequence. The PISTOL sequence consists of a combination of pulse-burst saturation recovery with frequency-selective excitation of the siloxane protons. The acquired images were analyzed using a custom MATLAB code to generate a R1 map. The R1 values were converted to pO2 using calibration curve that was separately determined. All animal studies were carried out under the protocol approved by Arizona State University’s Institute of Animal Care and Use Committee (IACUC). Follow up scans were performed on week 0, 1, 2, 3, and 7 post implantation. The mice underwent a respiratory challenge in the sequence of air (20 min) – oxygen (20 min) – air (20 min) where PISTOL scanning was performed at the end of the 20 min period of each gas. The mean pO2 after having the mouse breath in air at the beginning was considered as the baseline tissue oxygenation (pO2). The response to switching the breathing gas to oxygen was assessed in DpO2 which was computed by subtracting the baseline pO2 from the mean pO2 after breathing in oxygen.
RESULTS and DISCUSSION: Brain tissue oxygenation was quantified with <30% error range in seven of the ultrasoft electrodes throughout the 7-week. The change in local pO2 induced by respiratory challenge was successfully captured. The overall trend showed elevated pO2 under oxygen breathing and returning to the baseline level after switching back to air breathing (Figure 1). For all electrodes, there were no significant difference in the baseline pO2 as well as DpO2 between different timepoints (Figure 2 and 3). For the remaining one ultrasoft electrode and the soft electrodes, the siloxane signals were detected throughout the study, however, the SNR was poor resulting in large errors in the R1 estimation and was excluded for analysis. The calibration curves of the coating materials of ultrasoft and soft at 37 ℃ were determined to be R1 = 0.35922 s-1 + 0.0014 s-1.torr-1 * pO2 and R1 = 0.30923 s-1 + 0.00107 s-1.torr-1 * pO2, respectively. The slight difference in the curves indicates that in the two types of coatings, the L6 molecules and the matrix may be interacting slightly differently.
CONCLUSION: This study demonstrates the feasibility of monitoring changes in the tissue oxygenation profile during long-term implantation. 200 um diameter electrodes provided sufficient signal to perform quantitative assessment throughout the 7-week study. This approach could be promising as it may provide means to assess the changes occurring at the implant site during long-term electrophysiological studies. Further studies to combine pO2 mapping with electrophysiology and ultimately, perform simultaneous assessment are undergoing.
Acknowledgements
This research was supported by NIH 1UF1NS107676 – 01 through the BRAIN initiative.References
1. Wellman SM, Kozai TDY. Understanding the Inflammatory Tissue Reaction to Brain Implants To Improve Neurochemical Sensing Performance. ACS Chemical Neuroscience. 2017;8(12):2578-2582. 2. Kozai TDY, Jaquins-Gerstl AS, Vazquez AL, Michael AC, Cui XT. Brain Tissue Responses to Neural Implants Impact Signal Sensitivity and Intervention Strategies. ACS chemical neuroscience. 2015;6(1):48-67. 3. Bolger FB, Lowry JP. Brain Tissue Oxygen: In Vivo Monitoring with Carbon Paste Electrodes. Sensors (Basel). 2005;5(11):473-487. 4. Kennedy RT, Jones SR, Wightman RM. Simultaneous measurement of oxygen and dopamine: coupling of oxygen consumption and neurotransmission. Neuroscience. 1992;47(3):603-612. 5. Kodibagkar VD, Wang X, Pacheco-Torres J, Gulaka P, Mason RP. Proton imaging of siloxanes to map tissue oxygenation levels (PISTOL): a tool for quantitative tissue oximetry. 2008;21(8):899-907. 6. Kodibagkar VD, Wang X, Mason RP. Physical principles of quantitative nuclear magnetic resonance oximetry. Front Biosci. 2008;13:1371-84Figures
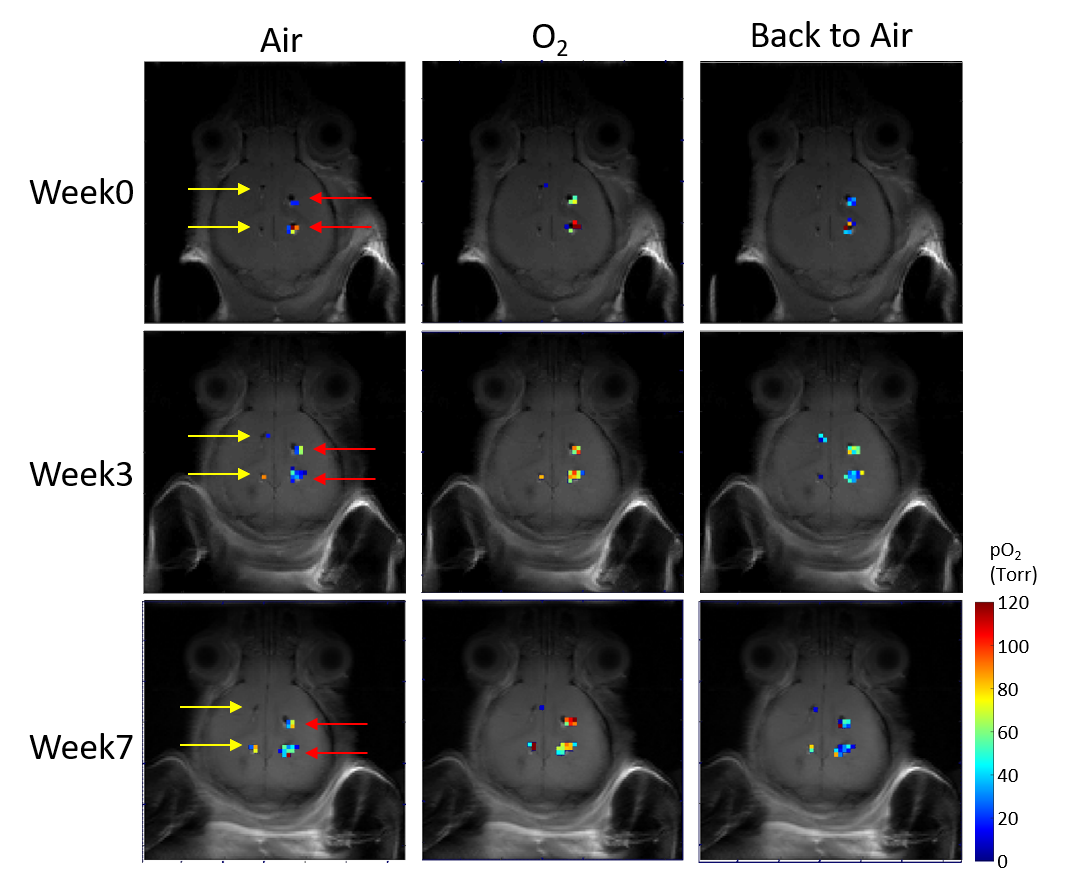
Representative pO2 maps during the
7-week study. At each time point, the mouse was subjected to a respiratory
challenge in the sequence of air
(20 min) – oxygen (20 min) – air (20 min). PISTOL images were acquired at the
end of the 20 min period of each gas. Yellow and red arrows indicate soft and
ultrasoft electrodes, respectively. Pixels where the error in the R1
estimation is larger than 30% or those that had unrealistic R1
values were excluded from the pO2 map.
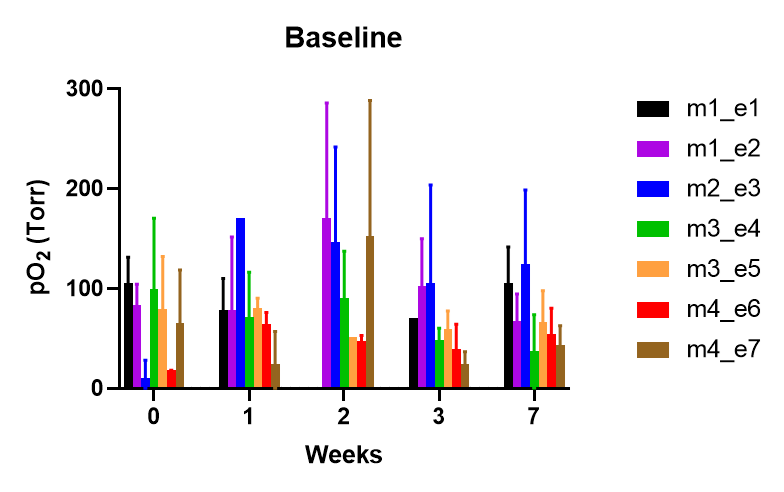
Baseline brain tissue oxygenation (pO2)
around the implanted ultrasoft electrodes. Baseline pO2 values were
obtained from the PISTOL images taken after having the mice breath in air for
20 min at the beginning of each follow up. Mean baseline pO2 and the
standard deviation are shown here. m1_e1 denotes electrode 1 implanted in mouse
1.

Mean change in tissue
oxygenation after switching the breathing gas from air to oxygen. For each
electrode, DpO2 was computed
by subtracting the baseline pO2 from the mean pO2 after
breathing in oxygen for 20 min. Mean and standard deviation of the DpO2 of the seven
electrodes are shown here.
DOI: https://doi.org/10.58530/2022/4849