4847
3D Pseudo-Continuous Arterial Spin Labeling Acquisition using a High-Performance Gradient System: A Scan Time and Image Quality Assessment1Magnetic Resonance Imaging, GE Global Research, Niskayuna, NY, United States, 2Mayo Clinic, Rochester, MN, United States
Synopsis
The maximum gradient amplitude (Gmax) and slew rate (SRmax) determine the minimum number of interleaves (and total scan time) in a 3D pseudo-continuous arterial spin-labeling (3DpCASL) acquisition with a stack-of-spirals readout module for a given spatial resolution. The higher Gmax and SRmax of a recently developed head-only gradient system (MAGNUS) was utilized to reduce the total scan time of a clinical 3DpCASL acquisition by a factor of 2 compared to a similar acquisition carried out at a lower Gmax and SRmax of a conventional whole-body system (CWBS) while maintaining comparable image quality.
Introduction
Fast spin-echo 3D stack-of-spirals is often used for the readout of a 3D pseudo-continuous arterial spin-labeling (3DpCASL) pulse sequence. The total scan duration of 3DpCASL acquisition is largely dependent on the number of interleaves (NI) used for the acquisition. The achievable maximum gradient amplitude (Gmax) and slew rate (SRmax) of the gradient can limit the minimum NI used for the 3DpCASL acquisition and therefore the overall scan time for a given spatial resolution. This is because of the need to reduce the spiral duration per shot ($$$\rm{\tau}$$$) that is necessary to minimize the accrual of erroneous phases due to susceptibility, static B0 inhomogeneity and eddy currents. A recently developed head gradient coil (MAGNUS - GE Global Research, Niskayuna, NY, USA) simultaneously achieves 200 mT/m and 500 T/m/s on each axis using a standard 1 MVA gradient driver in a clinical whole‐body 3.0 T system[1]. The MAGNUS has a higher peripheral nerve stimulation (PNS) threshold compared to conventional clinical whole-body 3.0 T system (CWBS)[2] with typical Gmax and SRmax of 33-40 mT/m and 120 T/m/s respectively. In this work, we demonstrate that the spiral acquisition can be made more efficient on the MAGNUS to decrease the total scan time of a 3DpCASL acquisition without compromising the image quality compared to a CWBS acquisition. Perfusion signal-to-noise ratio (pSNR) efficiency and noise power per pixel ratio (NPPR) were used to compare the image quality of the CWBS and MAGNUS acquisitions.Methods
All experiments were carried out on the MAGNUS gradient system with patches for zeroth and first order eddy current and concomitant gradient fields correction[3]. The Gmax, SRmax, and receiver bandwidth (rBW) of the readout spiral acquisitions on MAGNUS and CWBS satisfied the azimuthal Nyquist criterion that prevents undersampling for the 3DpCASL spiral k-space[4]. At an rBW of 500 kHz, and spatial resolution of 3.5 x 3.5 x 4 mm3, the spiral readout of the 3DpCASL acquisition on the MAGNUS configuration was limited to Gmax of 49 mT/m (far below the system Gmax of 200 mT/m), and slew rate of 450 T/m/s. This was in contrast to CWBS configuration which was limited to Gmax of 24 mT/m and utilized a slew rate of 110 T/m/s at an rBW of 250 kHz. The lower slew rate was chosen to mimic the lower PNS threshold for simultaneous x and y gradient waveforms on a CWBS. Acquired raw k-space phantom and volunteer 3DpCASL data were processed for image reconstruction using theoretically calculated spiral trajectories (nominal trajectories). Separately, a dynamic field camera composed of 16 1H probes (Skope, Zurich, Switzerland) was used to measure the true zeroth and first-order transverse k-space trajectories (measured trajectories) for 3DpCASL reconstruction as previously described[4]. Image reconstruction was carried out in MATLAB (Mathworks, Natick, MA, USA) using the Orchestra software development kit (GE Healthcare, Waukesha, Wisconsin, USA). Cerebral blood flow (CBF) was calculated using the perfusion-weighted (PW) and proton-density (PD) images as previously described in the ASL consensus[5]. pSNR efficiency was calculated as[4]: $$\mathrm{pSNR\ Efficiency = \frac{PW}{Noise\times\sqrt{NI\times \tau}}}$$ Wilcoxon signed-rank test for matched pairs was used to assess CBF and pSNR efficiency differences between the CWBS and MAGNUS acquisitions.Phantom and Volunteer Experiments: Phantom images were acquired using the American College of Radiology (ACR) MRI quality control phantom. To verify the trajectory correction, 3DpCASL images of the ACR phantom were acquired using the CWBS and MAGNUS sequence parameters (Table 1). Five healthy volunteers (mean age: 37 years, 2 females) were imaged under an IRB approved protocol after a written informed consent was received. A two-minute wait time was observed between the CWBS and MAGNUS 3DpCASL scans for data consistency. Regional CBF and pSNR efficiency were quantified using semi-automatically drawn regions of interests (ROIs) in the lateral, anterior, and posterior cerebral regions of the brain.
Results and Discussions
The total scan time of the MAGNUS acquisitions were 48.3% lower than those of the CWBS (Table 1). Implementing k-space undersampling strategies can further reduce the 3DpCASL scan time, thereby facilitating dynamic 3DpCASL studies. The calculated NPPR was 0.96, indicating similar noise power per pixel on the CWBS and MAGNUS acquisitions. Reconstructed PD images using the nominal and measured spiral trajectories for the CWBS and MAGNUS acquisitions show comparable image quality (Figure 1). The measured trajectories only corrected for image rotations that become evident at higher SRmax[4]. Such image rotations can also be corrected by co-registration of the 3DpCASL acquisition with an anatomical image acquired in the same volume. Representative volunteer PD, PW and CBF images for the CWBS and MAGNUS acquisitions are shown in Figure 2. The calculated regional CBF values for the CWBS and MAGNUS acquisitions (Figure 3) were in the normal range for a healthy volunteer (40–78 mL/100g/min)[6]. The pSNR efficiency was consistently higher for all brain regions on the MAGNUS acquisition compared to the CWBS acquisition with a mean increase of 28.7% across all ROIs and subjects (Figure 4), which can be largely attributed to the reduced NI on the MAGNUS acquisitions.Conclusions
The higher performance of the MAGNUS gradient system can be utilized to halve the scan time (compared to a CWBS acquisition) of a clinical 3DpCASL acquisition while preserving the image quality of the scan.Acknowledgements
We gratefully acknowledge the expert knowledge of Dr. Marc Lebel in helping us understand the implementation of the 3D Pseudo-Continuous Arterial Spin Labelling pulse sequence.References
[1] T. K. F. Foo et al., “Highly efficient head-only magnetic field insert gradient coil for achieving simultaneous high gradient amplitude and slew rate at 3.0T (MAGNUS) for brain microstructure imaging,” Magnetic Resonance in Medicine, vol. 83, no. 6, pp. 2356–2369, 2020, doi: 10.1002/mrm.28087.
[2] E. T. Tan et al., “Peripheral nerve stimulation limits of a high amplitude and slew rate magnetic field gradient coil for neuroimaging,” Magn Reson Med, vol. 83, no. 1, pp. 352–366, Jan. 2020, doi: 10.1002/mrm.27909.
[3] S. Tao et al., “The Effect of Concomitant Fields in Fast Spin Echo Acquisition on Asymmetric MRI Gradient Systems,” Magn Reson Med, vol. 79, no. 3, pp. 1354–1364, Mar. 2018, doi: 10.1002/mrm.26789.
[4] D. Kang et al., “The effect of spiral trajectory correction on pseudo-continuous arterial spin labeling with high-performance gradients on a compact 3T scanner,” Magnetic Resonance in Medicine, vol. 84, no. 1, pp. 192–205, 2020, doi: 10.1002/mrm.28110.
[5] D. C. Alsop et al., “Recommended implementation of arterial spin-labeled perfusion MRI for clinical applications: A consensus of the ISMRM perfusion study group and the European consortium for ASL in dementia,” Magn Reson Med, vol. 73, no. 1, pp. 102–116, Jan. 2015, doi: 10.1002/mrm.25197.
[6] G. W. J. Harston et al., “Quantification of Serial Cerebral Blood Flow in Acute Stroke Using Arterial Spin Labeling,” Stroke, vol. 48, no. 1, pp. 123–130, Jan. 2017, doi: 10.1161/STROKEAHA.116.014707.
Figures
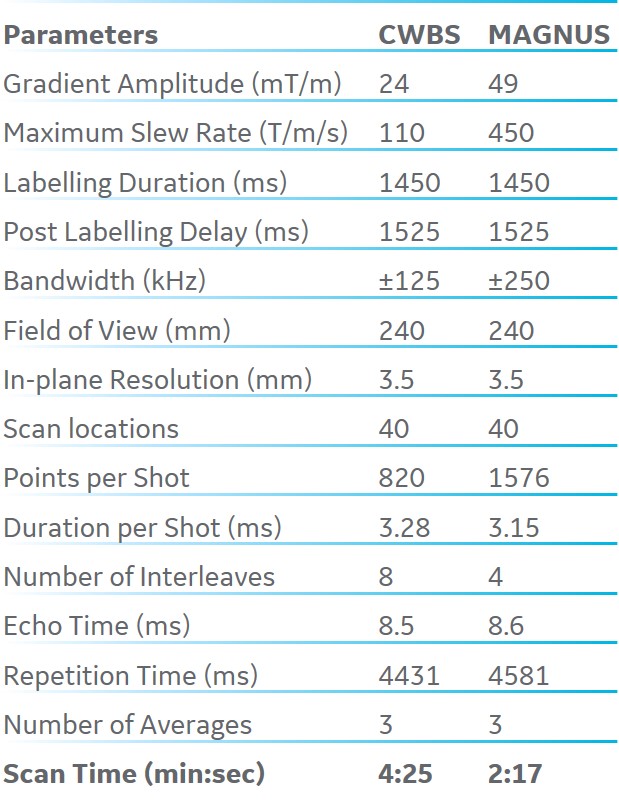
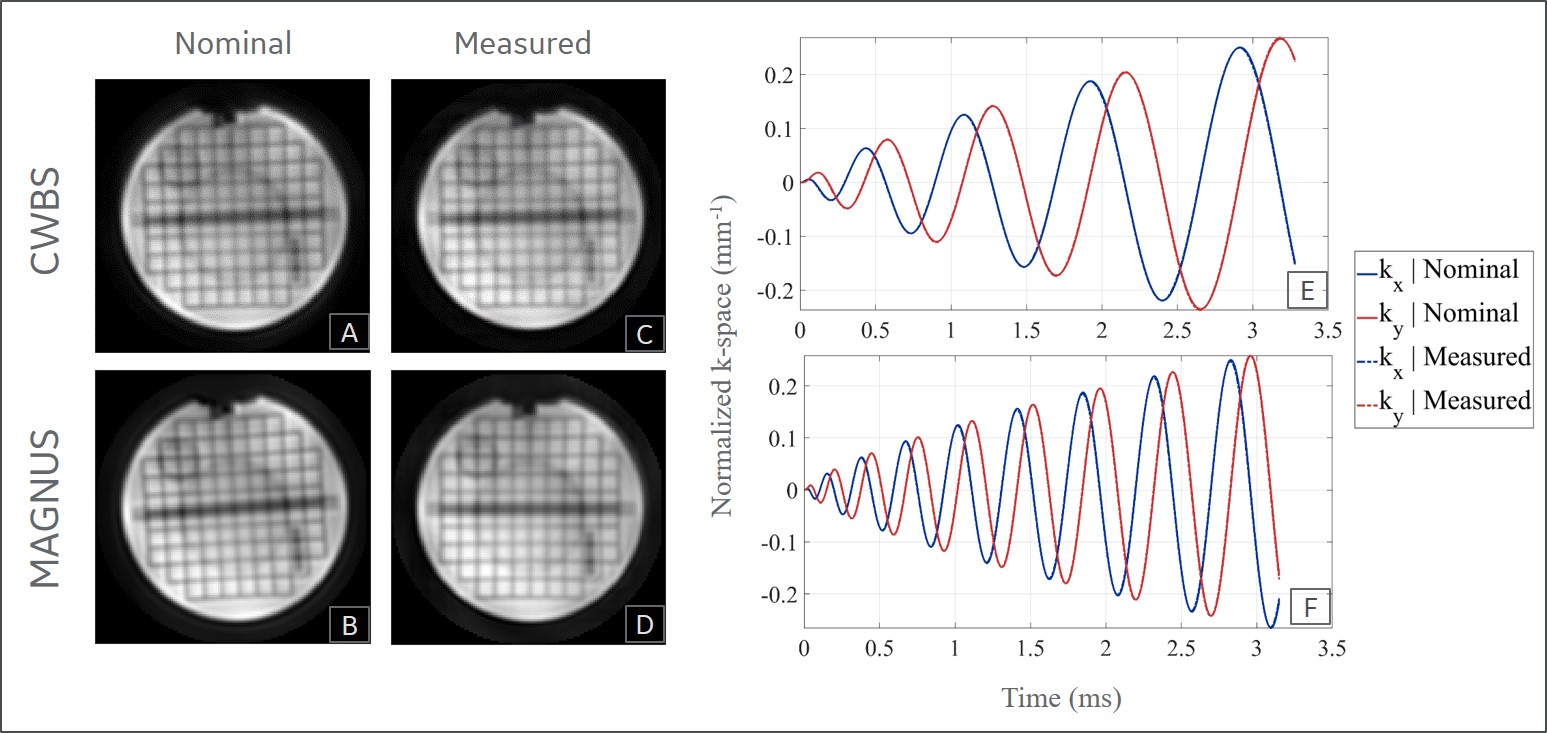
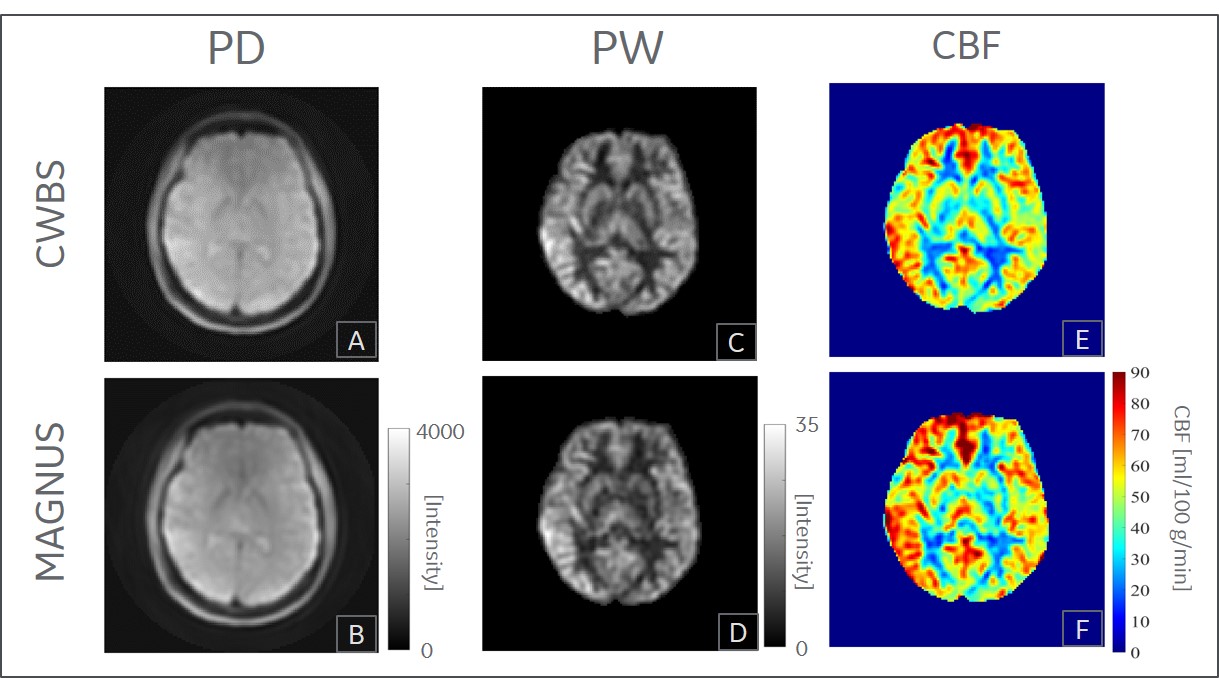
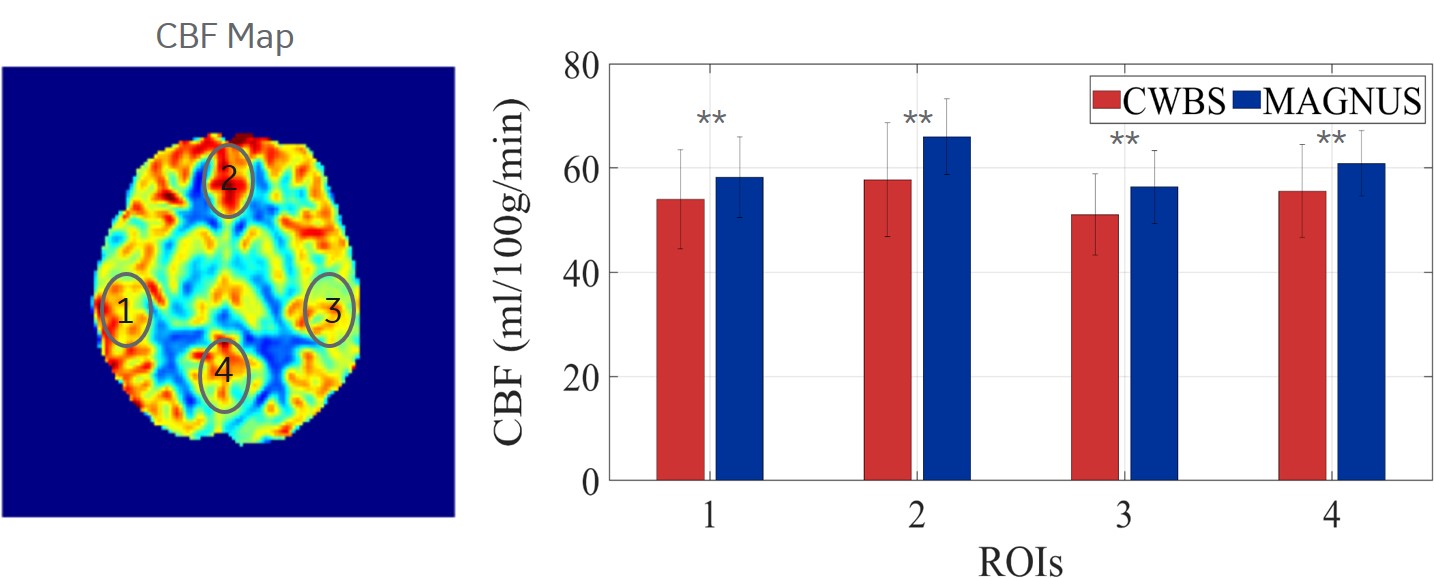
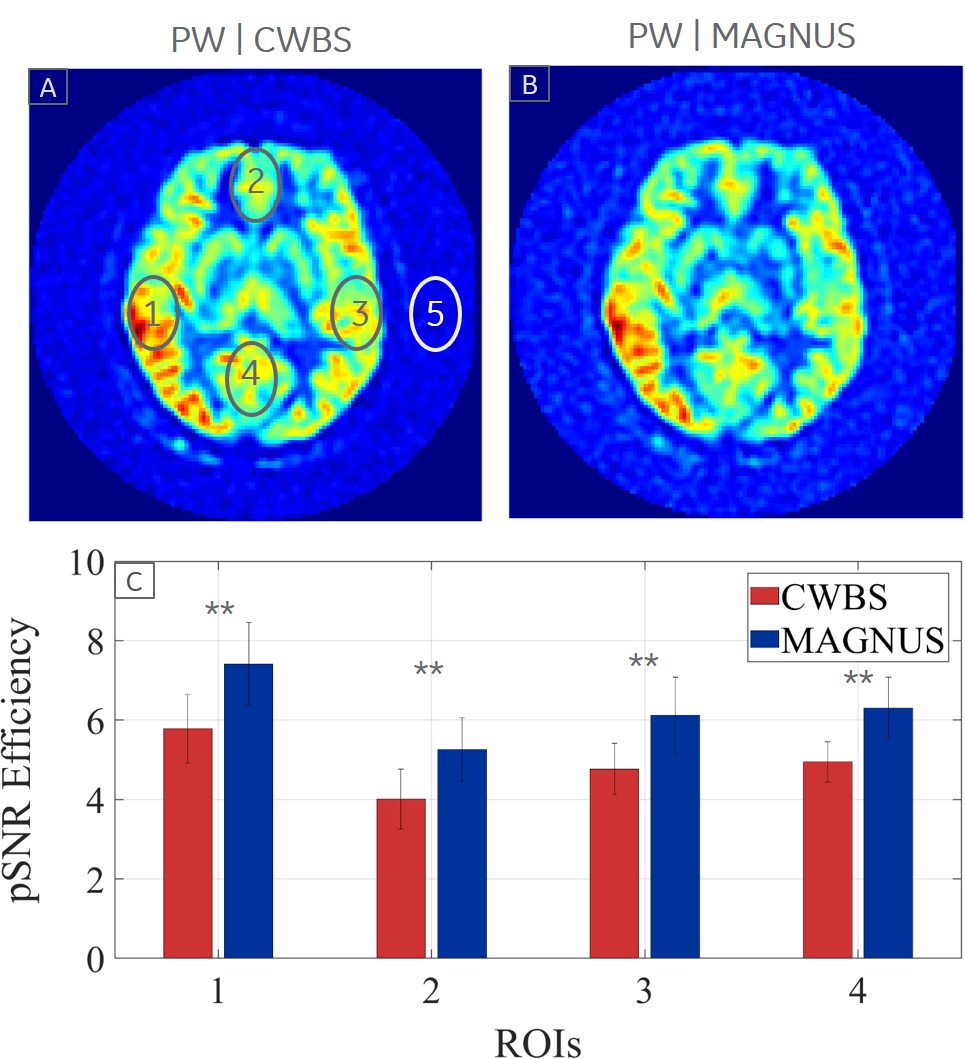
Figure 4: The pSNR efficiency of the MAGNUS acquisition (blue) is consistently higher than the CWBS acquisition (red) in the lateral (1 and 3), anterior (2) and posterior (4) cerebral regions indicated on a representative CWBS (A) and MAGNUS (B) perfusion-weighted (PW) image. Noise was sampled outside the brain (5). The mean pSNR efficiency across all ROIs and subjects is 28.7% higher on the MAGNUS acquisitions compared to the CWBS acquisitions (C). Error bars denote the standard deviation of the pSNR efficiency across volunteers and ** indicates p < 0.01 (Wilcoxon signed-rank test).