4844
Unsupervised learning with multi-parametric diffusion MRI to detect brain injury in concussed athletes1Neurosurgery, Medical College of Wisconsin, Milwaukee, WI, United States
Synopsis
Despite high prevalence of concussion in contact sports, there is still a lack of reliable, unbiased biomarkers of brain injury and recovery following sport-related concussion. The changes in imaging biomarkers after concussion are generally subtle such that signs of abnormalities are detected only in group analyses with large cohorts. Although diffusion MRI techniques show promise, detecting injury in individual subjects is still a challenge. The goal of this project is to identify potential signatures of brain injury in an individual subject with concussion using an unsupervised learning method using parameters derived from diffusion kurtosis imaging (DKI).
INTRODUCTION
Despite high prevalence of concussion in contact sports1–3, there is still a lack of reliable, unbiased biomarkers of brain injury and recovery following sport-related concussion. Although the symptoms are disruptive, generally no abnormalities are seen in individual athletes with conventional neuroimaging protocols. The changes in imaging biomarkers after concussion are generally subtle such that signs of abnormalities are detected only in group analyses with large cohorts. Advanced diffusion MRI techniques show promise since white matter is particularly vulnerable to injury from head impact due to the strain on axonal tracts.The goal of this project is to identify potential signatures of brain injury in an individual subject with concussion using an unsupervised learning method applied to parameters derived from diffusion kurtosis imaging (DKI).
METHODS
96 concussed American football players and 82 matched controls from local high schools and colleges participated in this study. The study was approved by the IRB and written consents were obtained from subjects or parents of minors. The participants underwent symptom severity assessment with SCAT34 (Sports Concussion Assessment Tool), BESS5 (Balance assessment) and SAC6 (Standardized Assessment of Concussion). DKI data were acquired during acute (<48hours) and subacute period (8days) using GE 3T MR750 scanner with a single-shot SE-EPI sequence with 3mm isotropic voxels. Four b=0 images and 60 diffusion-weighted images with b=1000s/mm2 and 2000s/mm2 were acquired. FA, MD, Dax, Drad (fractional anisotropy, mean, axial and radial diffusivity), MK, Kax, Krad (mean, axial and radial kurtosis) maps were calculated using DKE software7.Data for unsupervised learning was generated using 21 white matter tracts from the Johns Hopkins University atlas. Average Dax, Kax and Krad were calculated in each tract for each subject, and OPTICS clustering8 was run on this data. OPTICS detects groups of similar objects in a large, multi-dimensional data set without the need to specify groups by means of explicit features. Intuitively, a group of objects with a set of similar measurements will form a dense cluster in this multi-dimensional space, while dissimilar objects will reside at a large distance. OPTICS does not require a priori knowledge of the number of clusters or density.
Using the Reachability Distance (RDist) from OPTICS, we defined Total Injury Burden (TIB) for a subject as the sum of RDist of fiber tracts with abnormal OPTICS signatures. A tract will land in a specific location in the 3D space based on its specific DKI measurement combination. OPTICS calculates a RDist for each point with respect to the Core Points of a cluster8. Conceptually, members of a cluster have similar RDist, indicating a uniform density of objects. An object with a larger RDist is labeled as an outlier if it is outside the range of cluster’s typical density (Fig.3). This TIB score was used to study associations between behavioral metrics and abnormal DKI signatures.
Conventional MANOVA tests were also run to investigate the combined effect of DKI metrics to distinguish concussed and control groups.
RESULTS
From the MANOVA analysis, DKI metrics in Posterior Limb of Internal Capsule (PLIC) were significantly different (Wilks’ lambda=0.002), mainly driven by both Kax and Krad differences (p=0.024 and p=0.022, respectively) and Daxhad a notable effect (p=0.074). DKI from the Body of Corpus Callosum (Wilks’ lambda=0.008) and Cingulum-Hippocampus (Wilks’ lambda=0.04) were also significantly different between the groups.Fig.1 shows the OPTICS clusters. Each cluster is denoted by a different color and black dots are outliers. Note that each fiber tract formed a distinct cluster with its unique combination of kurtosis metrics. These distinct DKI signatures for different tracts are expected since axon caliber varies by almost 100-fold (~0.1–10μm) among different tracts in the brain9. More importantly, some fiber tracts in the injured subjects moved away from their respective cluster from control subjects. For example, about a third of the tracts from concussed subjects had higher Kax and Krad in the PLIC from day-8 DKI (Fig.2). PLIC contains axons from the primary motor and premotor areas and injury to this tract might affect balance. The RDist plot for the tracts is shown in Fig.3. PLIC from the controls had a relatively uniform RDist in the cluster. On the other hand, some of the concussed subjects were labeled as outliers in their PLIC because of their large RDist.
Table 1 shows the results of correlation analysis between TIB derived from DKI scans from subacute period and BESS or SAC scores. A set of DKI maps are shown in Fig.4.
DISCUSSION and CONCLUSION
These findings suggest that if fiber tracts from an injured subject depart from its typical DKI measurements, he is more likely to show problems in balance and poor cognitive performance. Moreover, the correlations indicate that the farther the fiber tracts deviate from normal or more tracts deviate from normal, the worse the symptoms of the athlete. The TIB measurements from day-1 DKI did not show significant correlations with symptom assessments. This is in accord with our earlier findings where changes in DKI metrics were stronger and more widespread during subacute phase compared to the acute phase10.These results might suggest that diffusion measurements during subacute phase could help stratify subjects who had physiological dysfunction and need more time for recovery.
Acknowledgements
This work was supported by the Defense Health Program under the Department of Defense Broad Agency Announcement for Extramural Medical Research through Award No. W81XWH-14-1-0561. The REDCap electronic database used for this project was supported by the National Center for Advancing Translational Sciences, National Institutes of Health (NIH), Award Number UL1TR001436. Opinions, interpretations, conclusions and recommendations are those of the author and are not necessarily endorsed by the Department of Defense or the NIH. The authors also acknowledge the Research Computing Center at MCW for providing cluster computing infrastructure that made it possible to process and analyze large amounts of imaging data.References
1. Bailes JE, Cantu RC. Head injury in athletes. Neurosurgery. 2001; 48: 26-45; discussion 45.
2. Nation AD, Nelson NG, Yard EE, Comstock RD, McKenzie LB. Football-related injuries among 6- to 17-year-olds treated in US emergency departments, 1990-2007. Clin Pediatr (Phila). 2011; 50: 200-207.
3. Thurman DJ, Branche CM, Sniezek JE. The epidemiology of sports-related traumatic brain injuries in the United States: recent developments. J Head Trauma Rehabil. 1998; 13: 1-8.
4. Guskiewicz KM, Register-Mihalik J, McCrory P et al. Evidence-based approach to revising the SCAT2: introducing the SCAT3. Br J Sports Med. 2013; 47: 289-293.
5. McCrea M, Guskiewicz KM, Marshall SW et al. Acute effects and recovery time following concussion in collegiate football players: the NCAA Concussion Study. JAMA. 2003; 290: 2556-2563.
6. McCrea M, Randolph C, Kelly JP. Standardized Assessment of Concussion (SAC): manual for administration, scoring and interpretation. Waukesha, WI: CNS. Inc[Google Scholar]. 2000;
7. Jensen JH, Helpern JA. MRI quantification of non-Gaussian water diffusion by kurtosis analysis. NMR Biomed. 2010; 23: 698-710.
8. Ankerst M, Breunig MM, Kriegel H-P, Sander J. OPTICS: Ordering points to identify the clustering structure. ACM Sigmod record. 1999; 28: 49-60.
9. Perge JA, Niven JE, Mugnaini E, Balasubramanian V, Sterling P. Why do axons differ in caliber. J Neurosci. 2012; 32: 626-638.
10. Muftuler LT, Meier TB, Keith M, Budde MD, Huber DL, McCrea MA. Serial Diffusion Kurtosis Magnetic Resonance Imaging Study during Acute, Subacute, and Recovery Periods after Sport-Related Concussion. J Neurotrauma. 2020;
Figures
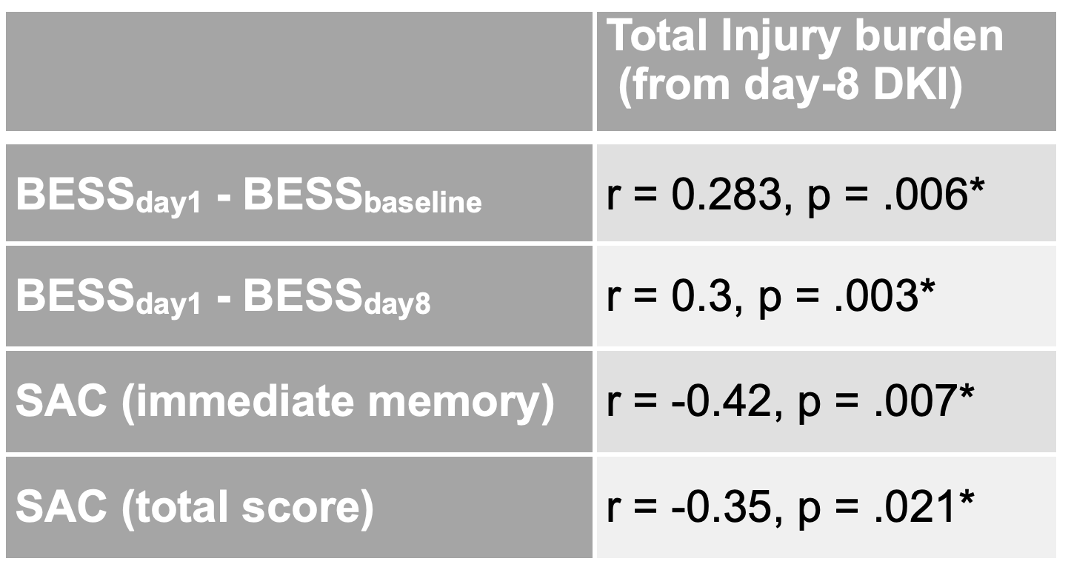
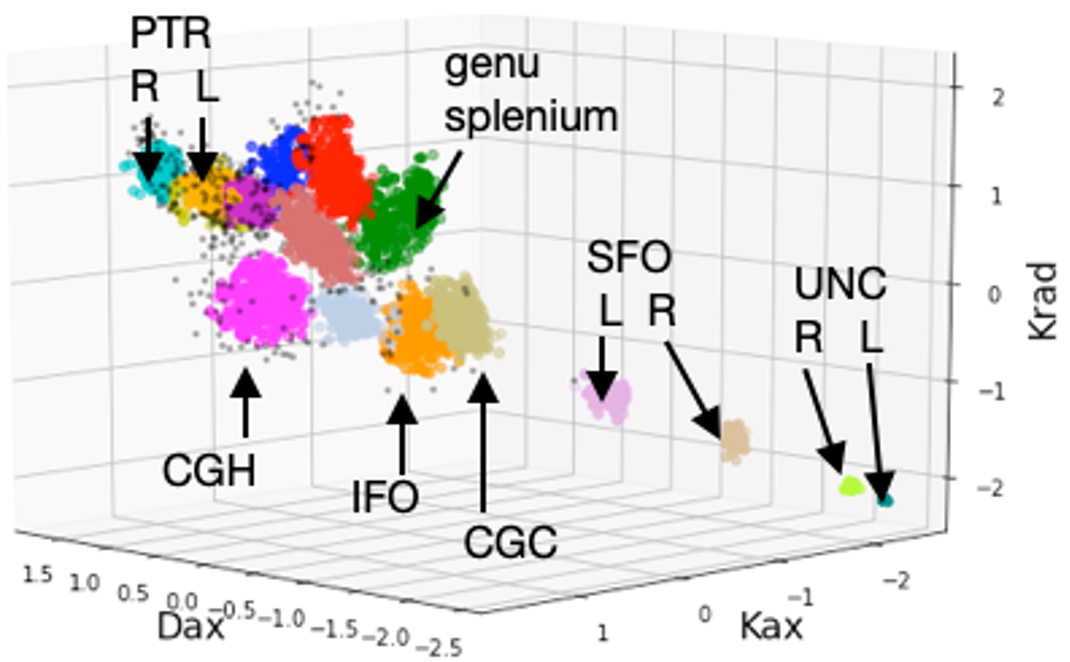
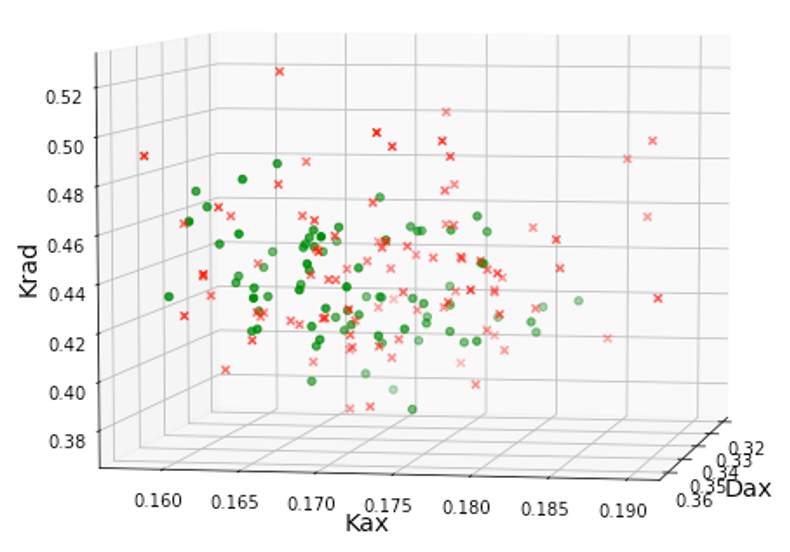
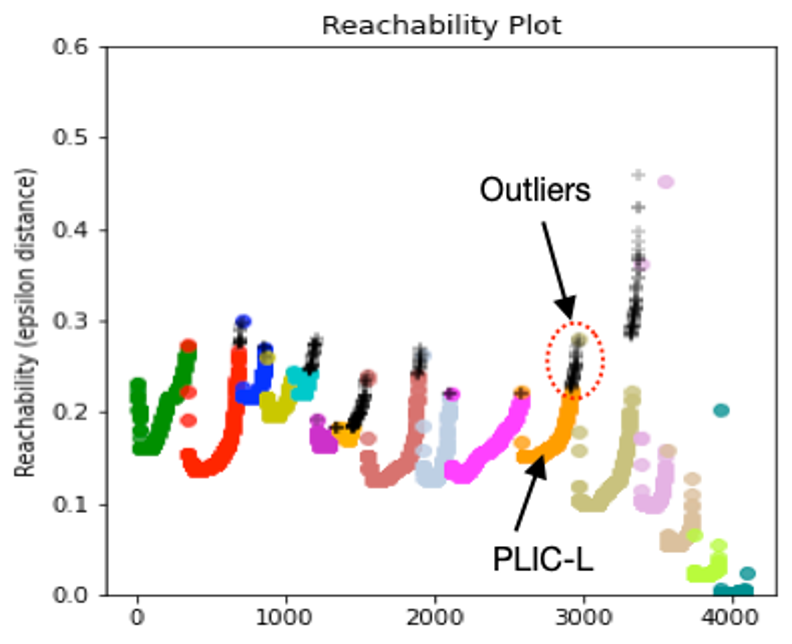
Fig.3. Reachability distance for the selected tracts using the three DKI metrics presented in Fig.1. PLIC-L was shown as an example where orange dots are contained in the cluster and black dots are outliers. Those are the RDist values for the PLIC-L cluster results shown in Fig.2.
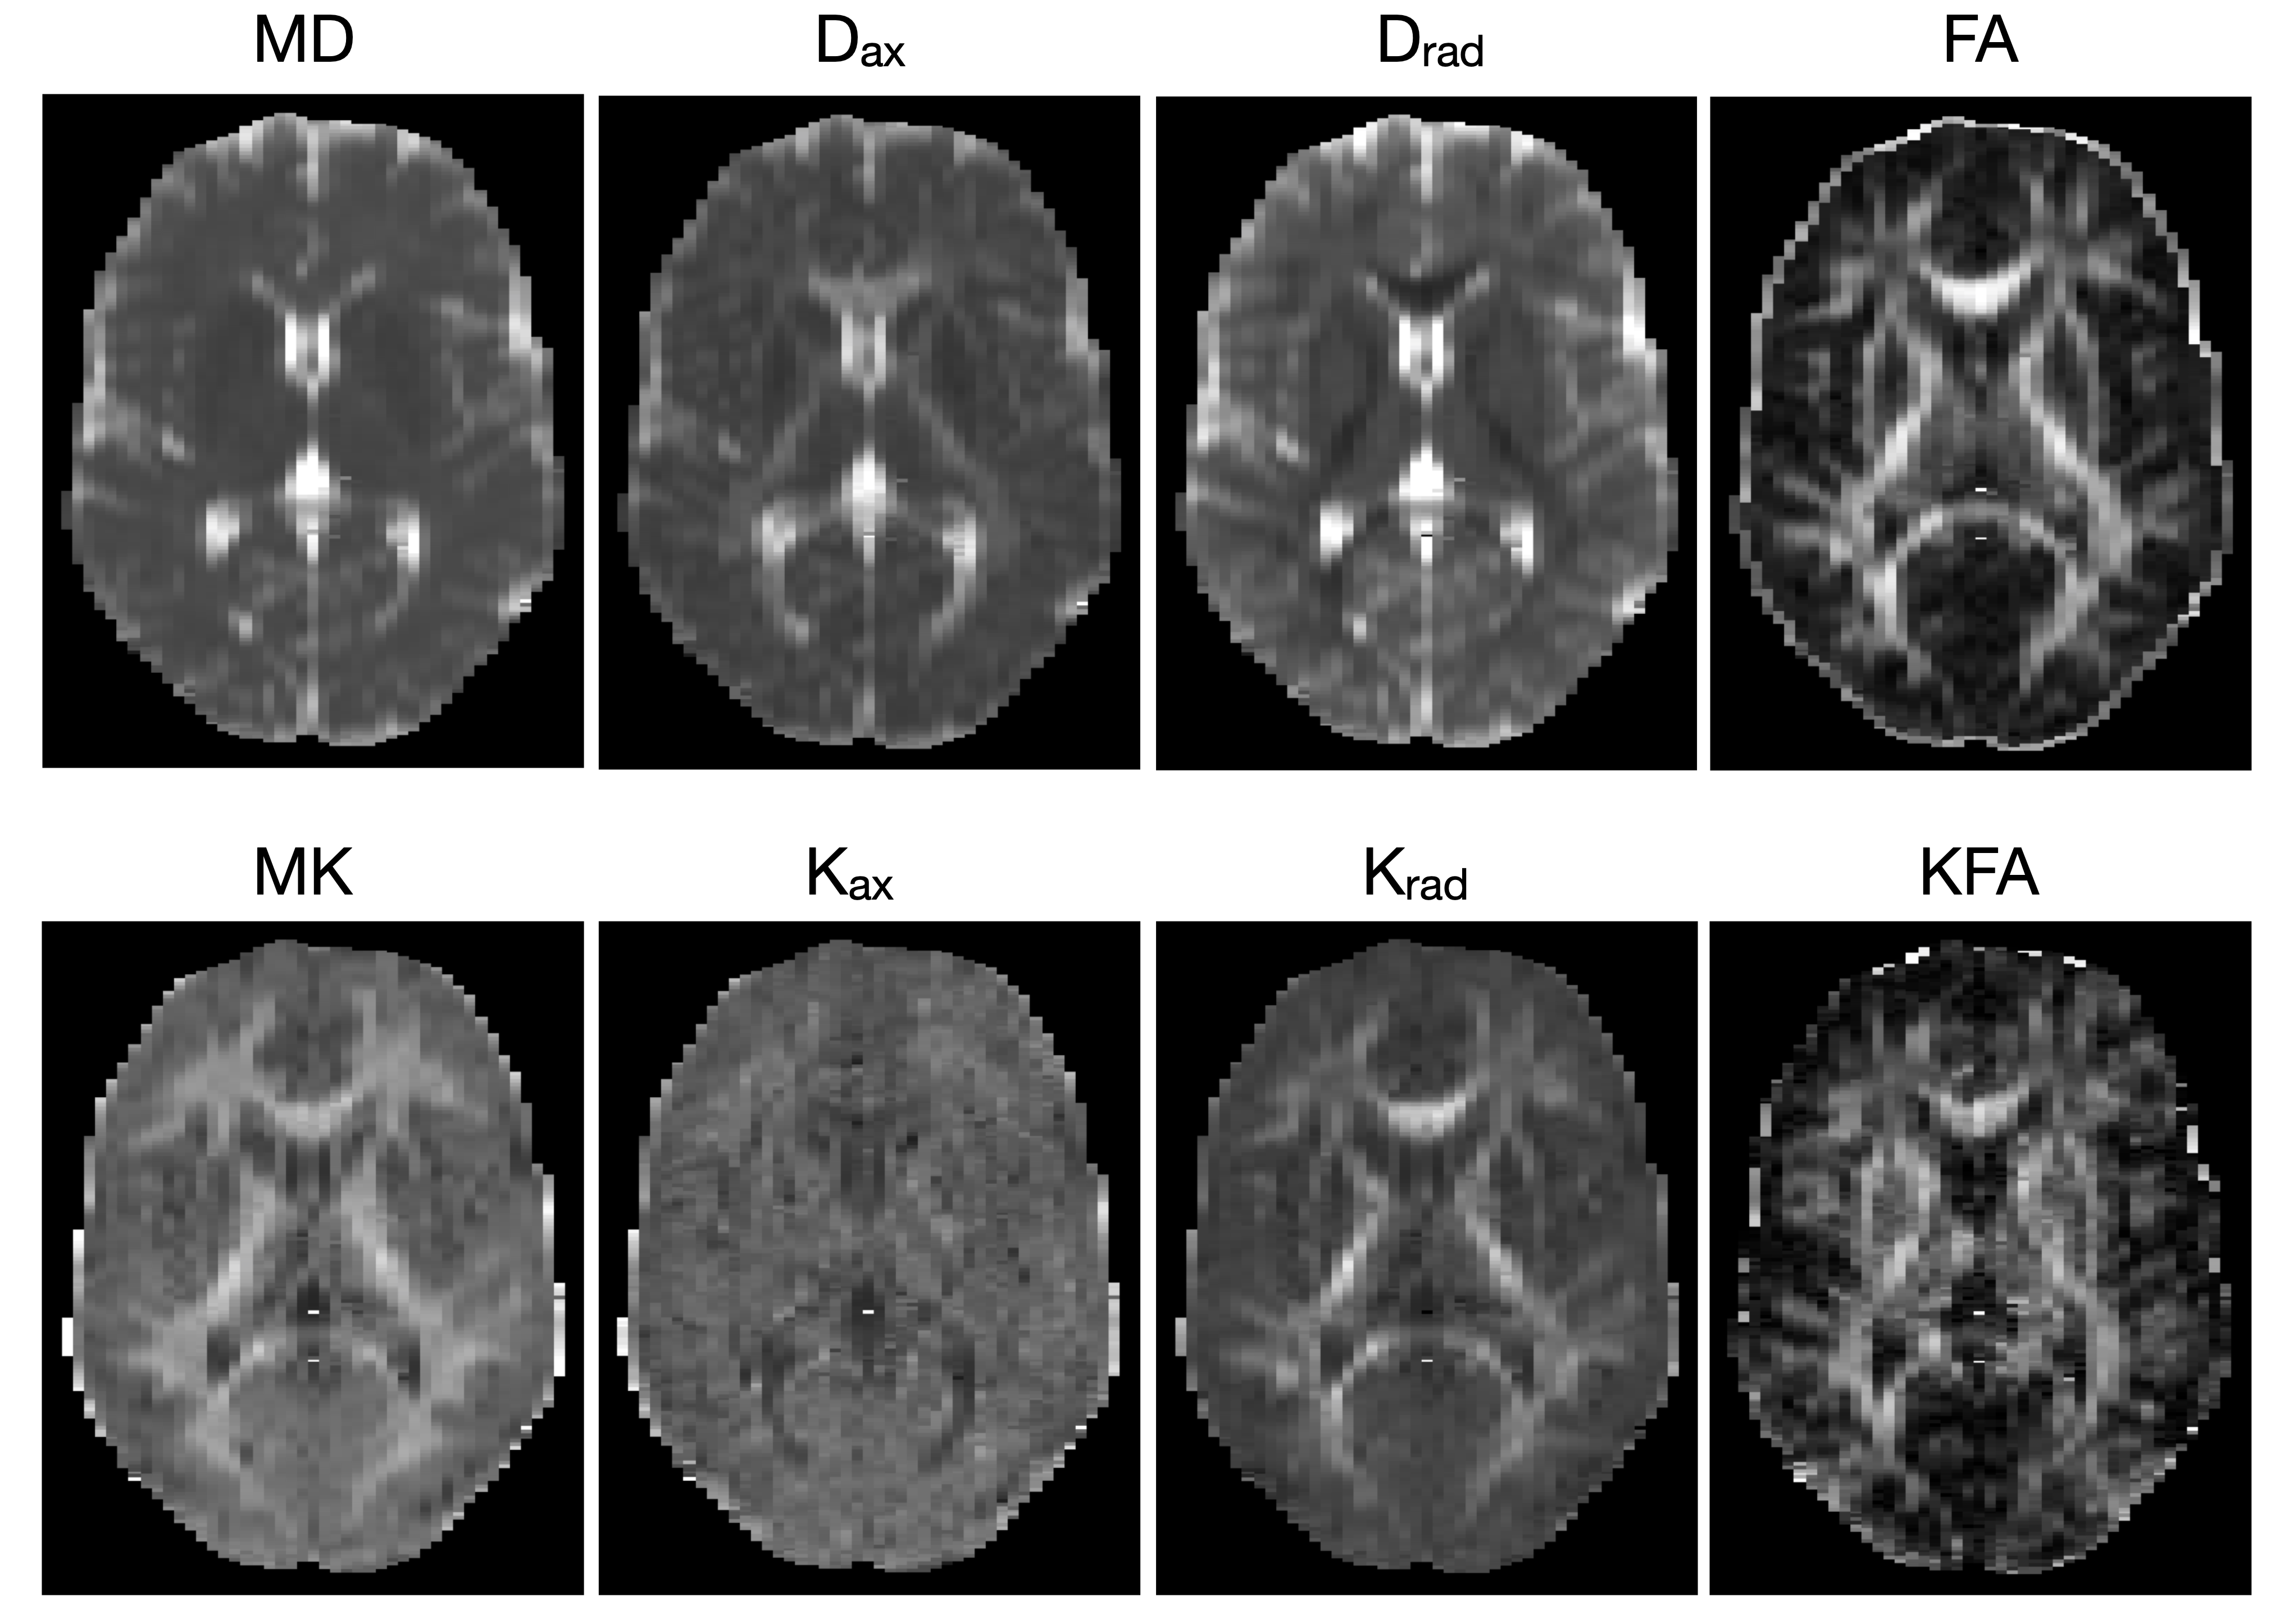
Fig.4. An example set of DKI images from a subject.