4843
Discovery of two novel deep gray matter brain iron networks through an Independent Component Analysis of Quantitative Susceptibility Maps1Buffalo Neuroimaging Analysis Center, Department of Neurology, Jacobs School of Medicine and Biomedical Sciences, University at Buffalo, The State University of New York, Buffalo, NY, United States, 2MR Research Laboratory, IRCCS, Don Gnocchi Foundation ONLUS, Milan, Italy, 3Center for Biomedical Imaging, Clinical and Translational Science Institute, University at Buffalo, The State University of New York, Buffalo, NY, United States
Synopsis
Magnetic resonance imaging (MRI) studies have shown age and neurological disease affect iron concentrations in the deep gray matter (DGM). However, it is unknown whether iron accumulation occurs independently across DGM regions or in inter-regional patterns, i.e. “iron networks”. Here, we identified two highly reproducible, inter-regional DGM iron networks by applying independent component analysis (ICA) to quantitative susceptibility maps (QSM) from healthy volunteers. Areas of network overlap had relatively high iron concentrations and each network was related to separate environmental variables, indicating they have independent mechanisms of iron change. Our results advance the understanding of brain iron physiology.
Introduction
It is unknown whether iron accumulates independently across deep gray matter (DGM) structures or in inter-regional patterns, i.e. “iron networks”. Discovery of such networks would provide novel targets to study neurological diseases with presumed iron dyshomeostasis.It was previously proposed that independent component analysis (ICA) may be used to undercover covarying networks of brain iron without regard to subject characteristics or anatomy1,2. Here, we assessed these networks for reproducibility. We further hypothesized that the DGM networks had independent mechanisms of iron change, so that areas intersecting multiple networks would have high iron deposition. Additionally, we hypothesized iron-modifying environmental factors differentially affect these networks.
Methods
MRI and data reconstruction:This IRB-approved study involved 170 subjects (85 female) without clinically-diagnosed neurological disease (ages 9 to 81; average±std 39.1±16.5 years). Imaging was performed at 3T using a 3D gradient-echo sequence (matrix 512x192x64; 0.5x1x2mm3; 12° flip, TE/TR=22ms/40ms, bandwidth=13.89kHz). Susceptibility maps were obtained by phase unwrapping3, background-field correction4,5, HEIDI6, and whole-brain referencing. Susceptibility maps were normalized to a custom isotropic 1mm susceptibility brain template using ANTs7 and smoothed with a 1mm Gaussian kernel.
Source Separation:
Non-representative subjects were excluded and probabilistic ICA (FSL-MELODIC)8 was applied across the remaining subjects to obtain networks of statistically independent source components (ICs) with associated subject-specific weights (loading coefficients). The number of components was set to 70 for comparability with previous studies9,10, and data were variance-normalized pre-ICA and mixture-modelled post-ICA.
Identification of DGM-associated networks:
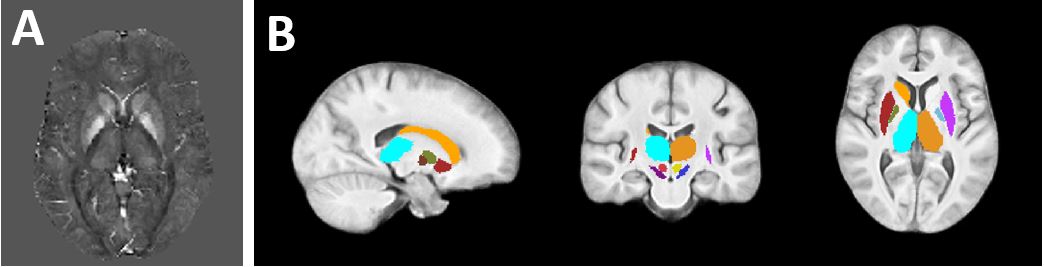
ICs associated with DGM regions (“DGM networks”) were identified by calculating average Z-scores in each of whole thalamus, caudate, and putamen (Harvard-Oxford subcortical atlas11), and subthalamic nucleus, substantia nigra, red nucleus, and globus pallidus (GP) interna and externa (AHEAD atlas12), left and right separate (Fig. 1B, altogether the “subcortical atlas”). DGM ICs were those with average absolute Z-score (“|Zav|”) > 4.05 in one or more regions.
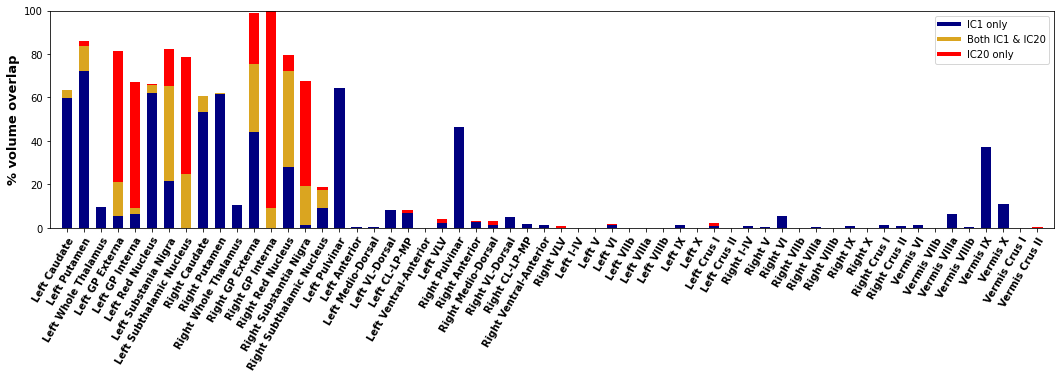
Further anatomical relationships were analyzed by adding a cerebellar atlas13 and thalamic sub-nuclei atlas14. Percent overlaps were calculated between atlas sub-regions and the reliable DGM networks (thresholding at |Zav| > 3.3).
Reliability analysis:
The reliability of each network was assessed by repeating source separation 20 times on subsets of 84 randomly-sampled subjects. The DGM network ICs were then matched to the maximally Pearson-correlated counterpart in each iteration. The average of these correlations (“Corrav”) was defined as network reliability15.
Average susceptibility values:
Voxel-wise average susceptibility values were calculated across subjects in the DGM subcortical atlas. Student’s t-tests compared mean susceptibilities between networks (thresholded at (|Z| > 3.3).
Linear regression:
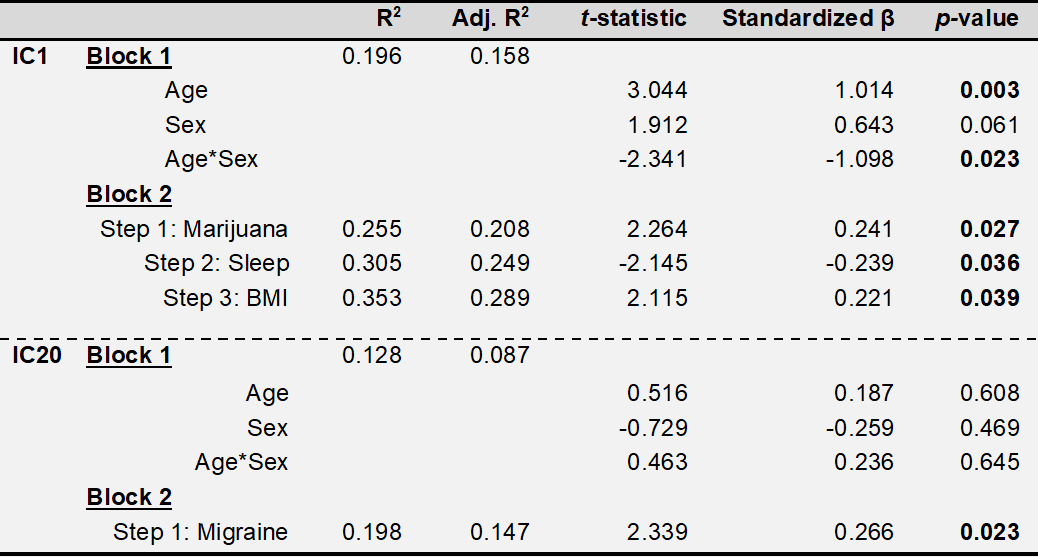
Exploratory linear regression models were conducted on 68 subjects with available clinical data using the IC loading coefficients as dependent variables. The confirmatory regression model used factors previously shown to modify brain iron along with exploratory factors. A first block contained age, sex, and age*sex interaction as forced independent variables, and a second block of smoking status, systolic blood pressure, BMI, previously tried marijuana or hashish (“yes/no”), self-reported daily hours of sleep, self-reported migraines, self-reported alcoholic drinks weekly, and self-reported weekly caffeine consumption. The stepping criteria for the second block used an entry level of 0.05 and removal level of 0.1. F-tests were used to assess R2 changes between models. In the final model, p-values less than 0.05 were considered statistically significant.
Results
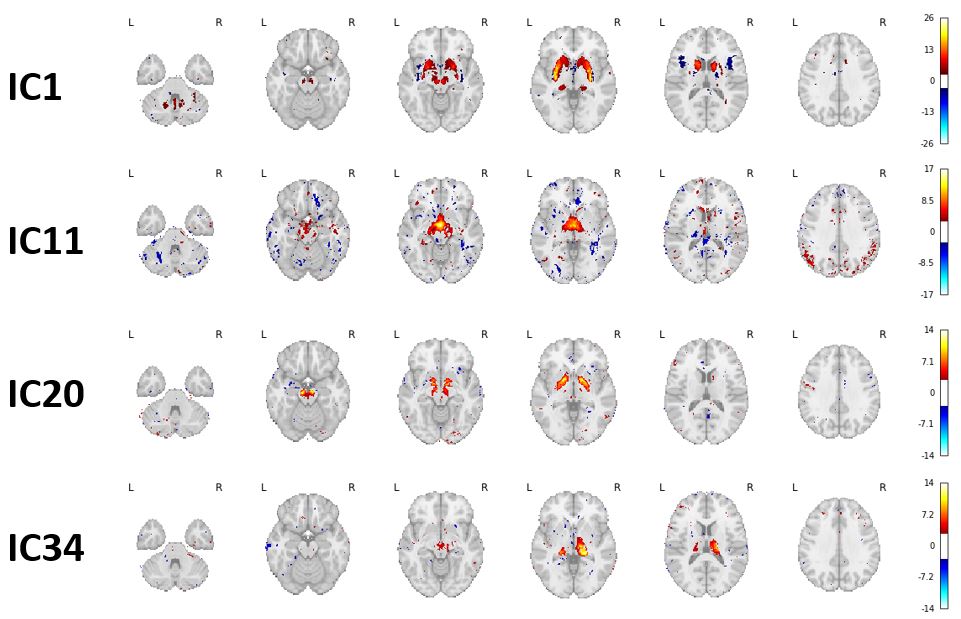
Fig. 1A shows a spatially normalized susceptibility map. The final ICA decomposition used 166 subjects (average±std 38.9±16.4 years; 83 female).Fig. 2 shows the four DGM networks (ICs 1, 11, 20, and 34) with significant overlap of at least one DGM region. ICs 1 and 20 had high reliability (Corrav=0.81 and 0.56, respectively), while ICs 11 and 34 had low reliability (Corrav=0.27 and 0.21, respectively).
Fig. 3 shows anatomical representations of the disjoint and overlapping portions of the two highly reliable DGM networks.
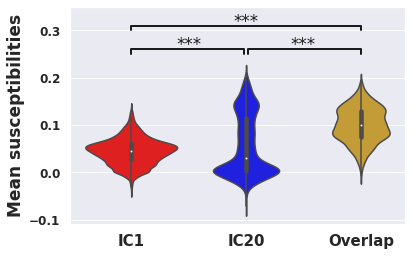
IC1/IC20 intersection areas had higher mean susceptibility than either disjoint network (Fig. 4; IC1/IC20 intersection = 0.100, IC1-only = 0.0447, IC20-only = 0.0557; p<0.0001 for both comparisons).
Regression results are summarized in Tab. 1. IC1 had positive associations with age (p=0.003), BMI (p=0.039), and previous marijuana or hashish use (p=0.027), and negative associations with age*sex interaction (p=0.023) and hours sleep daily (p=0.036). IC20 was positively associated with self-reported migraines (p=0.023).
Discussion
The pulvinar’s specific inclusion in IC1 suggests it has unique iron behavior from other thalamic sub-nuclei and should be analyzed separately in future studies.High susceptibility values in areas of network overlap points to dual mechanisms of iron deposition and may explain why the red nucleus, substantia nigra, and GP externa have relatively high iron levels16,17.
IC1 was positively associated with age, BMI, and marijuana or hashish use, which increase vascular resistance18–20, and negatively associated with daily hours of sleep, which upregulates waste clearance via the glympathic system21. Thus, IC1 potentially arises from a vascular system iron clearance.
IC20 was positively associated with migraines, consistent with previous studies associating DGM iron with migraines22,23.
The self-reported nature of certain clinical variables (e.g. self-reported alcoholic drinks weekly) is a limitation of the exploratory regression analysis. These factors should be explored further in future studies.
Conclusions
Our work advances understanding of brain iron physiology. Future studies using the proposed methodology may reveal how neurological diseases affect these iron networks.Acknowledgements
Research reported in this publication was supported by the National Institute of Neurological Disorders And Stroke of the National Institutes of Health under Award Number R01NS114227 and the National Center for Advancing Translational Sciences of the National Institutes of Health under Award Number UL1TR001412. The content is solely the responsibility of the authors and does not necessarily represent the official views of the National Institutes of Health.References
1. Schweser, F. et al. Age- and sex-related spatial patterns of variation in normal brain magnetic susceptibility (QSM) revealed by Blind Source Separation (BSS) and Supervised Machine Learning. in Proc. Intl. Soc. Mag. Reson. Med. 26 (2018).
2. Schweser, F. et al. Supervised Machine Learning with Blind Source Separation (BSS) reveals distinct networks of pathological changes in brain magnetic susceptibility (QSM): Application to multiple sclerosis. in Proc Intl Soc Mag Reson Med 26 (2018) 3482 (2018).
3. Abdul-Rahman, H. S. et al. Fast and robust three-dimensional best path phase unwrapping algorithm. Appl Opt 46, 6623–6635 (2007).
4. Li, W., Wu, B. & Liu, C. Quantitative susceptibility mapping of human brain reflects spatial variation in tissue composition. Neuroimage 55, 1645–1656 (2011).
5. Schweser, F., Deistung, A., Lehr, B. W. & Reichenbach, J. R. Quantitative imaging of intrinsic magnetic tissue properties using MRI signal phase: an approach to in vivo brain iron metabolism? Neuroimage 54, 2789–2807 (2011).
6. Schweser, F., Sommer, K., Deistung, A. & Reichenbach, J. R. Quantitative susceptibility mapping for investigating subtle susceptibility variations in the human brain. Neuroimage 62, 2083–2100 (2012).
7. Hanspach, J. et al. Methods for the computation of templates from quantitative magnetic susceptibility maps (QSM): Toward improved atlas- and voxel-based analyses (VBA). J Magn Reson Imaging 46, 1474–1484 (2017).
8. Probabilistic independent component analysis for functional magnetic resonance imaging - PubMed. https://pubmed.ncbi.nlm.nih.gov/14964560/.
9. Smith, S. M. et al. Correspondence of the brain’s functional architecture during activation and rest. PNAS 106, 13040–13045 (2009).
10. Douaud, G. et al. A common brain network links development, aging, and vulnerability to disease. Proc Natl Acad Sci U S A 111, 17648–17653 (2014).
11. Desikan, R. S. et al. An automated labeling system for subdividing the human cerebral cortex on MRI scans into gyral based regions of interest. Neuroimage 31, 968–980 (2006).
12. Alkemade, A. et al. The Amsterdam Ultra-high field adult lifespan database (AHEAD): A freely available multimodal 7 Tesla submillimeter magnetic resonance imaging database. NeuroImage 221, 117200 (2020).
13. Diedrichsen, J., Balsters, J. H., Flavell, J., Cussans, E. & Ramnani, N. A probabilistic MR atlas of the human cerebellum. Neuroimage 46, 39–46 (2009).
14. Najdenovska, E. et al. In-vivo probabilistic atlas of human thalamic nuclei based on diffusion- weighted magnetic resonance imaging. Sci Data 5, 180270 (2018).
15. Duann, J., Jung, T., Makeig, S. & Sejnowski, T. J. Consistency of infomax ICA decomposition of functional brain imaging data. in In Proceedings of the fourth international workshop on independent component analysis and blind signal separation 289–294 (2003).
16. Ramos, P. et al. Iron levels in the human brain: a post-mortem study of anatomical region differences and age-related changes. J Trace Elem Med Biol 28, 13–17 (2014).
17. Morris, C. M., Candy, J. M., Oakley, A. E., Bloxham, C. A. & Edwardson, J. A. Histochemical distribution of non-haem iron in the human brain. Acta Anat 144, 235–57 (1992).
18. Amen, D. G. et al. Discriminative Properties of Hippocampal Hypoperfusion in Marijuana Users Compared to Healthy Controls: Implications for Marijuana Administration in Alzheimer’s Dementia. J Alzheimers Dis 56, 261–273 (2017).
19. Clark, L. R. et al. Elevated cerebrovascular resistance index is associated with cognitive dysfunction in the very-old. Alzheimer’s Research & Therapy 7, 3 (2015).
20. Selim, M., Jones, R., Novak, P., Zhao, P. & Novak, V. The Effects of Body Mass Index on Cerebral Blood Flow Velocity. Clin Auton Res 18, 331–338 (2008).
21. Reddy, O. C. & van der Werf, Y. D. The Sleeping Brain: Harnessing the Power of the Glymphatic System through Lifestyle Choices. Brain Sci 10, 868 (2020).
22. Kruit, M. C., Launer, L. J., Overbosch, J., van Buchem, M. A. & Ferrari, M. D. Iron accumulation in deep brain nuclei in migraine: A population-based Magnetic Resonance Imaging study. Cephalalgia 29, 351–359 (2009).
23. Tepper, S. J. et al. Iron deposition in pain-regulatory nuclei in episodic migraine and chronic daily headache by MRI. Headache 52, 236–243 (2012).
Figures