4840
Differentiating TCA Cycle Activity of Gray and White Matter in Human Brain at 7T Using High Resolution Dynamic Deuterium MRS Imaging with SPICE1University of Minnesota, Minneapolis, MN, United States, 2Beckman Institute for Advanced Science and Technology, Urbana, IL, United States, 3Department of Electrical and Computer Engineering, University of Illinois at Urbana-Champaign, Urbana, IL, United States
Synopsis
The emerging deuterium MRS (DMRS) imaging (DMRSI) technology has shown great promise in studying brain glucose metabolism, TCA cycle and glycolytic activity. In particular, its potential as a clinical tool for tumor detection in brain or other organs has attracted a lot of attention. However, the temporal and spatial resolution of dynamic DMRSI is limited by its low detection sensitivity. In this study, we proved that 7T high-resolution dynamic DMRSI combined with SPICE method can not only map the Glx production rate constant, but also distinguish the TCA cycle activity level between human brain gray matter and white matter.
INTRODUCTION
Recently developed in vivo deuterium (2H) MRS (DMRS) technique has shown promises in simultaneous study of cerebral metabolic rates of glucose consumption, TCA cycle and lactate (Lac) production1. The translational potential of deuterium-based metabolic imaging for detecting the “Warburg effect” in brain tumor has also raised many interests2-4. However, DMRS imaging (DMRSI) suffers from low detection sensitivity and low metabolite concentration that seriously limit its applications. Recently, SPICE method has been demonstrated useful to improve the sensitivity of DMRSI in rat brain5. In this work, we demonstrate that it is possible to differentiate the TCA cycle activity of gray and white matter in human brain using SPICE-based high-resolution dynamic DMRSI at 7T.METHODS
In vivo MR data acquisition and analysis: Three subjects participated in the DMRSI study with oral administration of D-Glucose-6,6-d2 (Cambridge Isotope Lab, 0.6-0.75 g/kg dose, 30% solution). The University of Minnesota IRB approved the study protocol. A 7T Siemens human scanner (Magnetom, Germany) and a passively decoupled quadrature 1H and single loop 2H (8.9cm diameter) surface coil covering the occipital lobe were used. High-resolution dynamic 3D 2H-CSI with ~0.4cc nominal voxel size (TR=175ms, matrix=13×13×9 and FOV=10×10×8cm3) and 92s per CSI volume were acquired before and after the oral intake of the D66-glucose solution. After SPICE reconstruction, all resonance signals of deuterated water (HDO), glucose (Glc) and Glx (glutamate/glutamine) were analyzed and high-resolution images of the metabolites were generated. The post-$$D66 Glx time courses were fitted to exponential function y=a*exp(-kt)+b, and the rate constant k was obtained for each voxels inside brain, which presents the Glx production rate and reflects the TCA cycle activity level.The T1-weighted 1H images were co-registered to match the 2H-CSI data. Brain tissue segmentation was performed on the 1H MRI using the multiplicative intrinsic component optimization (MICO) algorithm6, which segmented the brain into grey matter (GM), white matter (WM) and cerebrospinal fluid (CSF). The fraction of GM, WM, and CSF was calculated for each CSI voxel.SPICE-based DMRSI data processing: Reconstruction of the desired spectral and temporal functions from the acquired 2H-CSI data was accomplished based on the SPICE processing scheme. Specifically, we first represented the desired spatial-spectral-temporal distributions using a probabilistic subspace model:
$$\rho(\boldsymbol{x},f,T)=\textstyle\sum_{\ell=1}^L\rho_{\ell}(\boldsymbol{x},f,T)\\\hspace{5.5em}=\textstyle\sum_{\ell=1}^L\phi_{\ell}(\boldsymbol{x},f)\varphi_{\ell}(\boldsymbol{x},T)\\\hspace{16em}=\textstyle\sum_{\ell=1}^L\left\{\sum_{r=1}^{R_{\ell}}c_{r,\ell}(\boldsymbol{x})\phi_{r,\ell}(f)\right\}\left\{\sum_{q=1}^{Q_{\ell}}a_{q,\ell}(\boldsymbol{x})\varphi_{q,\ell}(T)\right\}\\\hspace{5em}\text{with}\:c_{r,\ell}(\boldsymbol{x})\sim\text{P}\left(\left\{c_{r,\ell}\right\}\right)\:\text{and}\:a_{q,\ell}(\boldsymbol{x})\sim\text{P}\left(\left\{a_{q,\ell}\right\}\right). $$
This model was recently introduced5, which exploited the partial separability of 2H-CSI signals and incorporated pre-learned spectral priors and parameter distributions. Then, we obtained the reconstructed 2H-CSI signals by solving the following optimization problem voxel-by-voxel:
$$\text{min}_{\left\{c_{r,\ell}\right\}\left\{a_{q,\ell}\right\}}\left \|\rho(\boldsymbol{x},f,T)-\textstyle\sum_{\ell=1}^L\left\{\sum_{r=1}^{R_{\ell}}c_{r,\ell}(\boldsymbol{x})\phi_{r,\ell}(f)\right\}\left\{\sum_{q=1}^{Q_\ell}a_{q,\ell}(\boldsymbol{x})\varphi_{q,\ell}(T)\right\}\right \|_{2}^{2}
\\-\lambda\text{ log}\left(P\left(\left\{c_{r,\ell}\right\}\right)P\left( \left\{a_{q,\ell}\right\}\right)\right).$$
RESULTS
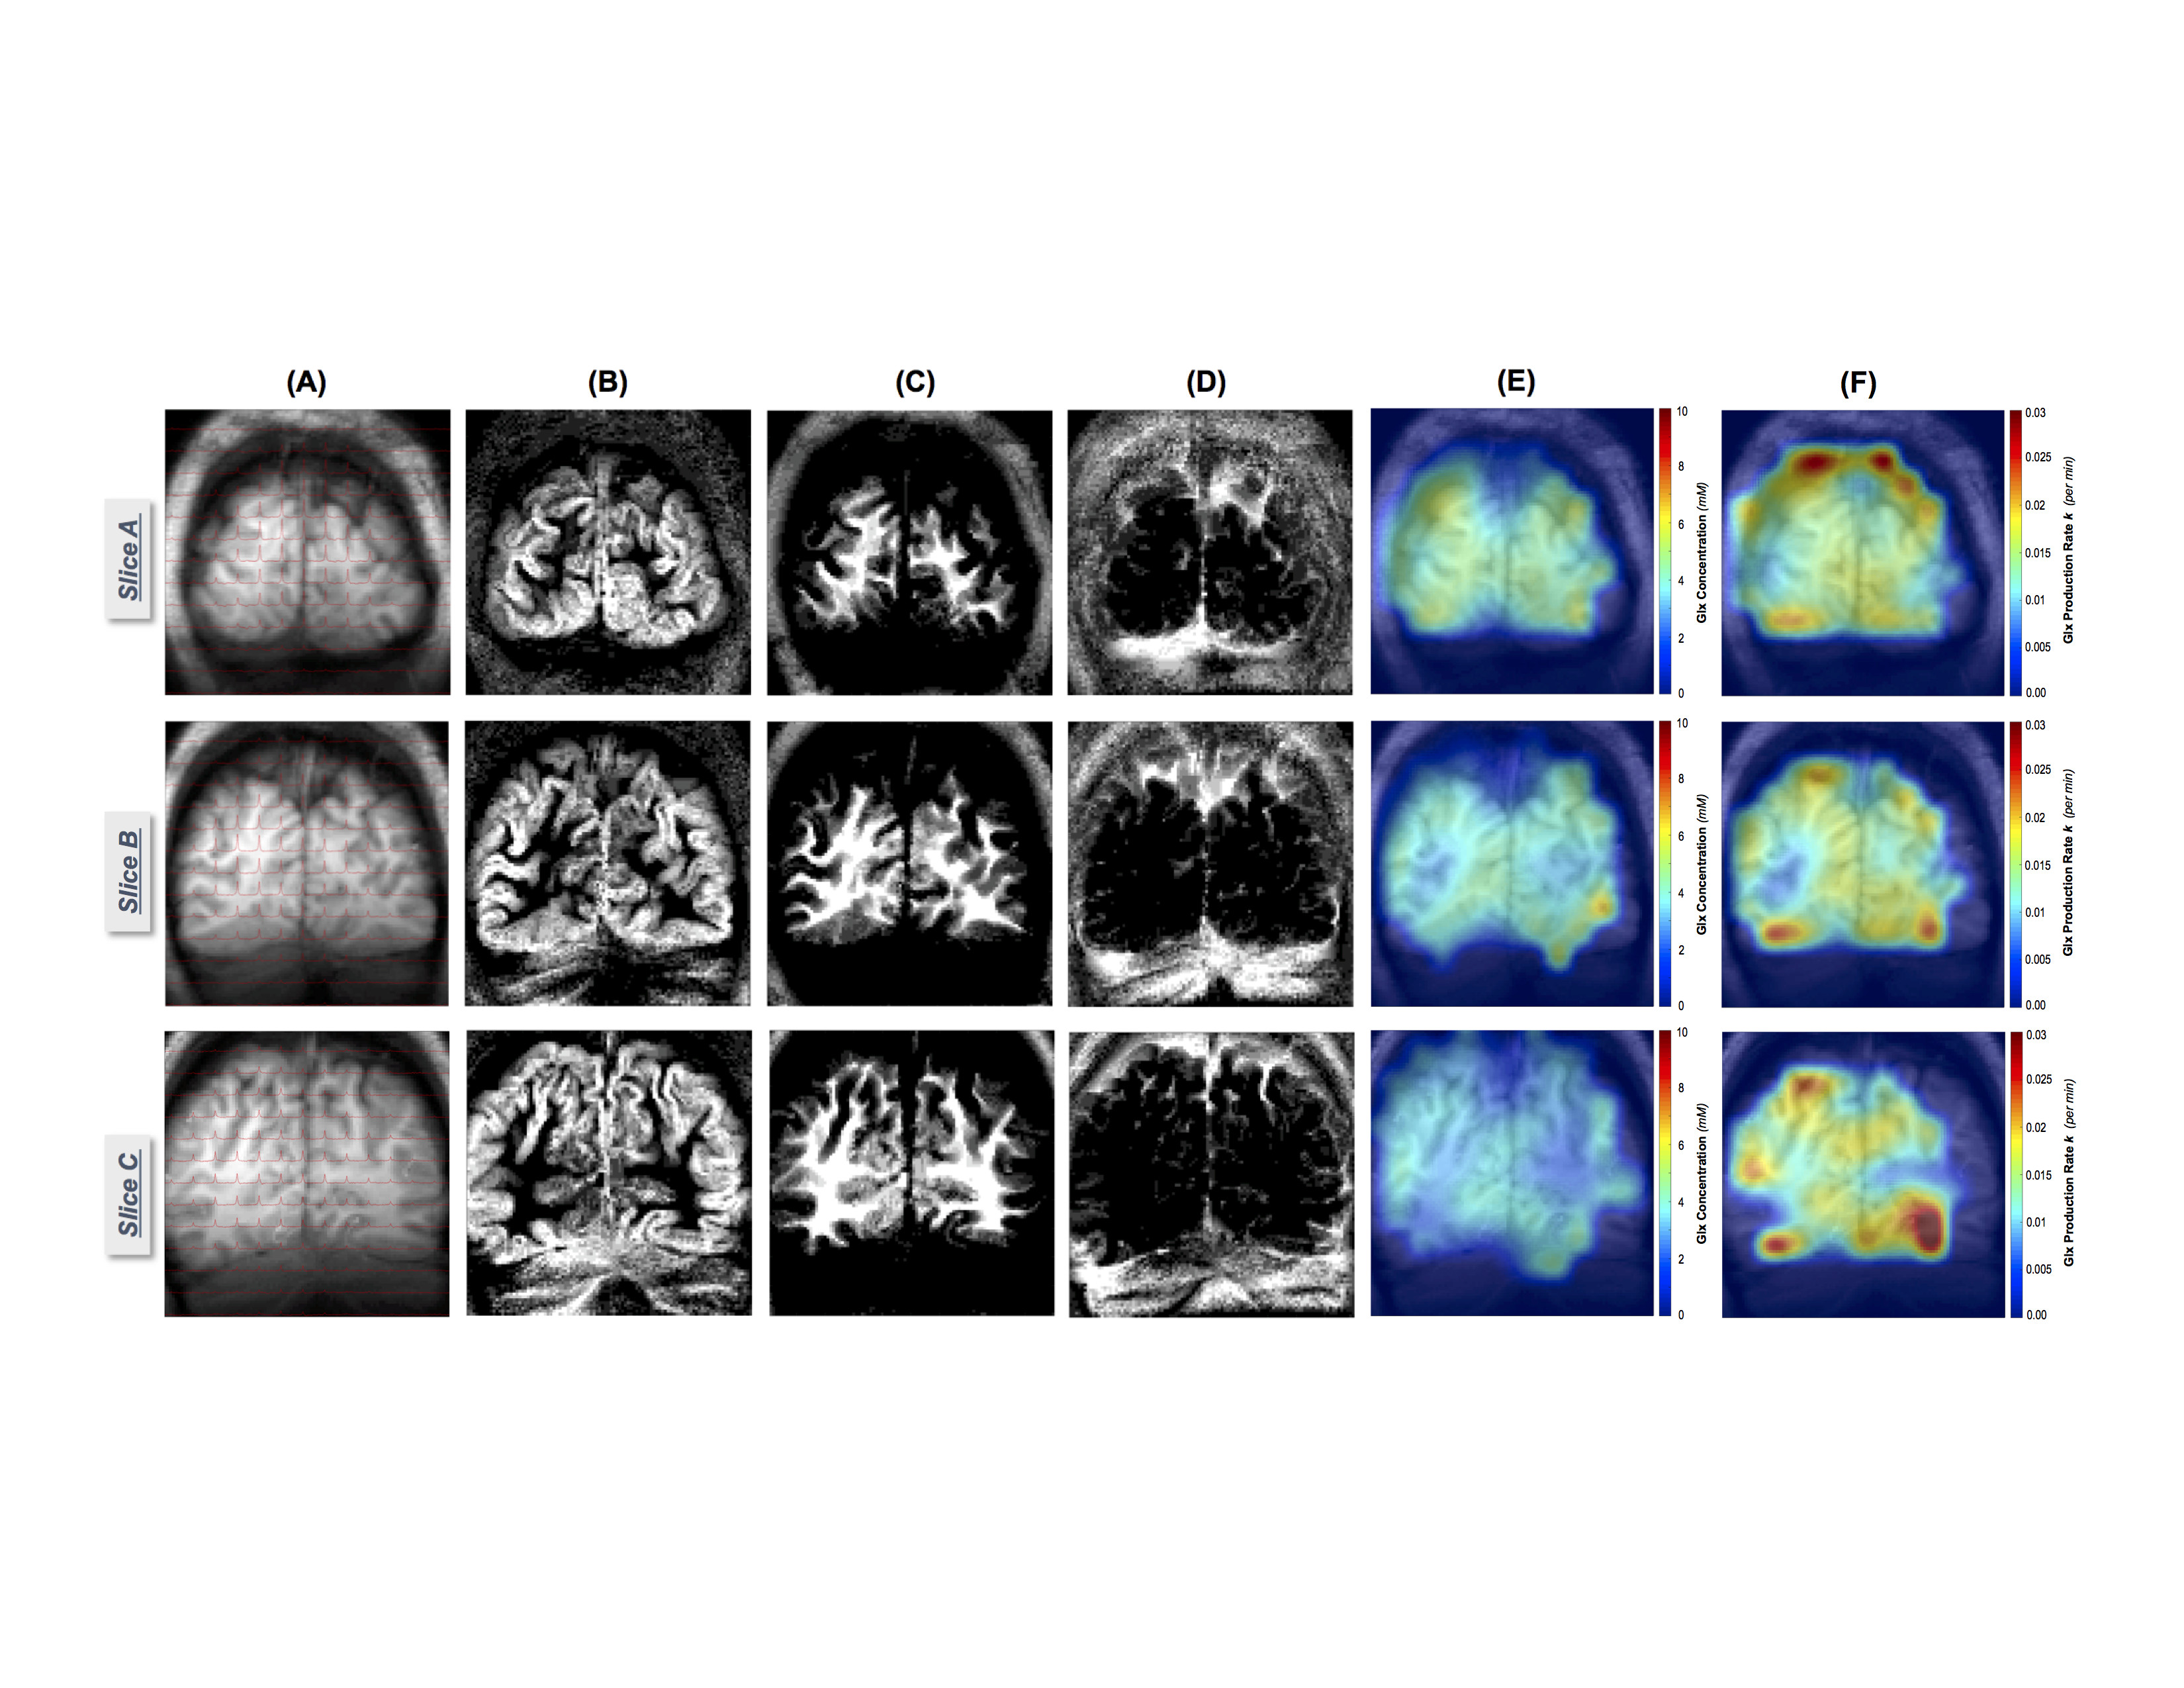
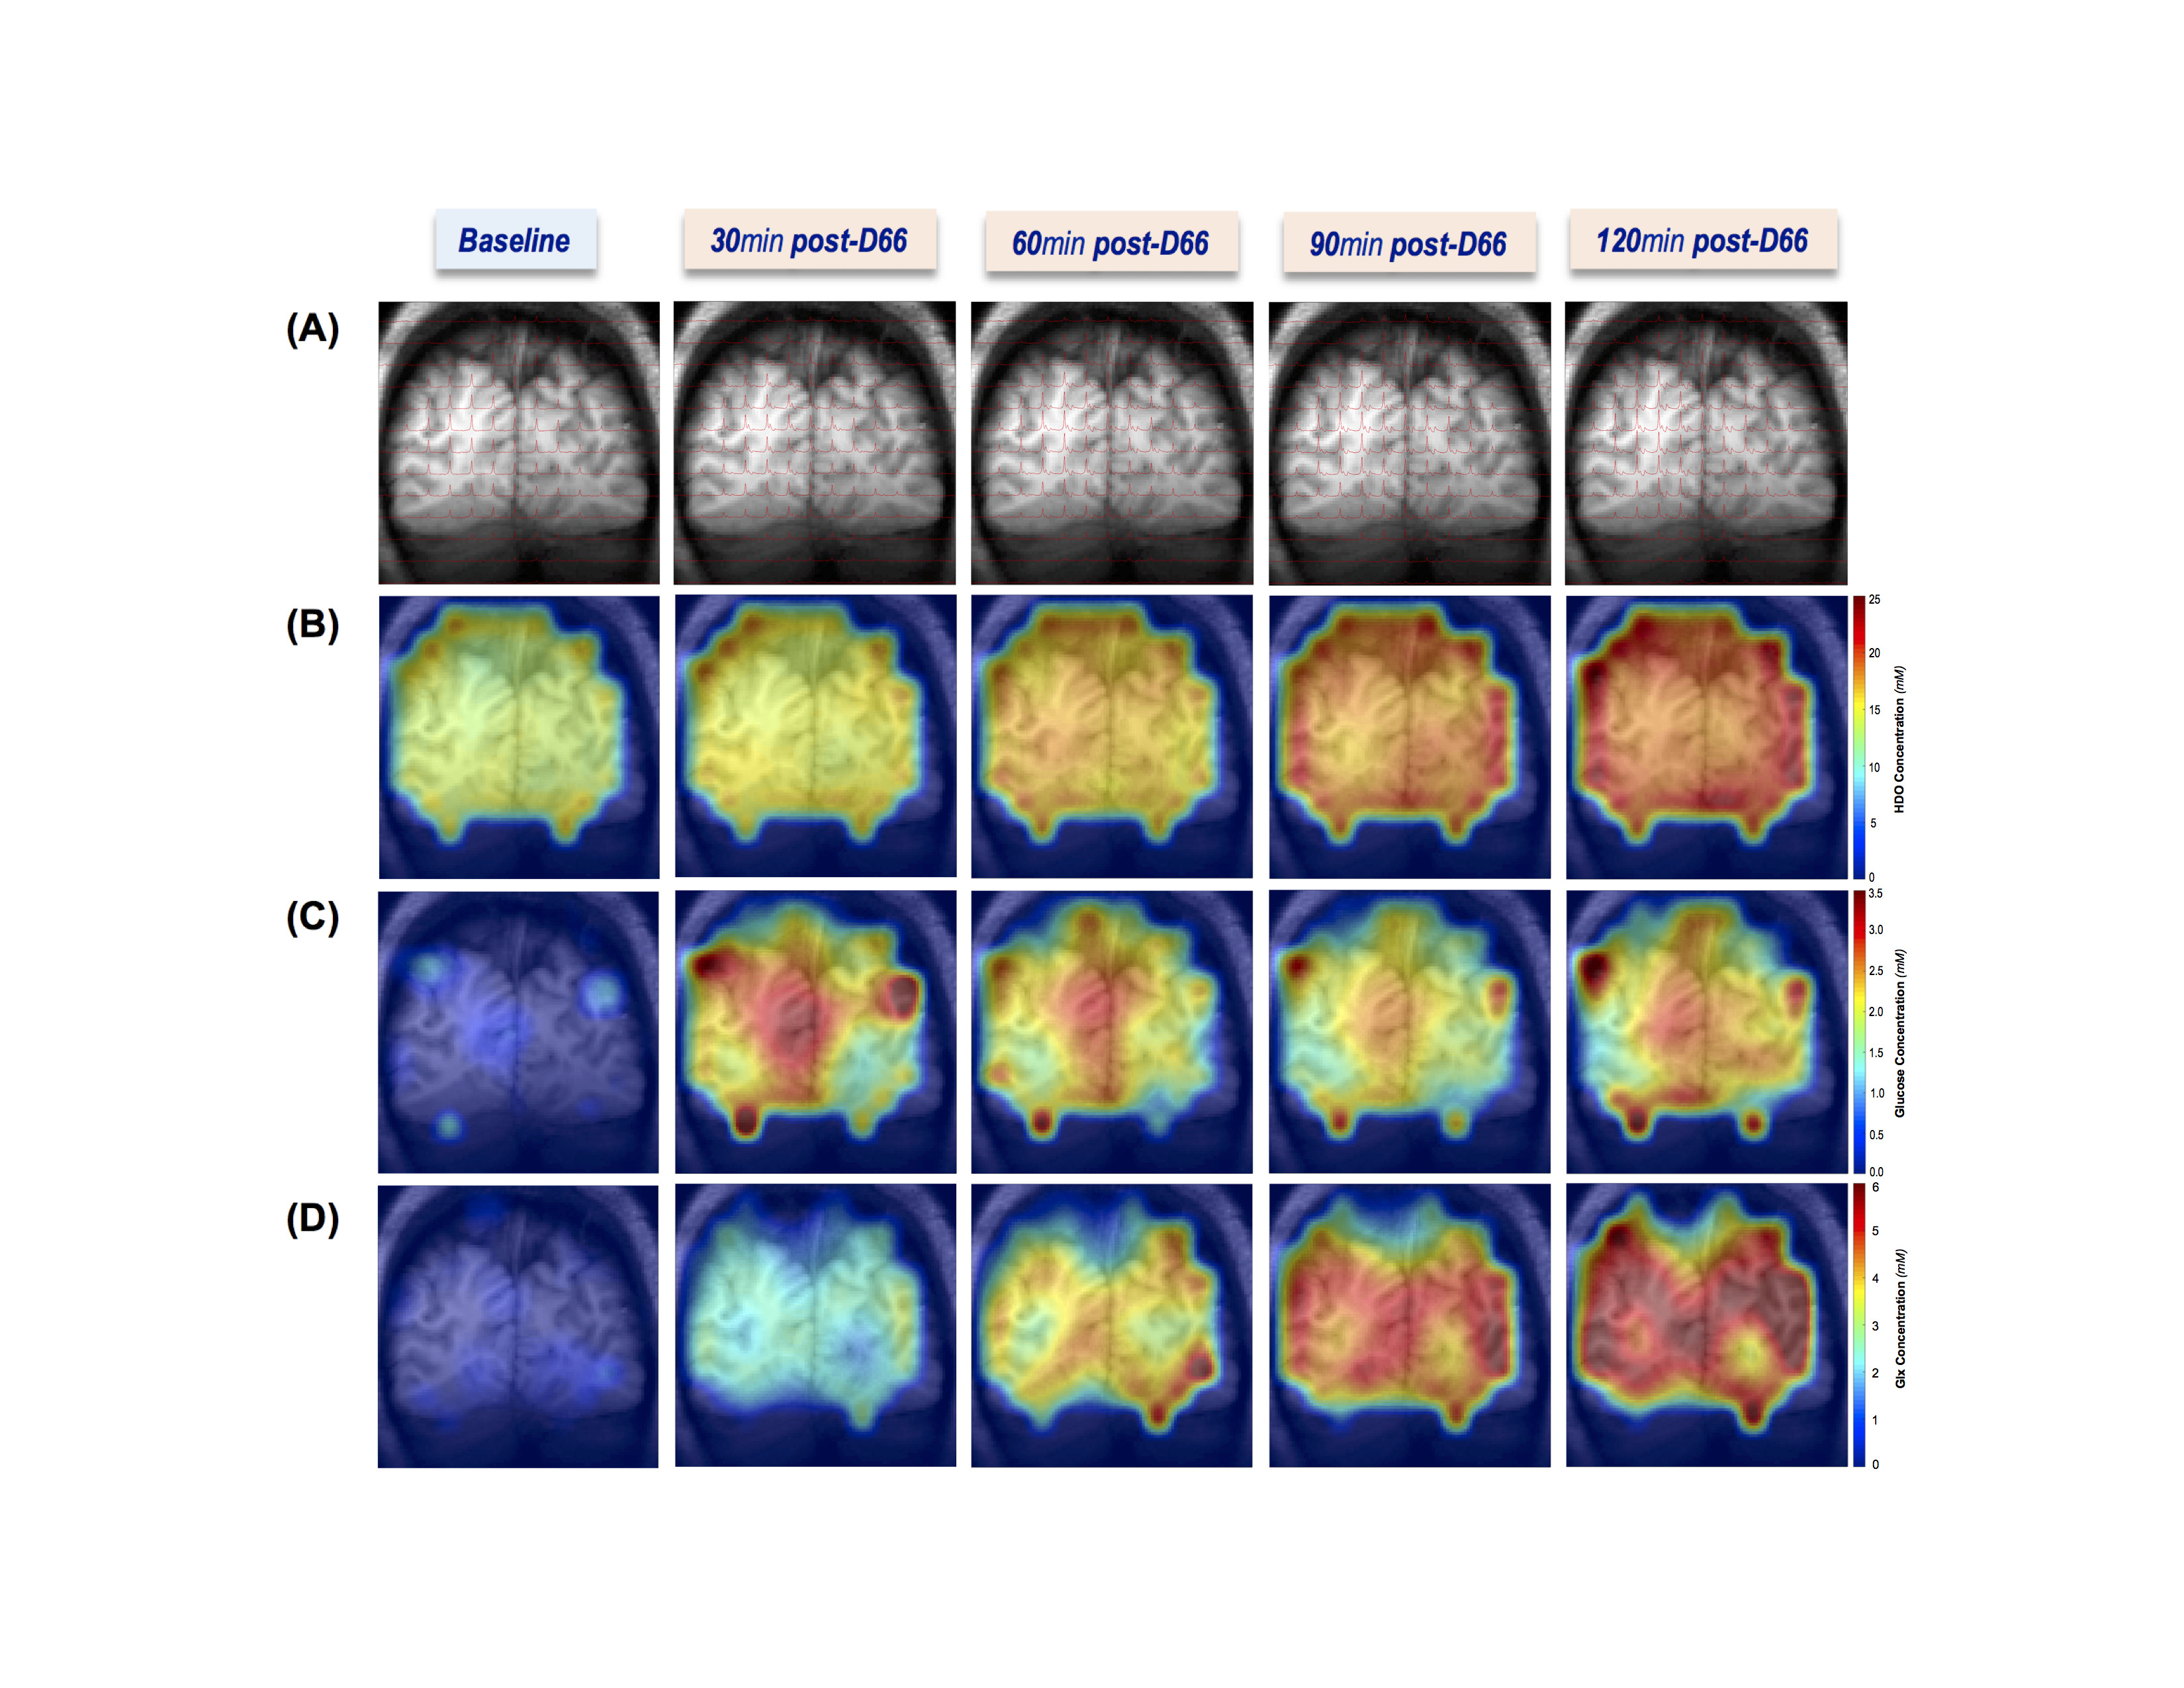
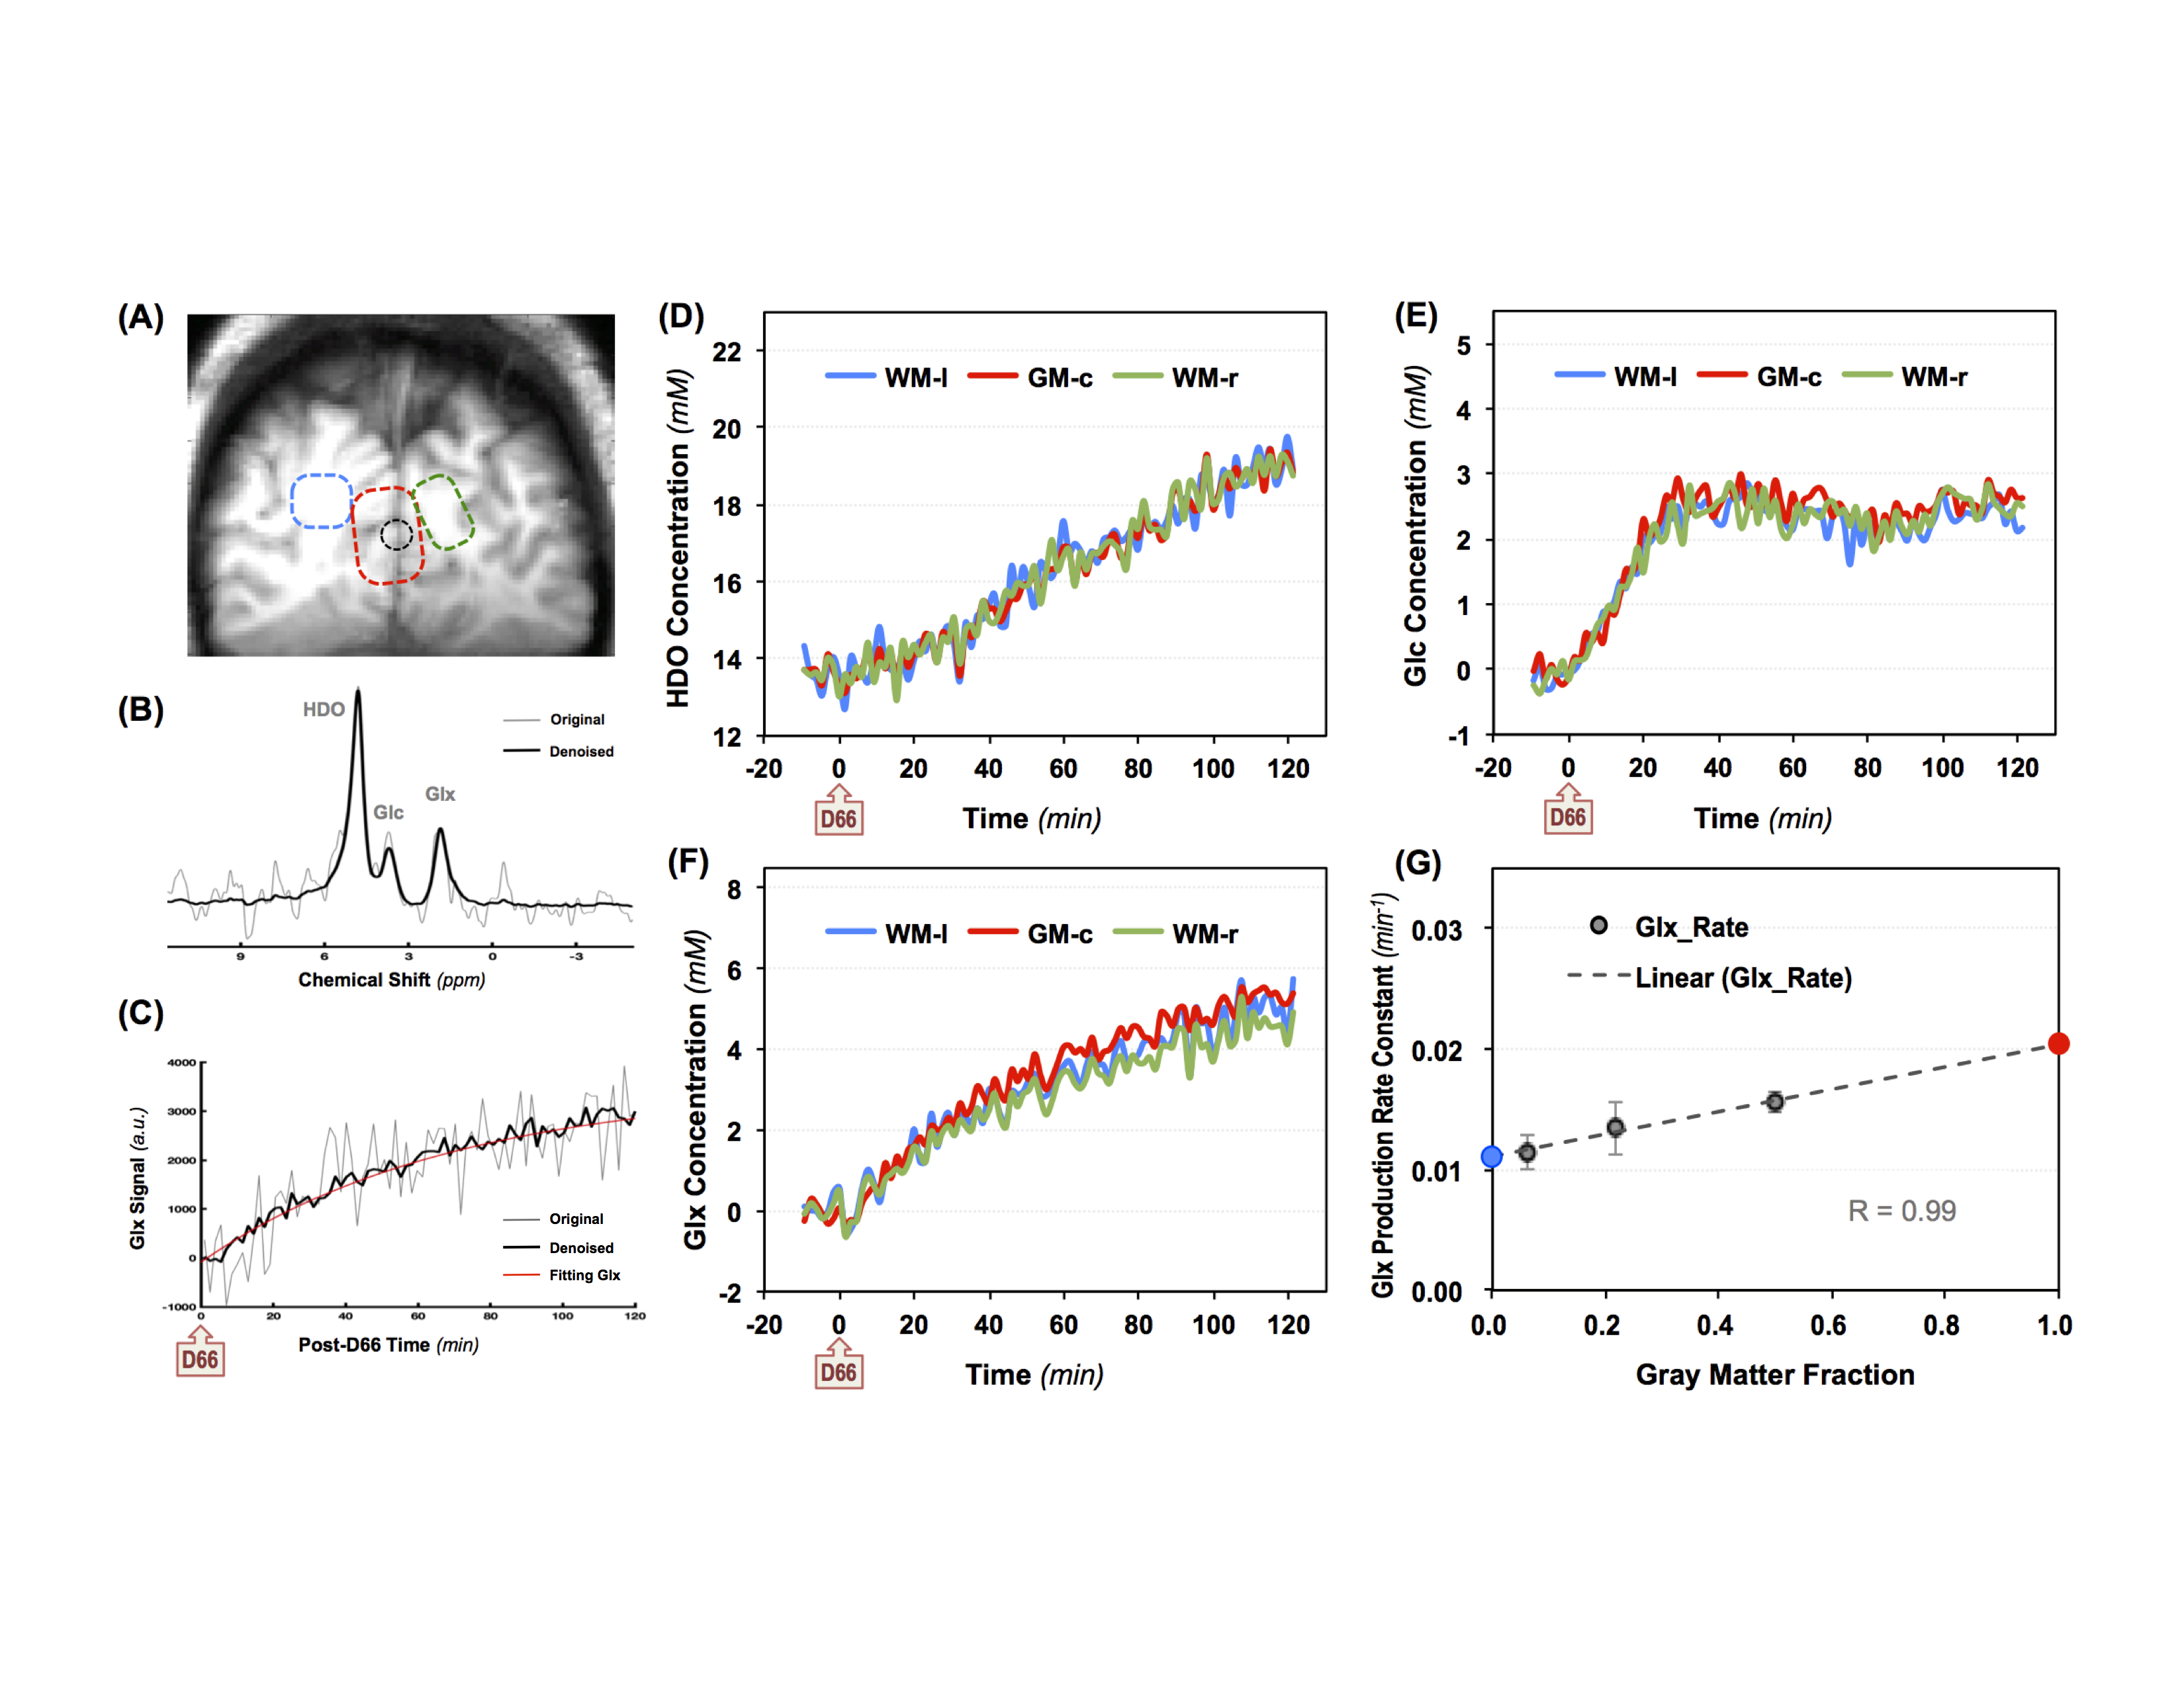
Figure 1 shows three imaging slices in a representative brain, which include the denoised 2H-CSI overlay on the corresponding 1H MRI (Fig.1A), the segmented GM, WM and CSF images (Figs.1B-1D), the metabolic maps of Glx at 60min post-D66 (Fig.1E) and the Glx rate constant (k) maps (Fig.1F). The high quality of the DMRSI data is evident. It appears that the Glx concentration and k rate maps display certain level of GM-WM contrast. This observation has been confirmed by data shown in Fig. 2, where the temporal evolution of different metabolites is presented, although the HDO and Glc concentration maps do not show obvious contrast between GM and WM. Similar to the previous animal DMRS studies1-4, the HDO concentration in the human brain continue to increase after oral D66 administration, while the 2H-labeled glucose signals increased quickly, reached peak values ~30min after drinking D66 and slowly decreased thereafter.To better understand the spatial and temporal changes of the metabolites in different brain tissue, we performed voxel and region of interest (ROI) based analysis. Figure 3A illustrates the location of such voxel and ROIs, while Figs. 3B-3C demonstrate the high fidelity of the SPICE reconstruction method in removing the noise and capturing the spectral-temporal features. We found that the time courses of HDO in GM and WM dominated ROIs are non-distinguishable (Fig. 3D), while the differences in Glc and Glx are apparent (Figs. 3E-3F). Figure 3G plots the k values of Glx within ROIs against their GM fraction, it displays a strong correlation (R=0.99). Thus, we can extrapolate the k rate constant of Glx in pure GM (kGM=0.021min-1, red circle) and pure WM (kWM=0.011min-1, blue circle).
DISCUSSION and CONCLUSION
Steady-state DMRSI technique with relatively high spatial resolution can be achieved via temporal averaging for studying brain tumor4. However, it is more challenging to push the spatiotemporal resolution of dynamic DMRS imaging, which requires optimized data acquisition and advanced data processing schemes7,8. In the present study, we achieved 0.4cc and 1.5 min spatiotemporal resolution with superior sensitivity for SPICE-based dynamic DMRSI in human brain at 7T with several folds reduction in spectral noise (Fig. 3B) and temporal fluctuation (Fig. 3C). With tissue segmentation, our results show that it is possible to differentiate the Glx production rate constant in different brain tissues, which should tightly link to the TCA cycle activity. Based on the DMRSI measurement, for the first time, we determined that the pure gray matter can produce two times faster (or more) of the Glx as compared to the white matter. We believe that with further development of the quantification model, this approach could provide a highly valuable and robust metabolic imaging tool for human brain applications.Acknowledgements
NIH Grants: R01CA240953, U01EB026978, R01MH111413, R01NS118330, P41EB027061, P30 NS076408 and S10 RR025031.References
1. Lu, M. et al. Quantitative assessment of brain glucose metabolic rates using in vivo deuterium magnetic resonance spectroscopy. J Cereb Blood Flow Metab, 37:3518-3530 (2017)
2. Lu, M. et al. Simultaneous Assessment of Abnormal Glycolysis and Oxidative Metabolisms in Brain Tumor using In Vivo Deuterium 2H MRS Imaging in Proc. ISMRM 26: p. 3962, (2016).
3. Lu, M. et al. High-resolution Deuterium MR Spectroscopic Imaging of the Warburg Effect in Brain Tumor. in Proc. Intl. ISMRM 26: p. 4852, (2018).
4. De Feyter, H. M. et al. Deuterium metabolic imaging (DMI) for MRI-based 3D mapping of metabolism in vivo. Sci Adv 4, eaat7314, (2018).
5. Li Y et al. Machine Learning-Enabled High-Resolution Dynamic Deuterium MR Spectroscopic Imaging. IEEE Trans Med Imaging doi:10.1109/TMI.2021.3101149 (2021).
6. Li C, Gore JC, Davatzikos C. Multiplicative intrinsic component optimization (MICO) for MRI bias field estimation and tissue segmentation. Magn Reson Imaging. 32(7):913-23 (2014).
7. Kreis F et al. Measuring Tumor Glycolytic Flux in Vivo by Using Fast Deuterium MRI. Radiology. 294:289–296 (2020).
8. Ruhm L. et al. Deuterium Metabolic Imaging in the human brain at 9.4 Tesla with high spatial and temporal resolution. NeuroImage. Oct 9:118639 (2021).
Figures