4836
Improvement of Accuracy and Stability of Oxygen Extraction Fraction Measurements by Using Triple-Echo Asymmetric Spin Echo Sequence1University of Southern California, Los Angeles, CA, United States, 2Cardiology, Children's Hospital Los Angeles, Los Angeles, CA, United States
Synopsis
Asymmetric Spin Echo (ASE) is a popular technique to obtain quantitative estimates of R2’, cerebral venous blood volume (vCBV), and oxygen extraction fraction (OEF) noninvasively in normal subjects. In this study, We demonstrated the feasibility of using Triple-Echo ASE to induce a more stable and accurate vCBV and OEF estimates with no increase in scan time. In addition, this study investigated the role of diffusion in ASE measurements and provided insights into future acquisition approaches.
Introduction
Asymmetric Spin Echo (ASE) technique is a modified spin echo sequence, proposed for obtaining quantitative estimates of R2’, cerebral venous blood volume (vCBV), and oxygen extraction fraction (OEF) noninvasively in normal subjects.1 The ASE model assumes the signal behaves in the static dephasing regime, in which diffusion is negligible.2 Diffusion gradients are also often applied to suppress intravascular flow signal. However, recent measurements of vCBV produced by ASE technique were systematically higher than measurements from other techniques, resulting in potential underestimation of OEF estimates.3 Using Monte Carlo simulations, some researchers have also revealed that OEF measurements are dependent on echo time and spin echo displacement time.4 The purpose of this study was to demonstrate the feasibility of using Triple-Echo ASE technique for the improvement of stability and accuracy for the measurement of vCBV and tissue OEF. We hypothesized that increasing the number of data points for fitting would increase the stability of R2’ measurements, thus increasing the accuracy of vCBV and OEF estimates. In addition, this study investigated the role of diffusion in ASE measurements and providing insights into future acquisition approaches.Methods
MRI Acquisition: A total of 3 healthy subjects (1 female, age 26±4) were studied. All subjects underwent an MR study using Philips 3T Achieva with a 32-element head coil. For each subject, Triple-Echo ASE (Figure 1) was acquired with the following parameters: TR = 3000 ms, TE1/TE2/TE3 = 62/93/124 ms, resolution = 3*3*6 mm3, matrix size = 64*64, τ range = 10:0.5:20 ms. Diffusion gradients with 3 sets of b values ( 0/40/100 s/mm2) were tested to suppress the intravascular signal. Each scan was composed of 28 dynamics, including 7 spin echo scans (τ = 0) and other 21 equally spaced τ value from 10ms to 20ms for each echo. The total scan time for the 3-echo ASE was about 3 minutes.ASE Model: The ASE model relies on the known relationship between R2’, OEF, and deoxygenated blood volume fraction for a network of blood vessels approximated as randomly oriented cylinders with infinite length.1,2,5
$$R_2' = \frac{4}{3\pi}\times\gamma\times\triangle\chi\times Hct \times B_{0} \times OEF \times\lambda$$
where γ is the gyro-magnetic ratio, B0 is the main magnetic field strength, Hct is the fractional hematocrit, Δχ is the susceptibility difference between fully oxygenated and fully deoxygenated blood, and λ is the venous blood volume fraction. With constant TE and a sufficiently long TR, the signal decay can be simplified to two relaxation regimes separated by 2𝜏:
$$S_{S} = c \times exp(-0.3\times\lambda\times(\delta\omega\times2\tau)^{2})$$
$$S_{L} = c \times exp(-\lambda\times\delta\omega\times2\tau+\lambda)$$
R2’ and λ can be estimated by calculating the slope and intercept in the plot of log (SL(t)) versus 2τ .
Image Processing: For each subject, the ASE data were smoothed by a 3*3 Gaussian kernel to improve SNR. For every voxel in 3-echo ASE dataset, the first 7 spin echo values were averaged as the spin echo value, and the remaining 21 values with different τ were fitted linearly in log space to generate R2’ and λ for each echo. The final R2’ was calculated as the mean of all three R2’ values. To minimize the effects of large background magnetic field inhomogeneities, regions with obvious artifacts or fitting R2 value under 0.85 were excluded for the final OEF calculation.6
Results
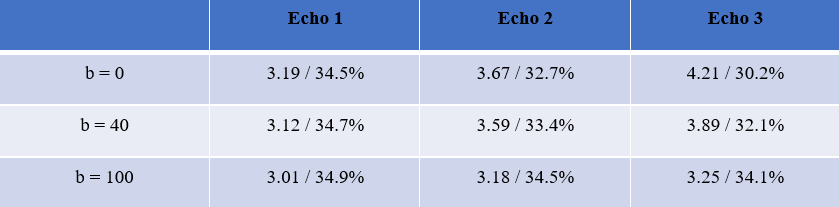
Representative ASE source images and signal fitting for all three echoes are shown in Figure 2. Average signal decay and fitting for all three echoes with different b values are shown in Figure 3 for a representative subject. A similar pattern is also noticed in the other two subjects. Detailed mean R2’ and OEF measurements for all three echoes with different b values are shown in Table 1. In the absence of a diffusion gradient, R2’ increases with echo number. A diffusion gradient of 100 s/mm2 is required to stabilize the three R2’ estimates.Discussion
In this study, we implemented the Triple-Echo ASE to measure brain tissue R2’, vCBV and OEF in three healthy subjects, and all the values were within acceptable range of literature.7,8 We also investigated the effect of diffusion gradient at different echo times and it revealed the signal decreased faster at later echoes when there was no diffusion gradient. Intravascular signal could be contributing to this effect, however a diffusion gradient of 40 s/mm2 was not sufficient to abolish it. We postulate the later echoes have a greater fraction of spins that experience strong dephasing through proximity to vessel surfaces; this requires stronger diffusion suppression to satisfy the static refocusing regime requirement.Triple echo ASE does not improve ASE’s other methodological limitations, including poor fitting quality near air-filled regions and the need for background field correction.
Acknowledgements
We would like to thank Dr. Hongyu An from Washington University St. Louis who suggested adding the additional echoes and helped us optimize our asymmetric spin echo acquisitions.
This work is supported by the National Heart Lung and Blood Institute (1RO1HL136484-A1, 1U01HL117718-01), the National Institutes of Health (1R01-NS074980), the National Institute of Clinical Research Resources (UL1 TR001855-02), the National Center for Research (5UL1-TR000130-05) through the Clinical Translational Science Institute at Children’s Hospital Los Angeles, Additional Ventures Single Ventricular Fund, and by research support in kind from Philips Healthcare.
References
1. An, Hongyu, and Weili Lin. "Impact of intravascular signal on quantitative measures of cerebral oxygen extraction and blood volume under normo‐and hypercapnic conditions using an asymmetric spin echo approach." Magnetic Resonance in Medicine: An Official Journal of the International Society for Magnetic Resonance in Medicine 50.4 (2003): 708-716.
2. Yablonskiy, Dmitriy A., and E. Mark Haacke. "Theory of NMR signal behavior in magnetically inhomogeneous tissues: the static dephasing regime." Magnetic resonance in medicine 32.6 (1994): 749-763.
3. Stone, Alan J., et al. "Prospects for investigating brain oxygenation in acute stroke: Experience with a non‐contrast quantitative BOLD based approach." Human brain mapping 40.10 (2019): 2853-2866.
4. Stone, Alan J., et al. "Simulations of the effect of diffusion on asymmetric spin echo based quantitative BOLD: An investigation of the origin of deoxygenated blood volume overestimation." Neuroimage 201 (2019): 116035.
5. An, Hongyu, and Weili Lin. "Quantitative measurements of cerebral blood oxygen saturation using magnetic resonance imaging." Journal of Cerebral Blood Flow & Metabolism 20.8 (2000): 1225-1236.
6. Shen, Jian. “Quantitative Measurement of Cerebral Oxygen Extraction in Patients with Sickle Cell Disease after Diamox Injection Using Asymmetric Spin Echo.” ISMRM 2020
7. He, Xiang, and Dmitriy A. Yablonskiy. "Quantitative BOLD: mapping of human cerebral deoxygenated blood volume and oxygen extraction fraction: default state." Magnetic Resonance in Medicine: An Official Journal of the International Society for Magnetic Resonance in Medicine 57.1 (2007): 115-126.
8. Lu, Hanzhang, et al. "Calibration and validation of TRUST MRI for the estimation of cerebral blood oxygenation." Magnetic resonance in medicine 67.1 (2012): 42-49.
Figures
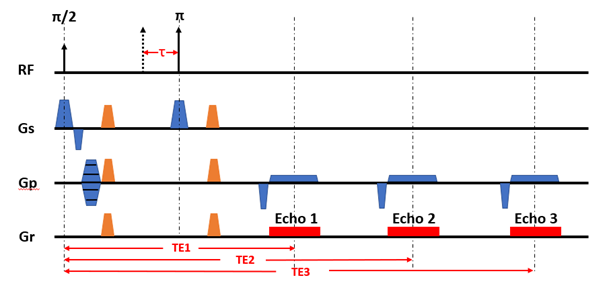
Figure 1. Sequence diagram of Triple-Echo ASE. (Diffusion gradients are illustrated in orange)
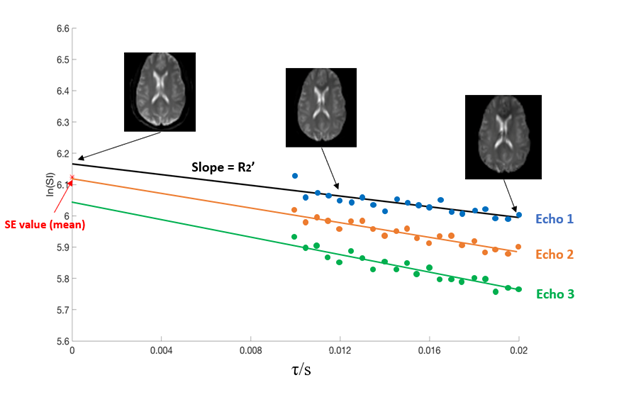
Figure 2. Representative signal decay curve of one voxel for all three echoes. The first 7 spin echo values are averaged, shown with the red star. The following 21 values are fitted to a linear line, the slope of which is R2’ and the difference between the intercept and the averaged spin echo value is l. Three typical ASE images from dynamic 1, 12, 28 are also shown.
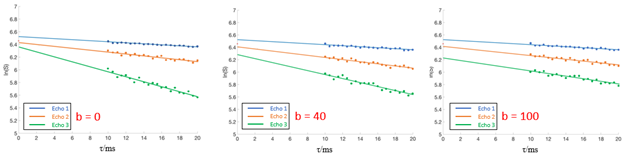
Figure 3. Mean signal decay curve for Subject 1 with different b values.