4835
Principal Spectra Analysis by Linear Modeling (PSALM)
Alexander Saunders1,2 and Stefan Blüml1,2
1Radiology, Children's Hospital Los Angeles, University of Southern California, Los Angeles, CA, United States, 2Rudi Schulte Research Institute, Santa Barbara, CA, United States
1Radiology, Children's Hospital Los Angeles, University of Southern California, Los Angeles, CA, United States, 2Rudi Schulte Research Institute, Santa Barbara, CA, United States
Synopsis
We hypothesized in vivo MR spectra can be sufficiently described by spectra representing predominant cell/tissue types rather than individual metabolites. We sought to extract two putative basis spectra of grey matter and white matter from 584 single-voxel 3T MR spectra using the principal spectra analysis by linear modeling (PSALM) custom algorithm. Two extracted PSALM bases explained >95% of fit variance; principal component analysis required 6-8 components to achieve the same. We found the algorithm produced high signal-to-noise, low linewidth basis spectra that robustly fit in vivo spectra from normal brain.
Introduction
In vivo MR spectra are linear combinations of the signals of chemicals present in cells/tissues. We hypothesized that the relative concentrations of metabolites for individual cell or tissue types might be highly stable across subjects in normal brain. Thus, sums of metabolites could be used to perform fits, requiring fewer free parameters. In this study we used our principal spectra analysis by linear modeling (PSALM) algorithm to construct putative “basis” spectra of parietal/occipital grey matter (GM) and parietal white matter (WM) for various age groups as linear combinations of large sets of in vivo spectra.Methods
Our analysis included 584 single-voxel spectra acquired on clinical 3T MR scanners (PRESS, TE 35ms, TR 2000ms, NAV=128) from controls and patients with minor indications for MRI (MRI reported as unremarkable). The iterative algorithm for constructing PSALM basis spectra is illustrated in Fig. 1. For comparison, principal component analysis of the same spectra was performed using standard MATLAB functions. In a secondary analysis, PSALM basis spectra were fitted by LCModel1 to measure contributions of individual metabolites (Fig. 2).Results
Two PSALM basis spectra explained > 95% (>98% when adjusting for signal offset) of the variance of the in vivo spectra for each age group (Fig. 3, Table 1). Expanding the number of PSALM basis spectra to more than two spectra improved the fits only marginally (not shown). On the other hand, typically, 6-8 principal components were needed to explain equivalent variance. PSALM spectra were of high quality with high signal-to-noise and small linewidth. Fitting those spectra with LCModel provided robust observations of features that are borderline quantifiable in individual spectra (Fig. 4).Discussion
In vivo spectra of grey and white matter should be considered as “mostly” grey or “mostly” white matter spectra as, due to the morphology of the brain, they inevitably contain varying amounts of other tissue/cell types. We found that in normal brain, in vivo spectra labeled as grey or white matter can be fitted robustly and with minimal residual signal using only the two PSALM basis spectra with a total of 5 free fit parameters: amplitude (x 2), line broadening, zero-phase, and shift. This pre-analysis of spectra can provide stable estimates for baselines that do not rely on any assumptions but instead are based on consistently observed patterns across many spectra. This mimics the process of an operator identifying distortions/artifacts by experience.Conclusions
PSALM spectra are of high quality and allow the analysis of small details that are beyond reach in individual spectra due to limitations of signal-to-noise and line width.Acknowledgements
We would like to acknowledge the Rudi Schulte Research Institute for their support.References
1. S. W. Provencher, “Estimation of metabolite concentrations from localized in vivo proton NMR spectra,” Magnetic Resonance in Medicine 30(6), 672–679 (1993) [doi:10.1002/mrm.1910300604].Figures
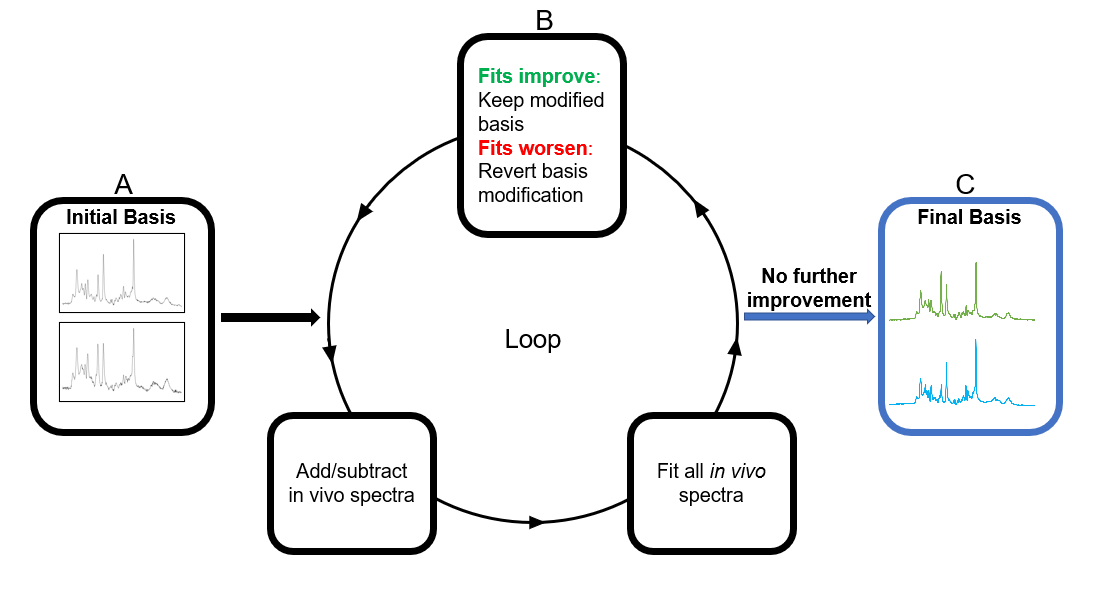
Figure 1. Principal Spectra Analysis by Linear Modeling (PSALM) algorithm. Bases
are initialized to random in vivo spectra (A) and modified by adding or
subtracting other spectra. Modified bases are used to fit a set of spectra. If
fit residual improves, the modification is permanently accepted (B).
Modifications are repeated with different spectra until no further improvement
(C). This process produces basis spectra that incorporate coherent information
from the set of fit spectra and suppress artifacts/distortions.
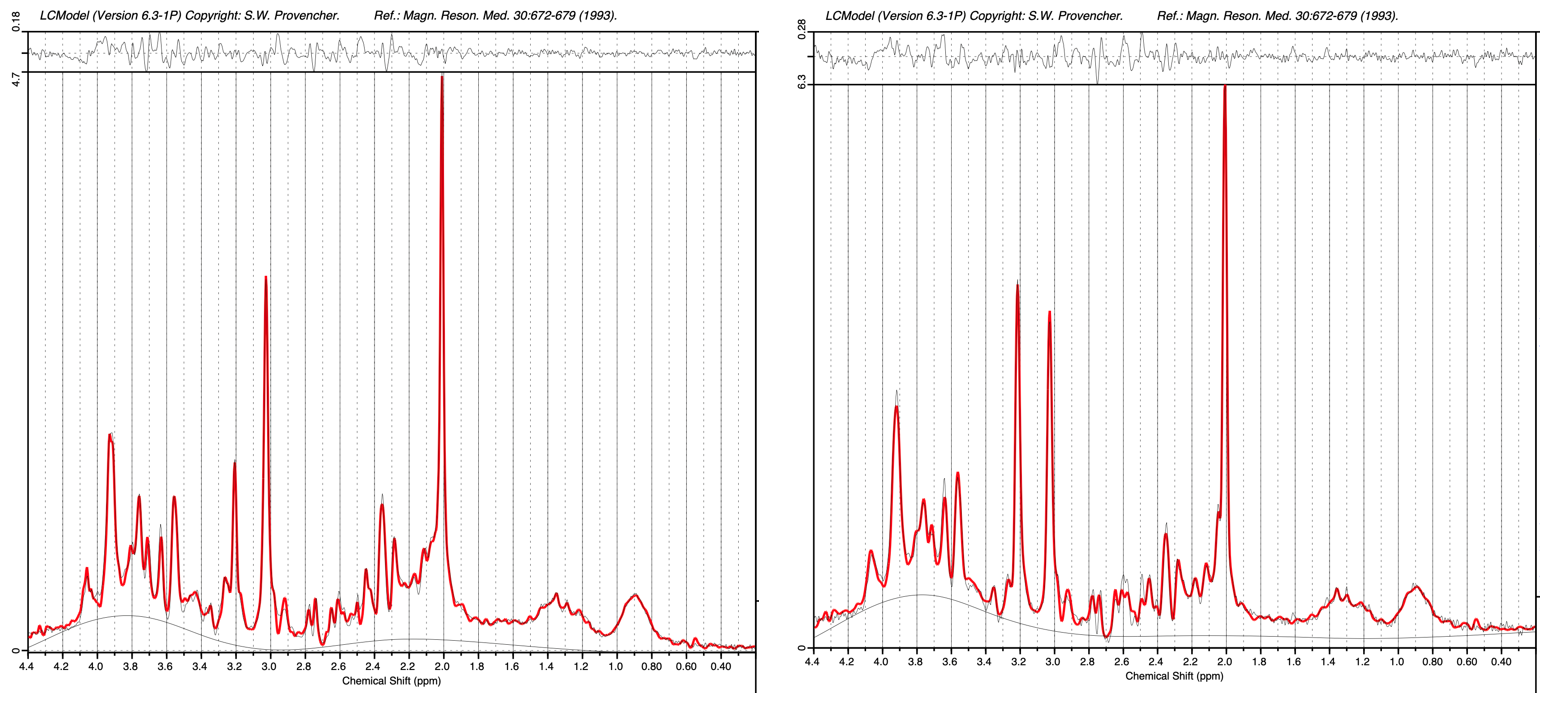
Figure 2. Putative grey matter
(left)
and white matter (right) PSALM spectra for subjects between 5-18 years of age
with a secondary analysis using LCModel.
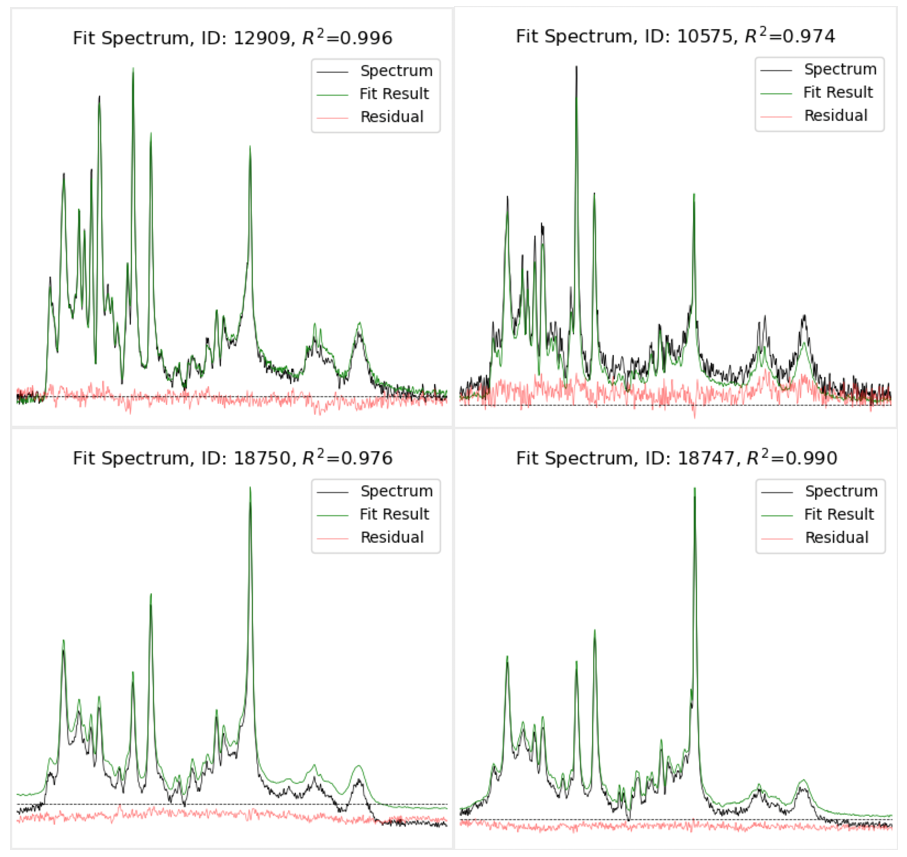
Figure 3. In vivo spectra
of mostly grey matter (left) and mostly white matter (right) in a
4-day-old newborn
(top) and 28-year-old
male
(bottom), each fit with two basis spectra (5 fit parameters)
optimized for the age group. Note that the residual is primarily
random
noise added to a signal offset/baseline. Thus, the majority of unexplained
variance
is due to signal offsets/baselines and not poorly-fit metabolites.
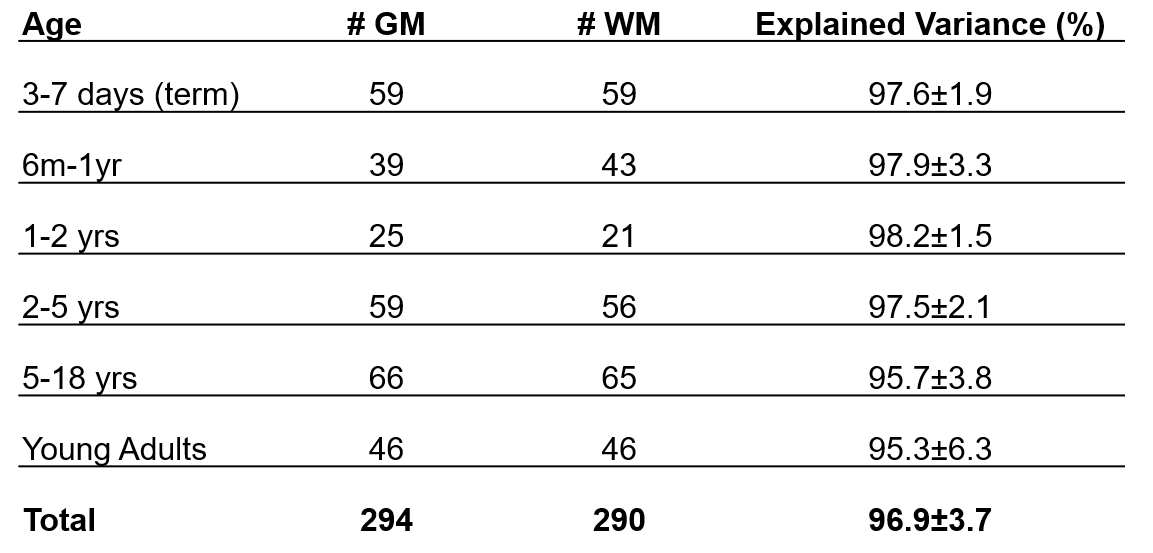
Table 1. For each age group, the number of
grey and white
matter spectra used to calculate PSALM bases is shown. The explained
variance was calculated when using each set of PSALM bases to fit the spectra
(mean ± standard deviation).
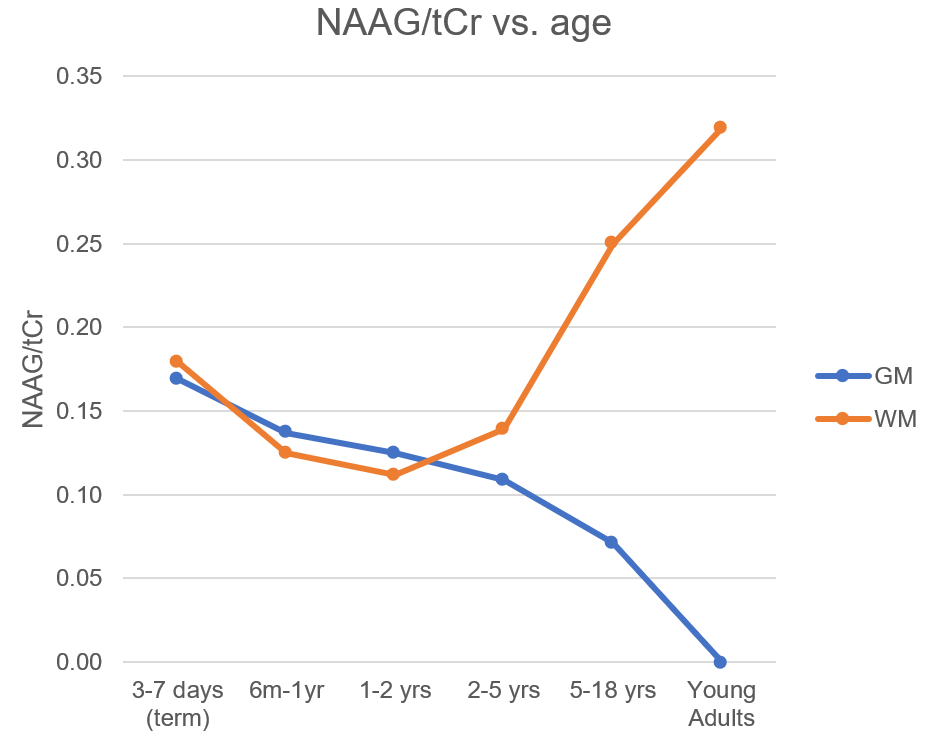
Figure 4. N-acetyl
aspartyl glutamate (NAAG) can be observed as a shoulder of the N-acetyl
aspartate (NAA) peak
only in spectra of the highest quality. A secondary analysis of PSALM spectra
with LCModel
demonstrates that, relative to total creatine (tCr), NAAG
is present at approximately equal levels in grey matter and white matter at
early brain development, diverges during childhood, and is detectable in the
adult brain only in white matter.
DOI: https://doi.org/10.58530/2022/4835