4833
Development of high resolution PD-weighted, T2-weighted, and T2 map templates for use in studies on older adults.1Department of Biomedical Engineering, Illinois Institute of Technology, Chicago, IL, United States, 2Rush Alzheimer's Disease Center, Rush University Medical Center, Chicago, IL, United States
Synopsis
Atlas based MRI investigations involving PD-weighted (PDw), T2-weighted (T2w) MRI sequences on older adults typically utilized younger adult templates such as those of the ICBM. Additionally, a thorough quantitative assessment of how available standardized PDw and T2w templates perform on aging population has not yet been performed. Here a new standardized high resolution PDw, T2w and T2 map templates of the MIITRA atlas dedicated for studies on older adults was developed using concepts of super-resolution and sparse-representation and compared to other available standardized templates in terms of image quality, inter-subject spatial normalization accuracy and representativeness of the older adult brain.
Introduction
Atlas based MRI investigations involving PD-weighted, T2-weighted MRI sequences on older adults typically utilized younger adult templates such as those of the ICBM. However, a thorough quantitative assessment of the performance of available standardized PD-weighted and T2-weighted templates in studies of the aging brain has not been conducted. The purpose of this work was to construct standardized high-resolution PD-weighted, T2-weighted and T2 map templates of the older adult brain in the space of the MIITRA atlas using concepts of super-resolution, and to systematically evaluate their performance in comparison to other available templates in terms of image-quality and inter-subject spatial normalization accuracy.Methods
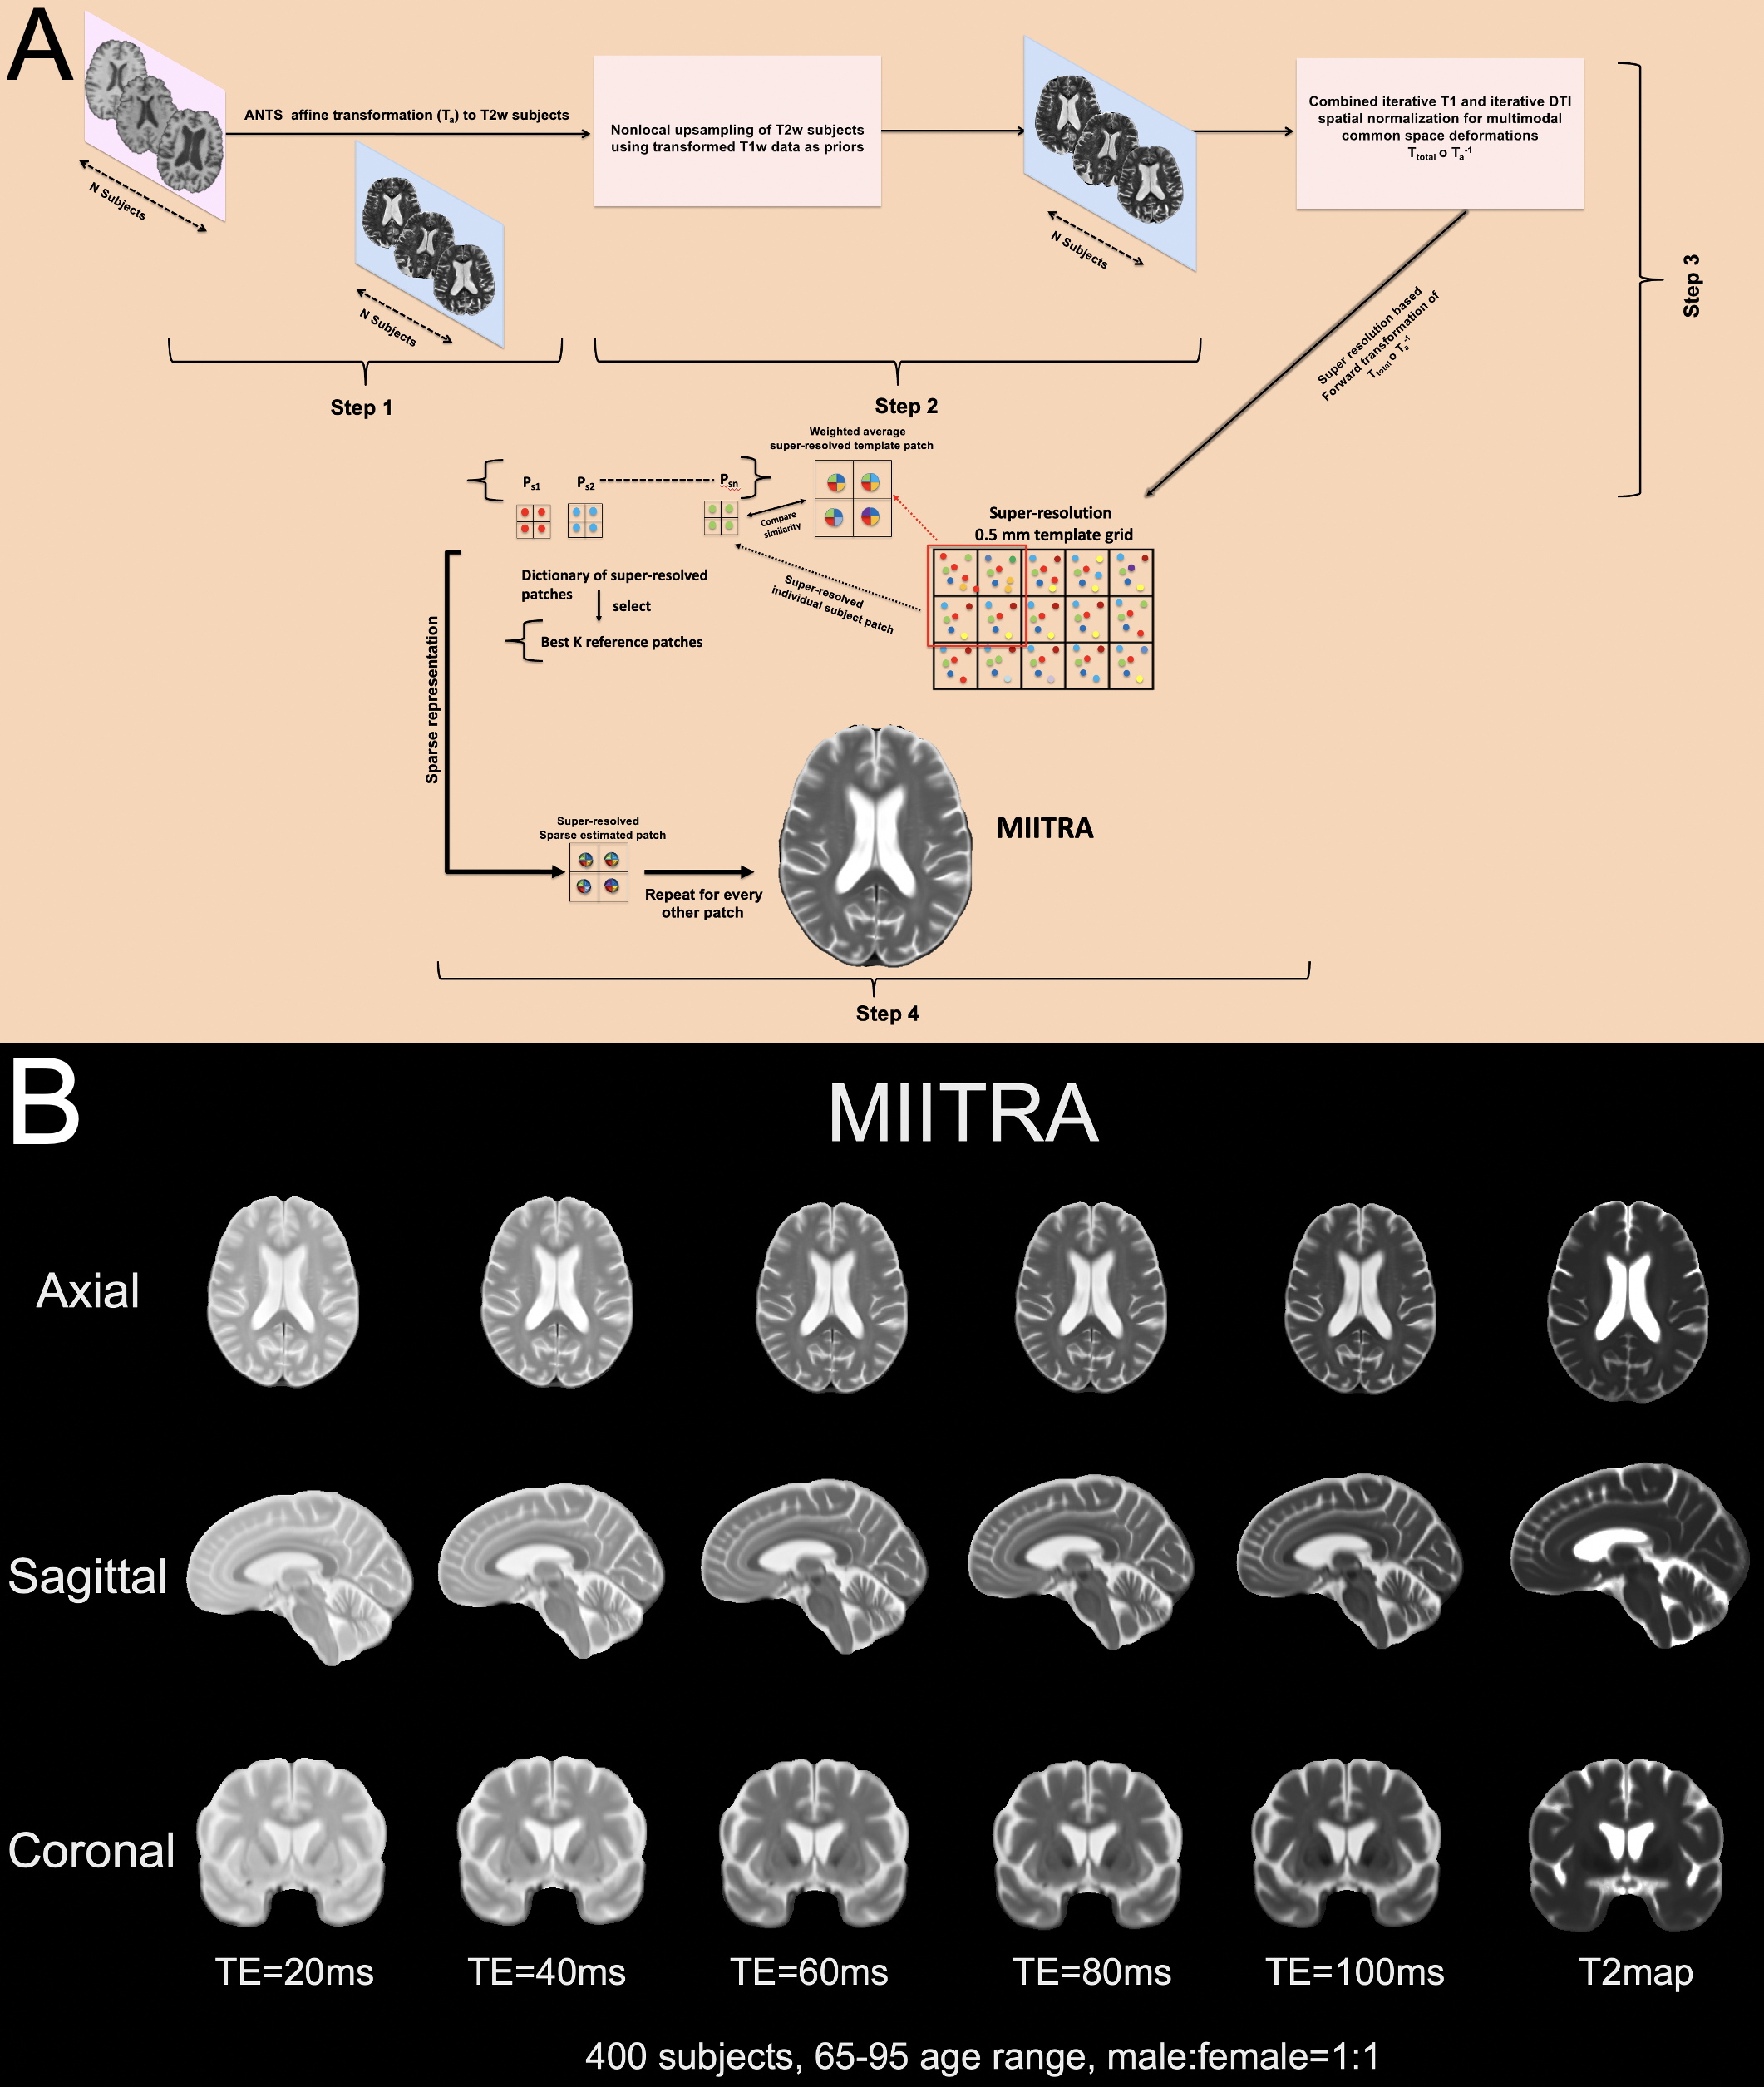
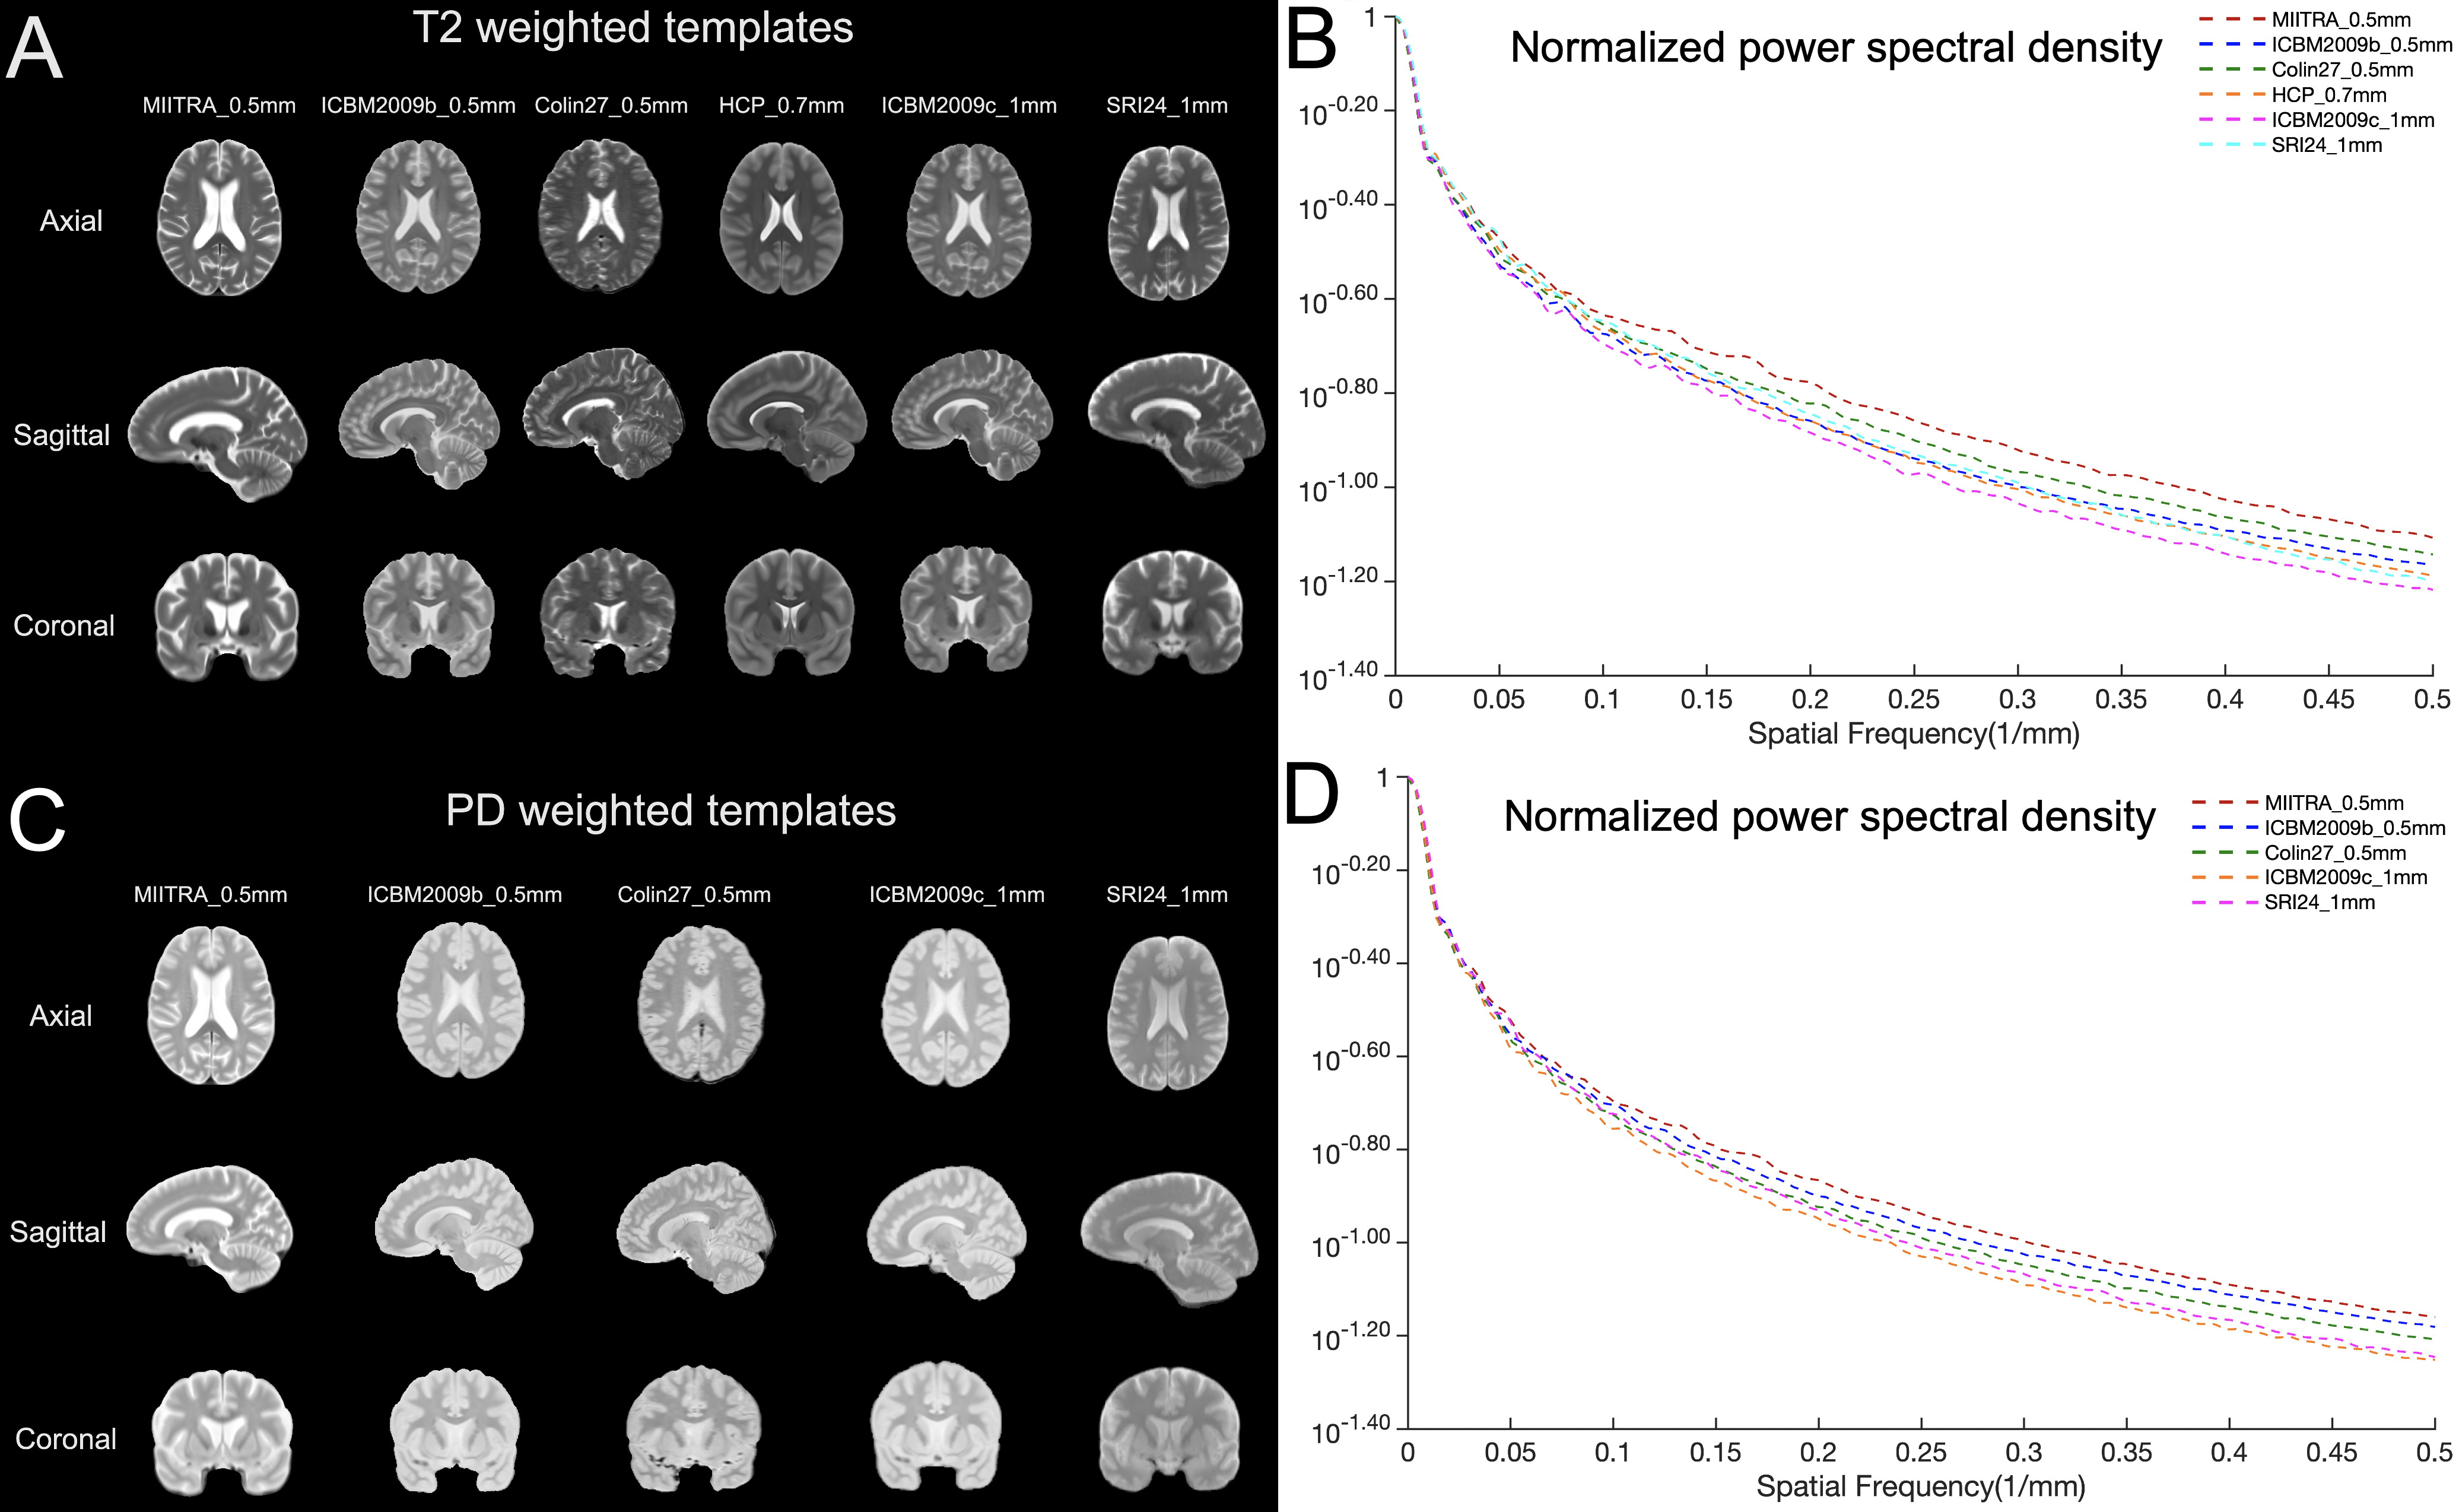
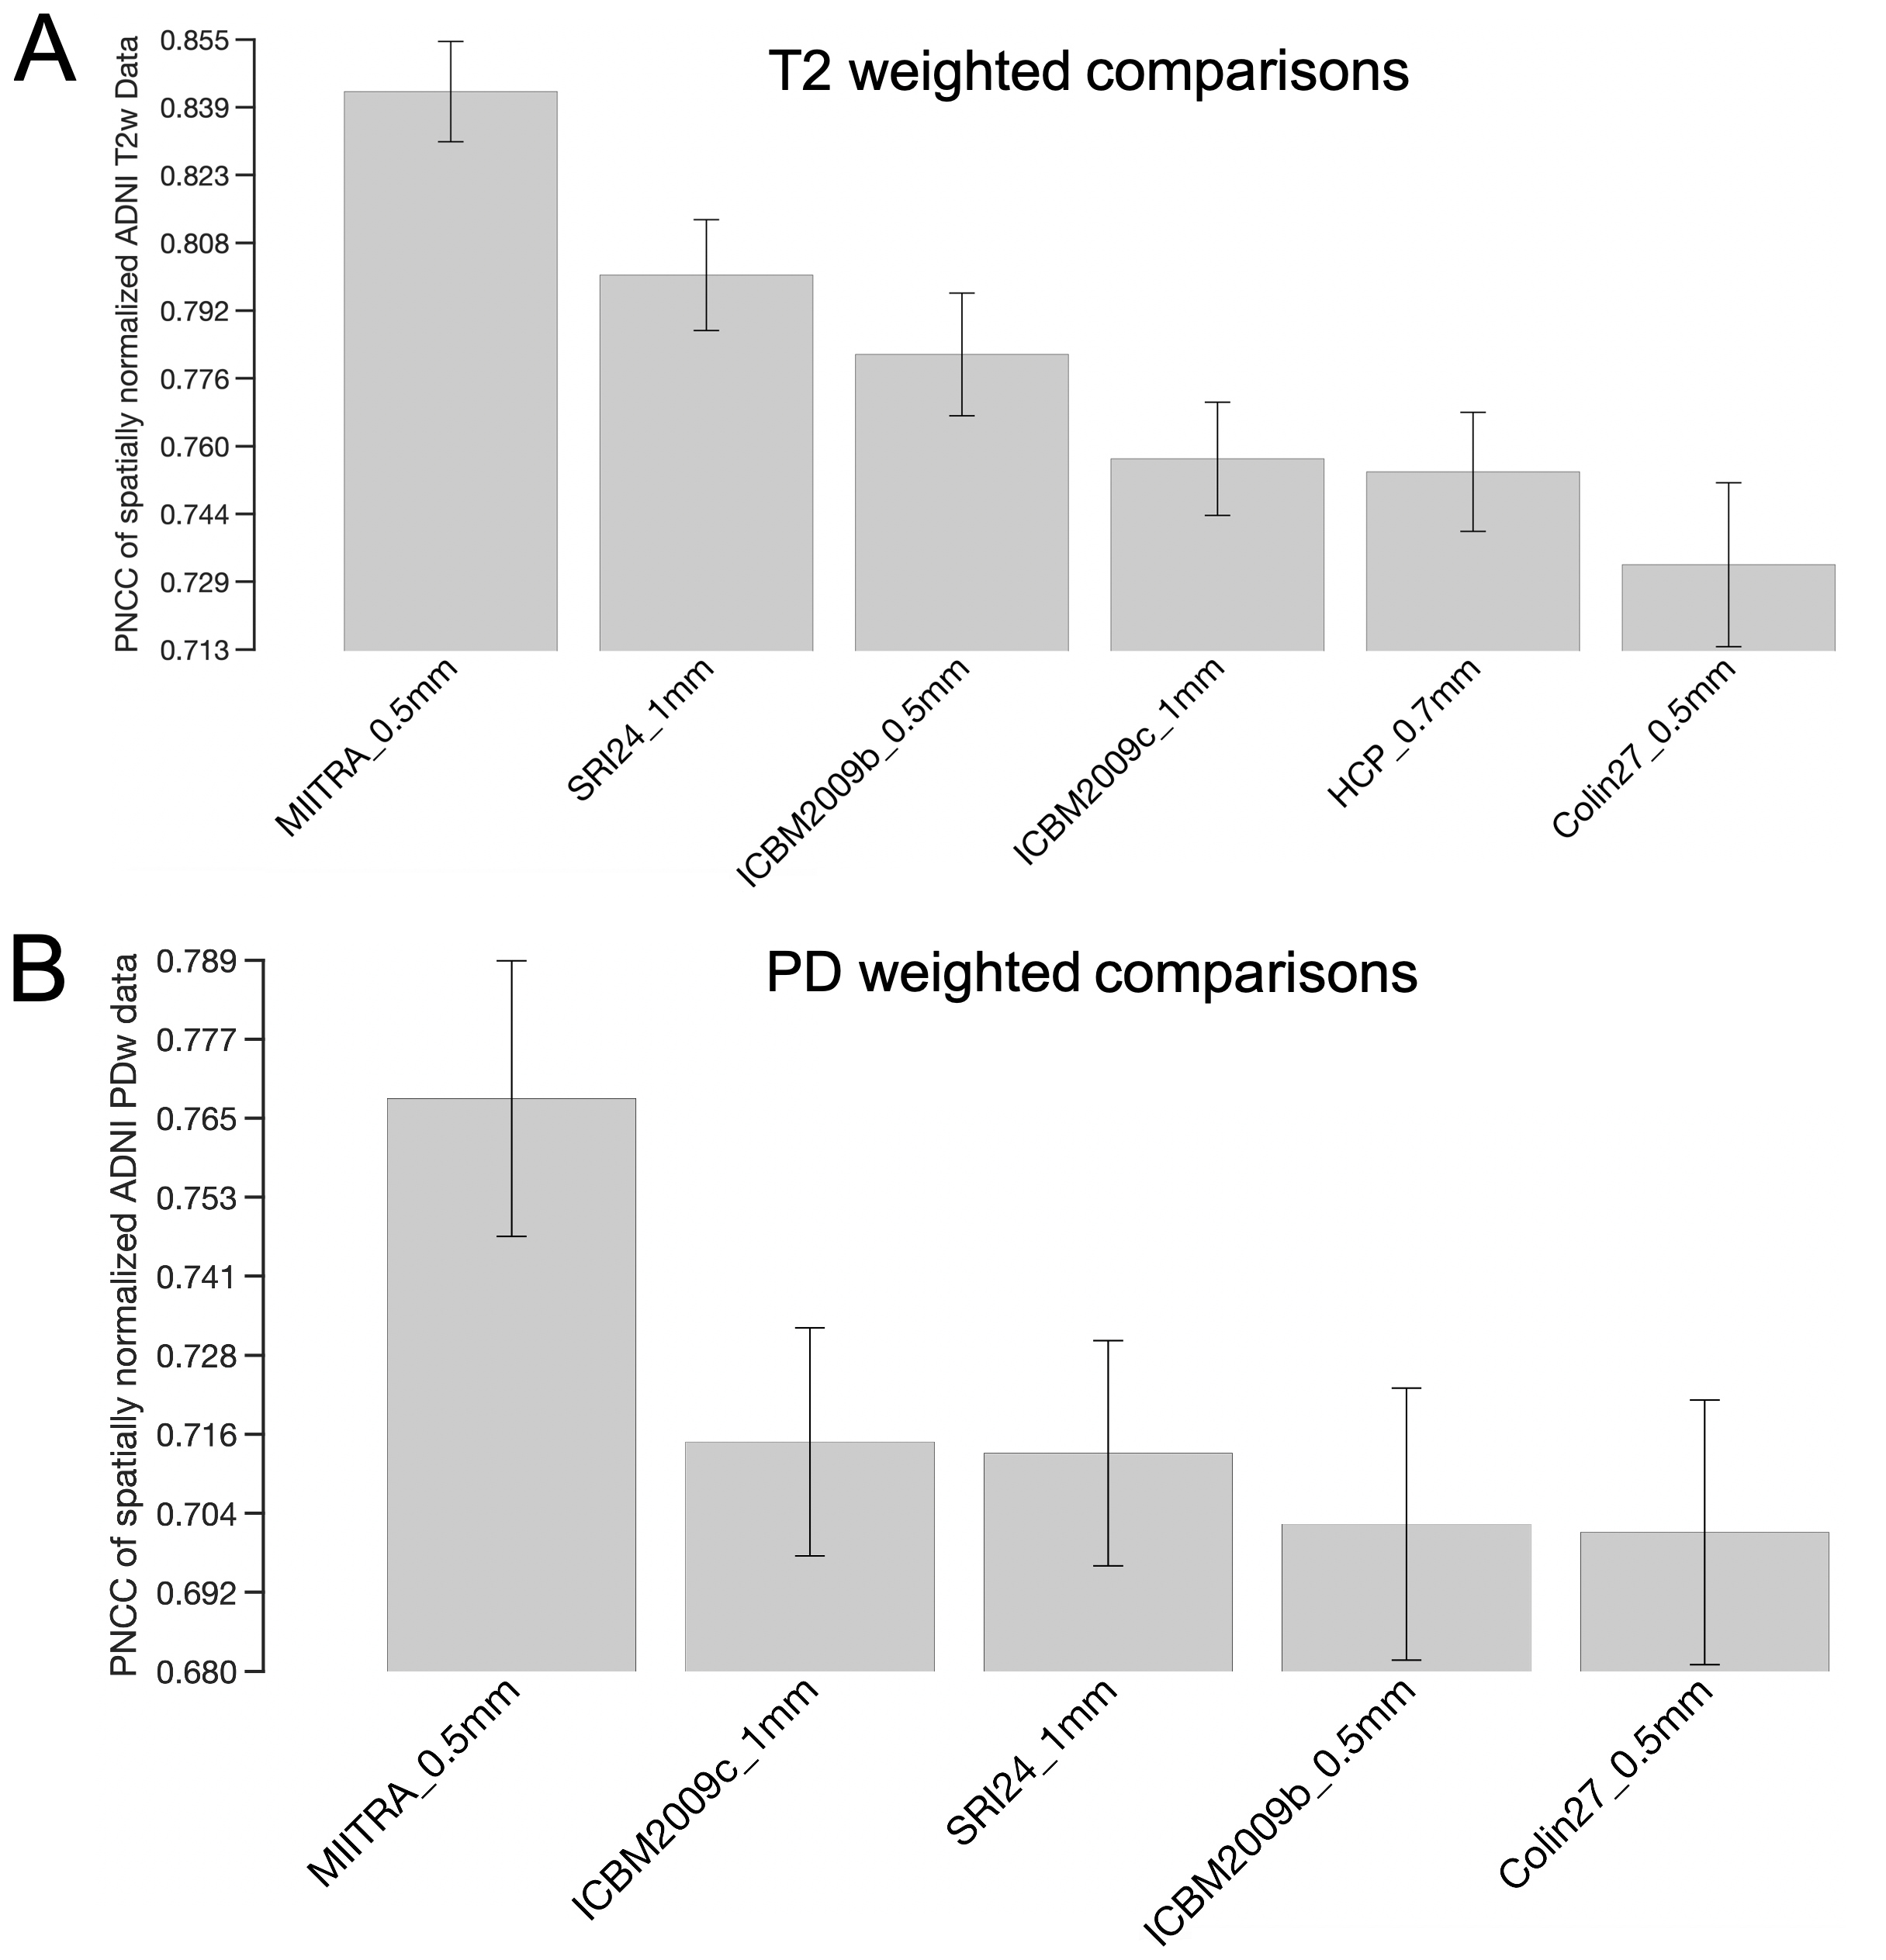
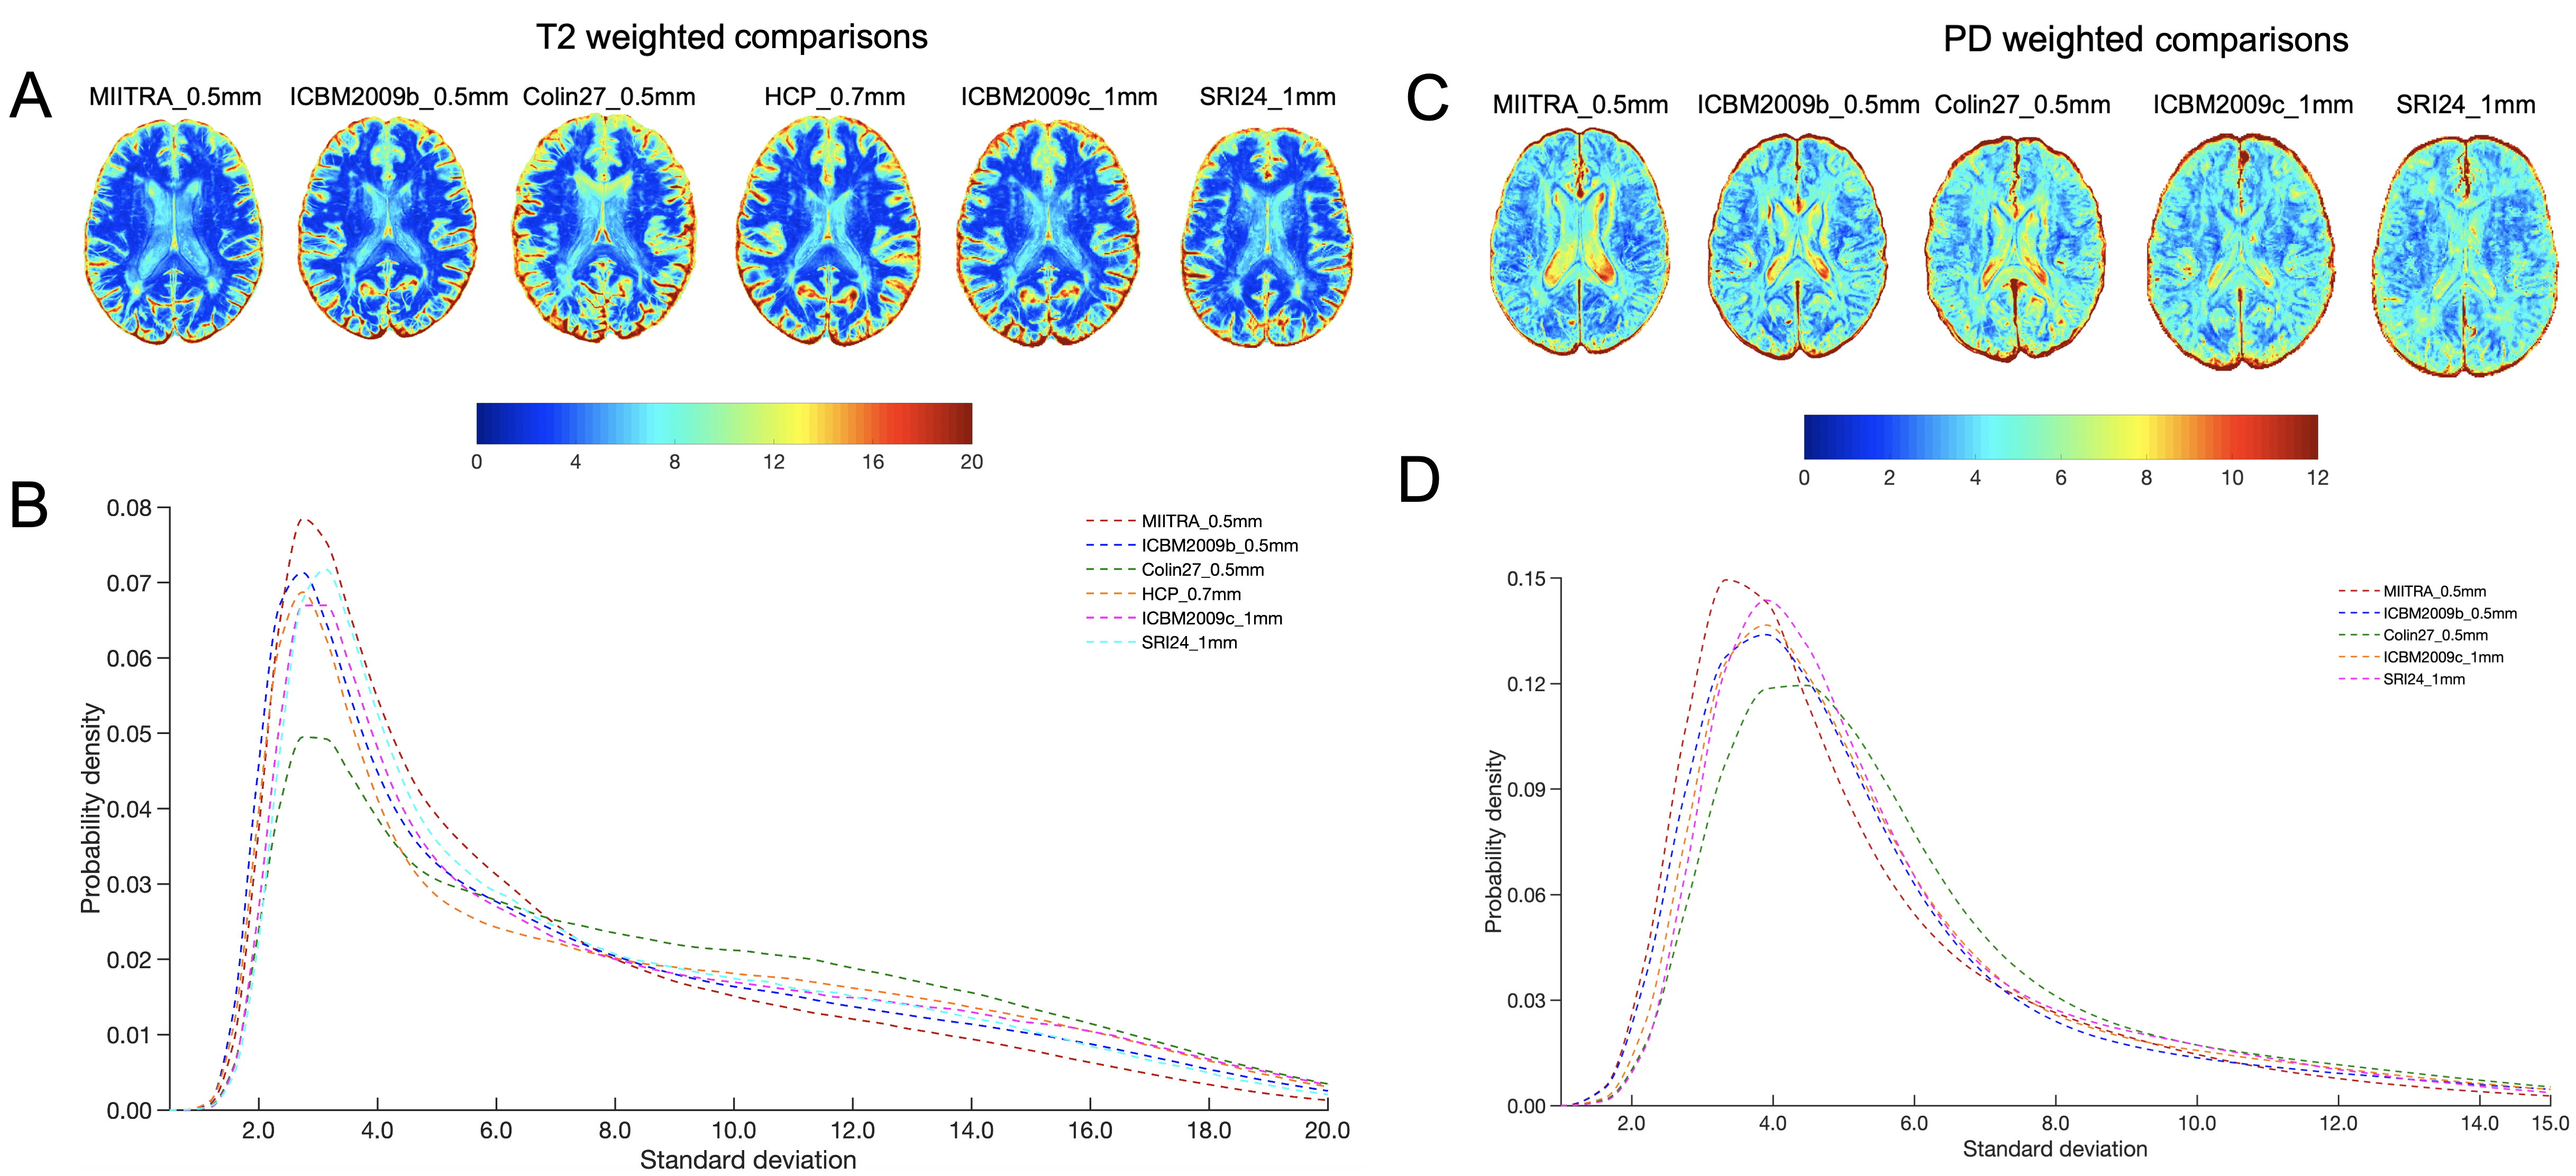
T2-weighted multi-echo spin-echo brain MRI (0.5mmx0.5mmx3mm isotropic, TE=20,40,60,80,100ms) and its corresponding T1-weighted (isotropic 1mm) data obtained from the 400 non demented older adults (65-95 age range, male:female=1:1) participating in the construction of the MIITRA atlas were used in this work1,2. Additionally, subject T2 maps were constructed by fitting the T2 decay equation. The template construction scheme comprised of:Step 1 & 2: T1-weighted data were affinely transformed to corresponding T2-weighted sequences, and used as priors to reconstruct high resolution voxels of T2-weighted data (isotropic 0.5mm) utilizing nonlocal super-resolution upsampling algorithm14. Step 3: Combined iterative T1-weighted and DTI spatial normalization based transformations9,13 were utilized to map each of the five echo (TE=20,40,60,80,100ms) of T2-weighted data separately on a super-resolution grid11.Step 4: Patch-based sparse representation data fusion approach12 on super-resolved subject patches were performed to finally construct our T2-weighted templates for each of the five echo times of the MIITRA atlas separately. (Fig.1).The first echo PD-weighted and the third echo T2-weighted templates (TE=60ms) were compared to other templates of i) young adults (HCP_0.7mm3, ICBM2009b_0.5mm4 , ICBM2009c5 and Colin27_0.5mm6) and ii) mainly younger adult and older adults (SRI247). The templates were first compared by visual inspection, and then in terms of image sharpness as demonstrated by the normalized power spectral density, and intersubject spatial normalization accuracy8 achieved when used as references for normalization10 of 30 ADNI PD-weighted and T2-weighted participants. Normalization accuracy was assessed for each template by means of the average pairwise normalized cross correlation (PNCC), and average logJacobian determinants of the ADNI participants8.Results
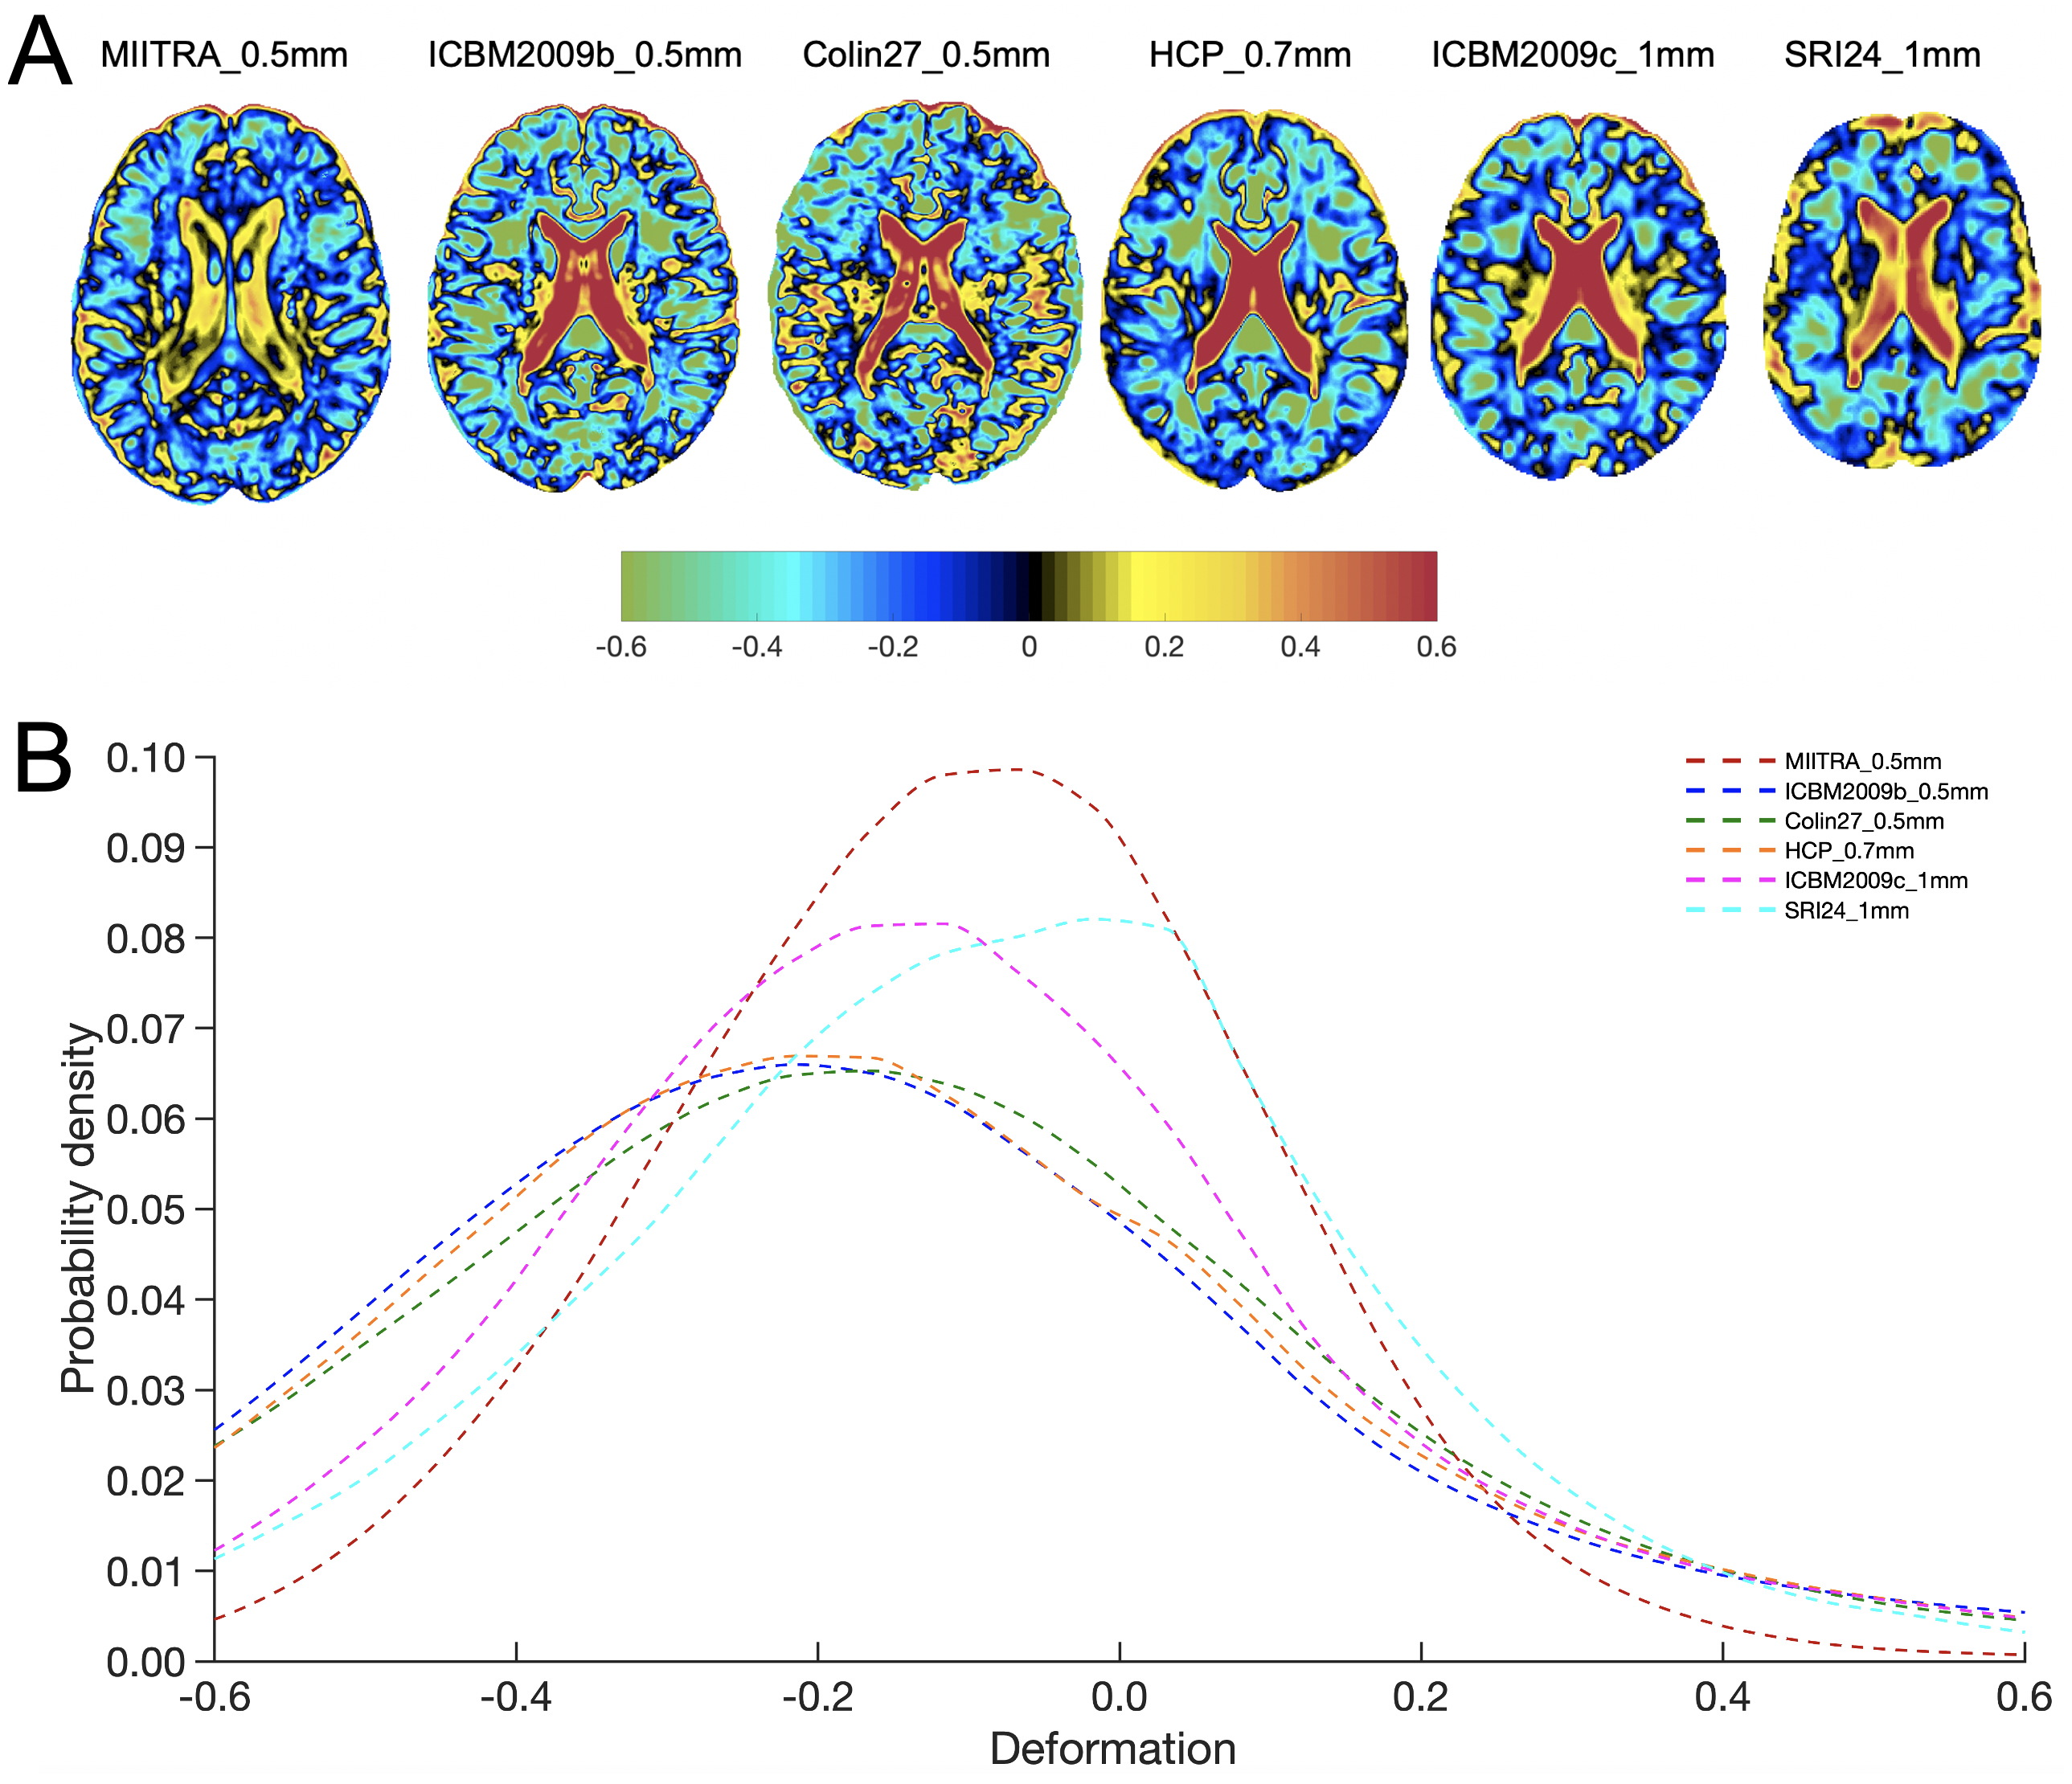
The new PD and T2 weighted templates of the MIITRA atlas demonstrated higher image sharpness compared to the other templates, as exhibited by larger high spatial frequency content in the normalized power spectra(Fig. 2A,B,C,D). Finally, the accuracy of inter-subject spatial normalization was higher when using the new templates compared to the other templates (Fig.3,4). The new templates required the least spatial deformation for normalizing ADNI data (Fig.5A,B).Discussion
The MITRA PD-weighted and T2-weighted templates demonstrated high image quality, high sharpness, are free from structural discrepancies, and resolve fine brain structures. The new templates also provided higher spatial normalization accuracy and the least deformation of older adult ADNI data compared to all other standardized templates. This was mainly due to the use of older adult data for template construction and due to the template building approach.Conclusion
We conclude that the new PD-weighted and T2-weighted templates of the MIITRA atlas are characterized by superior image quality, require lower deformation and allow for higher spatial normalization accuracy for use in studies on older adults such as the ADNI datasets.Acknowledgements
This study was supported by:National Institute on Aging (NIA) R01AG052200National Institute on Aging (NIA) P30AG010161National Institute on Aging (NIA) P30AG072975 National Institute on Aging (NIA) R01AG017917National Institute on Aging (NIA) RF1AG022018National Institute on Aging (NIA) R01AG056405References
1. Bennett DA, Buchman AS, Boyle PA, et al. Religious Orders Study and Rush Memory and Aging Project. J Alzheimers Dis. 2018;64(s1):S161-S189.
2. Barnes LL, Shah RC, Aggarwal NT, et al. The Minority Aging Research Study: Ongoing Efforts to Obtain Brain Donation in African Americans without Dementia. Curr Alzheimer Res. 2012;9(6):734-745.
3. Glasser MF, Sotiropoulos SN, Wilson JA, et al. The minimal preprocessing pipelines for the Human Connectome Project. Neuroimage, 2013;80:105-124.
4. Fonov V. et al. Unbiased average age-appropriate atlases for pediatric studies. Neuroimage.2011;54(1):313-27.
5. Fonov VS, Evans AC, McKinstry RC, et al. Unbiased nonlinear average age-appropriate brain templates from birth to adulthood. NeuroImage. 2009(47):S102.
6. Aubert-Broche B, Evans AC, Collins DL, A new improved version of the realistic digital brain phantom. NeuroImage. 2006; 32(1):138–45.
7. Rohlfing T, Zahr NM, Sullivan EV, Pfefferbaum A. The SRI24 multichannel atlas of normal adult human brain structure. Hum Brain Mapp. 2010;31(5):798-819.
8. Ridwan AR, Niaz MR, Wu Y, et al. Development and evaluation of a high performance T1-weighted brain template for use in studies on older adults. Hum Brain Mapp. 2021;42:1758-1776.
9. Irfanoglu MO, Nayak A, Jenkins J, et al. DR-TAMAS: diffeomorphic registration for tensor accurate alignment of anatomical structures. Neuroimage. 2016;132:439–454.
10. Avants et al. ANTS: Open-Source Tools for Normalization And Neuroanatomy.
11. Niaz MR, Ridwan AR, Qi X, et al. Development and evaluation of a 0.5mm isotropic resolution structural template of the older adult brain. Proc. Intl. Soc. Mag. Reson. Med. 2019;27.
12. Ridwan AR, Wu Y, Niaz MR, et al. Construction of an unbiased high resolution and detail-preserving structural T1-weighted template for use in studies on older adults. Proc. Intl. Soc. Mag. Reson. Med. 2021; 29.
13. Wu Y, Ridwan AR, Qi X, et al. Development of High Quality T1w and DTI Templates of the Older Adult Brain in a Common Space. Proc. Intl. Soc. Mag. Reson. Med. 2019;27.
14. Manjón, J. V., Coupé, P., Buades, A., Collins, D. L., & Robles, M. MRI superresolution using self-similarity and image priors. International Journal of Biomedical Imaging, 2010.
Figures