4831
Gender Differences in Cell Volume Fraction (CVF) of Human Brains Measured by Quantitative Sodium MR Imaging1Center for Magnetic Resonance Research, University of Illinois at Chicago, Chicago, IL, United States
Synopsis
The cell volume fraction (CVF), derived from tissue sodium concentration as measured by quantitative sodium MR imaging, in the human brain is high (~0.82) and maintained with normal aging despite decreases in brain volume. The gender difference (females: 0.807±0.009; males: 0.827±0.011, p<0.001) is also maintained over normal aging. This difference is posited to reflect the energy saving from higher CVF required for the larger male brain with higher number of neurons and synapses compared to female brains.
INTRODUCTION
Despite popular studies in the past, gender differences in brain structure become not significant after correction for brain size according to a recent comprehensive meta-analysis1. Male brains are, on average, larger and therefore have more neurons and more synapses than female brains2-4. Cell volume fraction (CVF) is a structural parameter that is derived from the two-compartment model of tissue sodium concentration (TSC) measured by quantitative sodium MR imaging5. It has been reported that CVF is high (0.817±0.013) in a mixed gender population and remains constant with little biological variation with normal aging4. This is the first report of the gender difference in CVF in healthy volunteers across the adult age range (21-80 years).METHODS
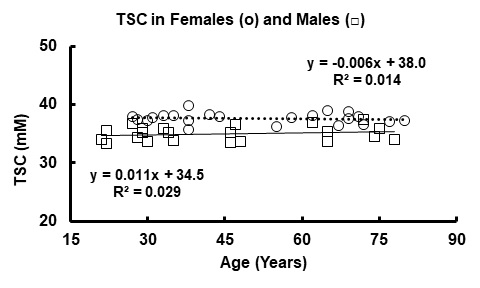
All human subjects provided informed signed consent for this protocol approved by the Food and Drug Administration and the Institutional Review Board. The normal volunteers (females: N=22, age = 51.3±18.0 years, range of 27 to 80 years; males: N=22, age 44.5±19.5, range 21 to 78 years) had at least college education and were active in their local communities. Subjects over 60 years had normal scores by mini mental status examination. The instrumentation and methods have been previously described5. Sodium MR imaging was performed at 9.4 Tesla. The customized high bandpass, quadrature birdcage radio frequency coil operated at the sodium frequency (105.8MHz). The quantitative sodium MR imaging protocol used the flexible twisted projection imaging sequence (radial fraction = 0.305, Kmax= 140.9, projections = 3760, acquisition window = 10.04ms, gradient = 5.47mT/m, slew rate = 150mT/m/ms, total acquisition time = 10:2 minutes for nominal isotropic resolution of 3.5mm)5. Corrections for B0 and B1 inhomogeneities were made but small. The spherical calibration phantom containing three cylindrical compartments with different sodium concentrations (30, 70 and 110mM sodium chloride in 3% agarose gel) imaged under the same imaging acquisition conditions following each human examination was used to calibrate the brain TSC maps5. The analysis used customized software as described previously5. The CVF maps were calculated voxel-wise from the TSC maps using the two-compartment model where: CVF = (TSC -C2)/(C1 – C2) and C1 and C2 are the intracellular and extracellular concentrations of sodium ions taken from the literature as 12mM and 145mM, respectively. The TSC maps were analyzed by region of interest analysis across the 8 regions of the brain (frontal, parietal, temporal, occipital, basal ganglia, thalamus, brainstem, cerebellum) setting a threshold range for TSC of ±two standard deviations from the mean to include all voxels in this range to avoid contamination from cerebrospinal fluid. Descriptive statistics (mean, standard deviation, number of voxels) of TSC of each region were plotted and tabulated for statistical comparison of female and male groups by linear regression with age (Figure 1 and 2, respectively) and by two-tailed student t-tests (p<0.01) (Tables 1 and 2, respectively).RESULTS
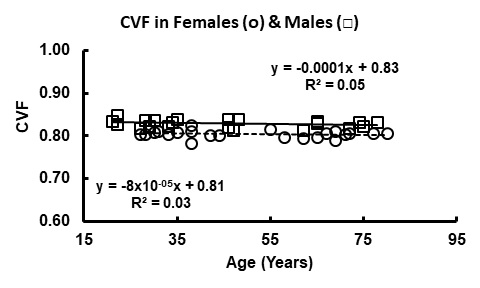
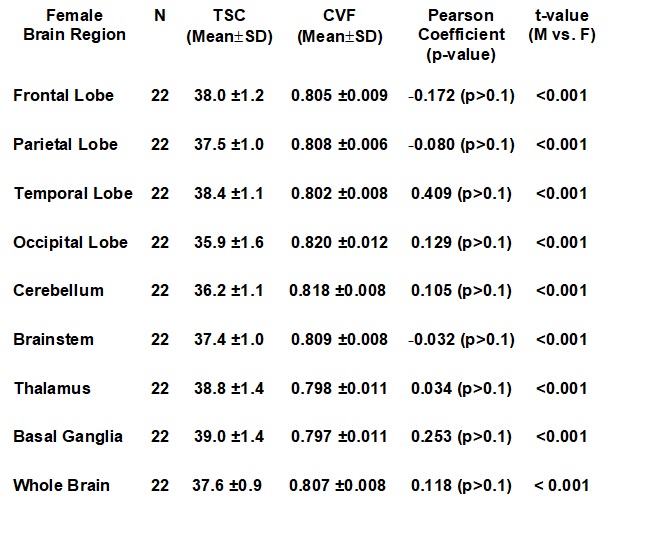
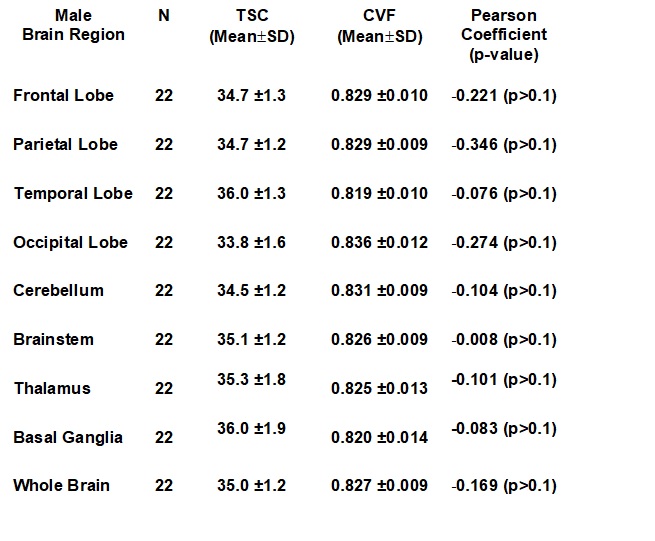
Figures 1 and 2 illustrate the linear regressions in TSC and CVF, respectively, for whole brain in females and males across the adult age range with females showing a higher TSC (females: 37.6±0.2mM; males: 35.0±0.5mM, p<0.001) and therefore lower CVF (females: 0.807±0.009; Males:0.827±0.011. p<0.001). The mean CVF and TSC values for each of the eight regions of interest and whole brain are tabulated in Table 1 for females and Table 2 for males. All 8 regions of the brain show statistically significant (p<0.001) lower TSC and higher CVF for males compared to females. After correction for brain volume, the gender difference was maintained. The Cohen effect size was greater than 1 indicating that the null hypothesis must be rejected. Figures 1 and 2 illustrate the linear regressions in TSC and CVF, respectively, for whole brain in females and males across the adult age range with females showing a higher TSC (females: 37.6±0.2mM; males: 35.0±0.5mM, p<0.001) and therefore lower CVF (females: 0.807±0.009; Males:0.827±0.011. p<0.001). The mean CVF and TSC values for each of the eight regions of interest and whole brain are tabulated in Table 1 for females and Table 2 for males. All 8 regions of the brain show statistically significant (p<0.001) lower TSC and higher CVF for males compared to females. After correction for brain volume, the gender difference was maintained. The Cohen effect size was greater than 1 indicating that the null hypothesis must be rejected.DISCUSSION
The gender differences in TSC and CVF are maintained across adult age range during healthy aging. The significance of this difference can be speculated on using the biophysical model presented in Abstract 213 where higher CVF provides greater efficiency in maintaining and restoring the resting membrane potential. This sodium-potassium exchange process consumes over half of the energy of the brain. The small increase in CVF of the larger male brains may support the greater number of synapses and larger number of neurons in the male brain by providing a strategy to improve energy efficiency in tissue operating close to its maximum metabolic capacity6,7.CONCLUSION
CVF is an important structural parameter of the brain, stable across normal aging, with statistically higher values in males compared to females (females: 0.807±0.008; males: 0.827±0.009, p<0.001, Cohen d=2.3). These high values of CVF are posited to maintain energy efficiency of the energy consuming sodium-potassium ion pumps by minimizing the number of ions to be exchanged (see abstract 213). The energy saving from the gender difference in CVF may support the energy budget of the larger male brain with more neurons and synapses than the female brain and have implications for diseases in which CVF changes7. Certainly, gender differences must be considered when CVF is being used to assess pathologies when CVF is changing8,9.Acknowledgements
The author acknowledges financial support from the NIH grants RO1 CA1295531A1 and NS3867601A1References
1. Eliot L, Ahmed A, Khan H, Patel J. Dump the “dimorphism”: Comprehensive synthesis of human brain studies reveals few male-female differences beyond size. Neuroscience & Biobehavioral Reviews 2021; 125:667-697.
2. Lotze M, Domin M, Gerlach FH, Gaser C, Lueders E, Schmidt CO, Neumann N. Novel findings from 2,838 Adult Brains on Sex Differences in Gray Matter Brain Volume. Sci Rep. 2019; 9(1):1671.
3. Ruigrok AN, Salimi-Khorshidi G, Lai MC, Baron-Cohen S, Lombardo MV, Tait RJ, Suckling J. A meta-analysis of sex differences in human brain structure. Neurosci Biobehav Rev. 2014; 39:34-50.
4. Ritchie SJ, Cox SR, Shen X, Lombardo MV, Reus LM, Alloza C, Harris MA, Alderson HL, Hunter S, Neilson E, Liewald DCM, Auyeung B, Whalley HC, Lawrie SM, Gale CR, Bastin ME, McIntosh AM, Deary IJ. Sex Differences in the Adult Human Brain: Evidence from 5216 UK Biobank Participants. Cereb Cortex. 2018; 28(8):2959-2975.
5.Thulborn KR, Lui E, Guntin J, Jamil S, Sun Z, Caliorne TC, Atkinson IC. Quantitative sodium MRI of the human brain at 9.4 T provides assessment of tissue sodium concentration and cell volume fraction during normal aging. NMR Biomed. 2016; 29(2):137-143.
6. Magistretti PJ, Allaman I. A cellular perspective on brain energy metabolism and functional imaging. Neuron 2015; 86:883-901.
7. Martínez-Pinilla E, Ordóñez C, del Valle E, Navarro A, Tolivia J. Regional and Gender Study of Neuronal Density in Brain during Aging and in Alzheimer's Disease. Front Aging Neurosci 2016; 8:213.
8. Wilson CS, Mongin AA. Cell volume control in healthy brain and neuropathologies. Curr Top Membr 2018; 81:385-455.
9. von Bartheld CS. Myths and truths about the cellular composition of the human brain: A review of influential concepts. J Chem Neuroanat. 2018;93:2-15.
Figures