4829
QSM as a Potential Treatment Efficacy Indicator for MR-HIFU-mediated Histotripsy1Department of Diagnostic and Interventional Radiology, Faculty of Medicine and University Hospital Cologne, University of Cologne, Cologne, Germany, 2Profound Medical Inc, Mississauga, ON, Canada, 3Department of Chemistry, Faculty of Mathematics and Natural Sciences, University of Cologne, Cologne, Germany
Synopsis
High intensity focused ultrasound-mediated histotripsy is a modality for targeted, non-invasive interventions. As temperature changes detected by MR-thermometry are not directly related to histotripsy treatment success, we propose quantitative susceptibility mapping (QSM) to evaluate and monitor treatment efficacy. Fresh porcine heart muscle tissue was sonicated using a clinical MR-HIFU system. Herein, we demonstrate the successful visualization of histotripsy-induced lesions by QSM.
INTRODUCTION:
High Intensity Focused Ultrasound (HIFU)-mediated histotripsy1,2 was first described about a decade ago. Since then, histotripsy has emerged as a potential modality for HIFU interventions that non-invasively deliver highly effective and localized cancer treatments with only little thermal damage to surrounding tissues. In contrast to thermal ablation, histotripsy destroys or emulsifies target tissue mechanically by the generation of small boiling bubbles and their interaction with subsequent acoustic shock waves, inducing immune reactions3. As thermal hot spots are generated only in very small volumes within milliseconds4, the heat deposition does not directly relate to treatment success. Hence, standard MR thermometry based on the Proton Resonance Frequency Shift (PRFS)5 effect is not as useful for treatment monitoring, as compared to thermal therapies. This work proposes an alternative method for post-treatment assessment and monitoring of histotripsy: Quantitative Susceptibility Mapping (QSM). Histotripsy induces bubble generation and tissue fragmentation2. This causes local aggregation of gas during therapy, and subsequently the release of cell content and homogenization of otherwise ordered tissue structures. These factors are likely to induce changes in the observed local magnetic susceptibility distribution, which depend on the tissue composition and properties.METHODS:
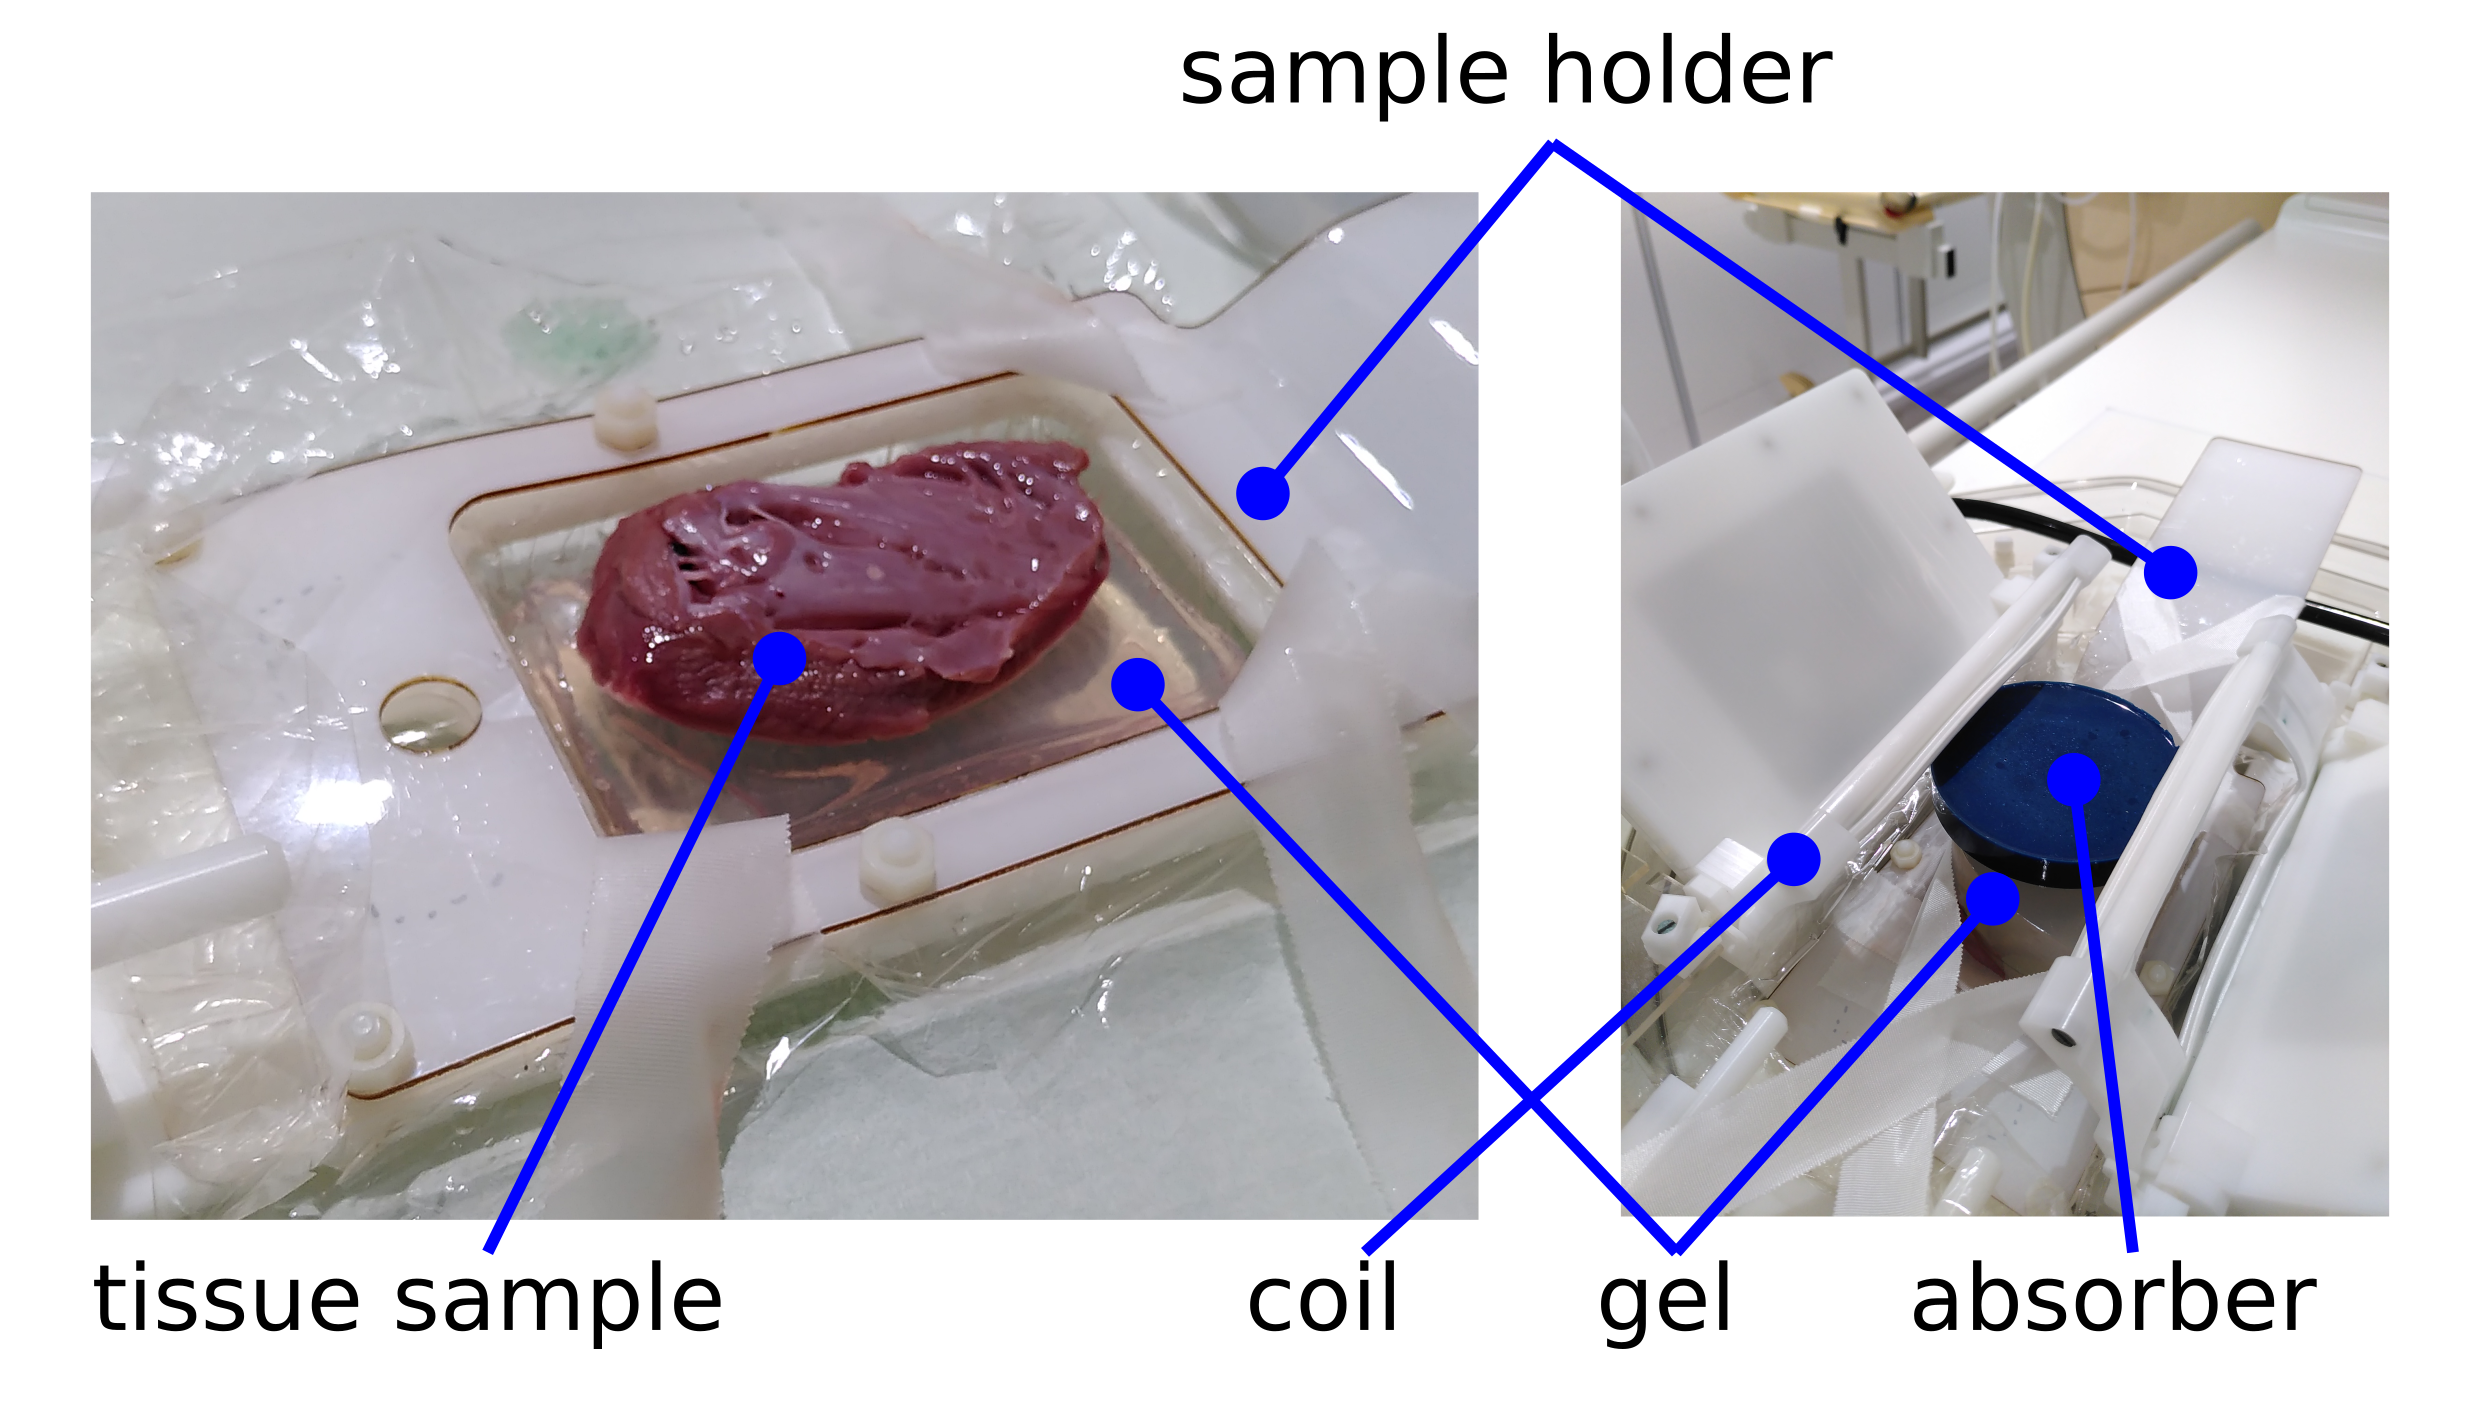
Setup: A clinical 3T MRI system (Philips Medical Systems, Best, the Netherlands) equipped with a clinical Sonalleve V2 MR-HIFU tabletop (Profound Medical) was used for all experiments. A dedicated setup for preclinical experiments was mounted on the HIFU tabletop. This setup included a four-channel preclinical receive-only coil for imaging and a holder to position the tissue specimens. Experiments were performed on freshly excised porcine heart muscle tissue. After excision the tissue was stored on ice for two hours before being positioned on the HIFU tabletop. For histotripsy, the sample was placed in degassed water on top of a gel block. A second gel block and an absorber were placed on top to avoid far field heat deposition within the sample. The setup is illustrated in Figure 1.MRI: The MRI protocol included a T1-weighted planning scan to position the HIFU transducer, a PRFS thermometry sequence (multishot-EPI gradient echo) and anatomic pre- and post-sonication 3D dual-echo spoiled gradient echo acquisitions to record B0 changes (TE=[4.6, 9.2] ms, TR=14.1, FA=10°, BW=376Hz/pixel, 0.75mm isotropic resolution).
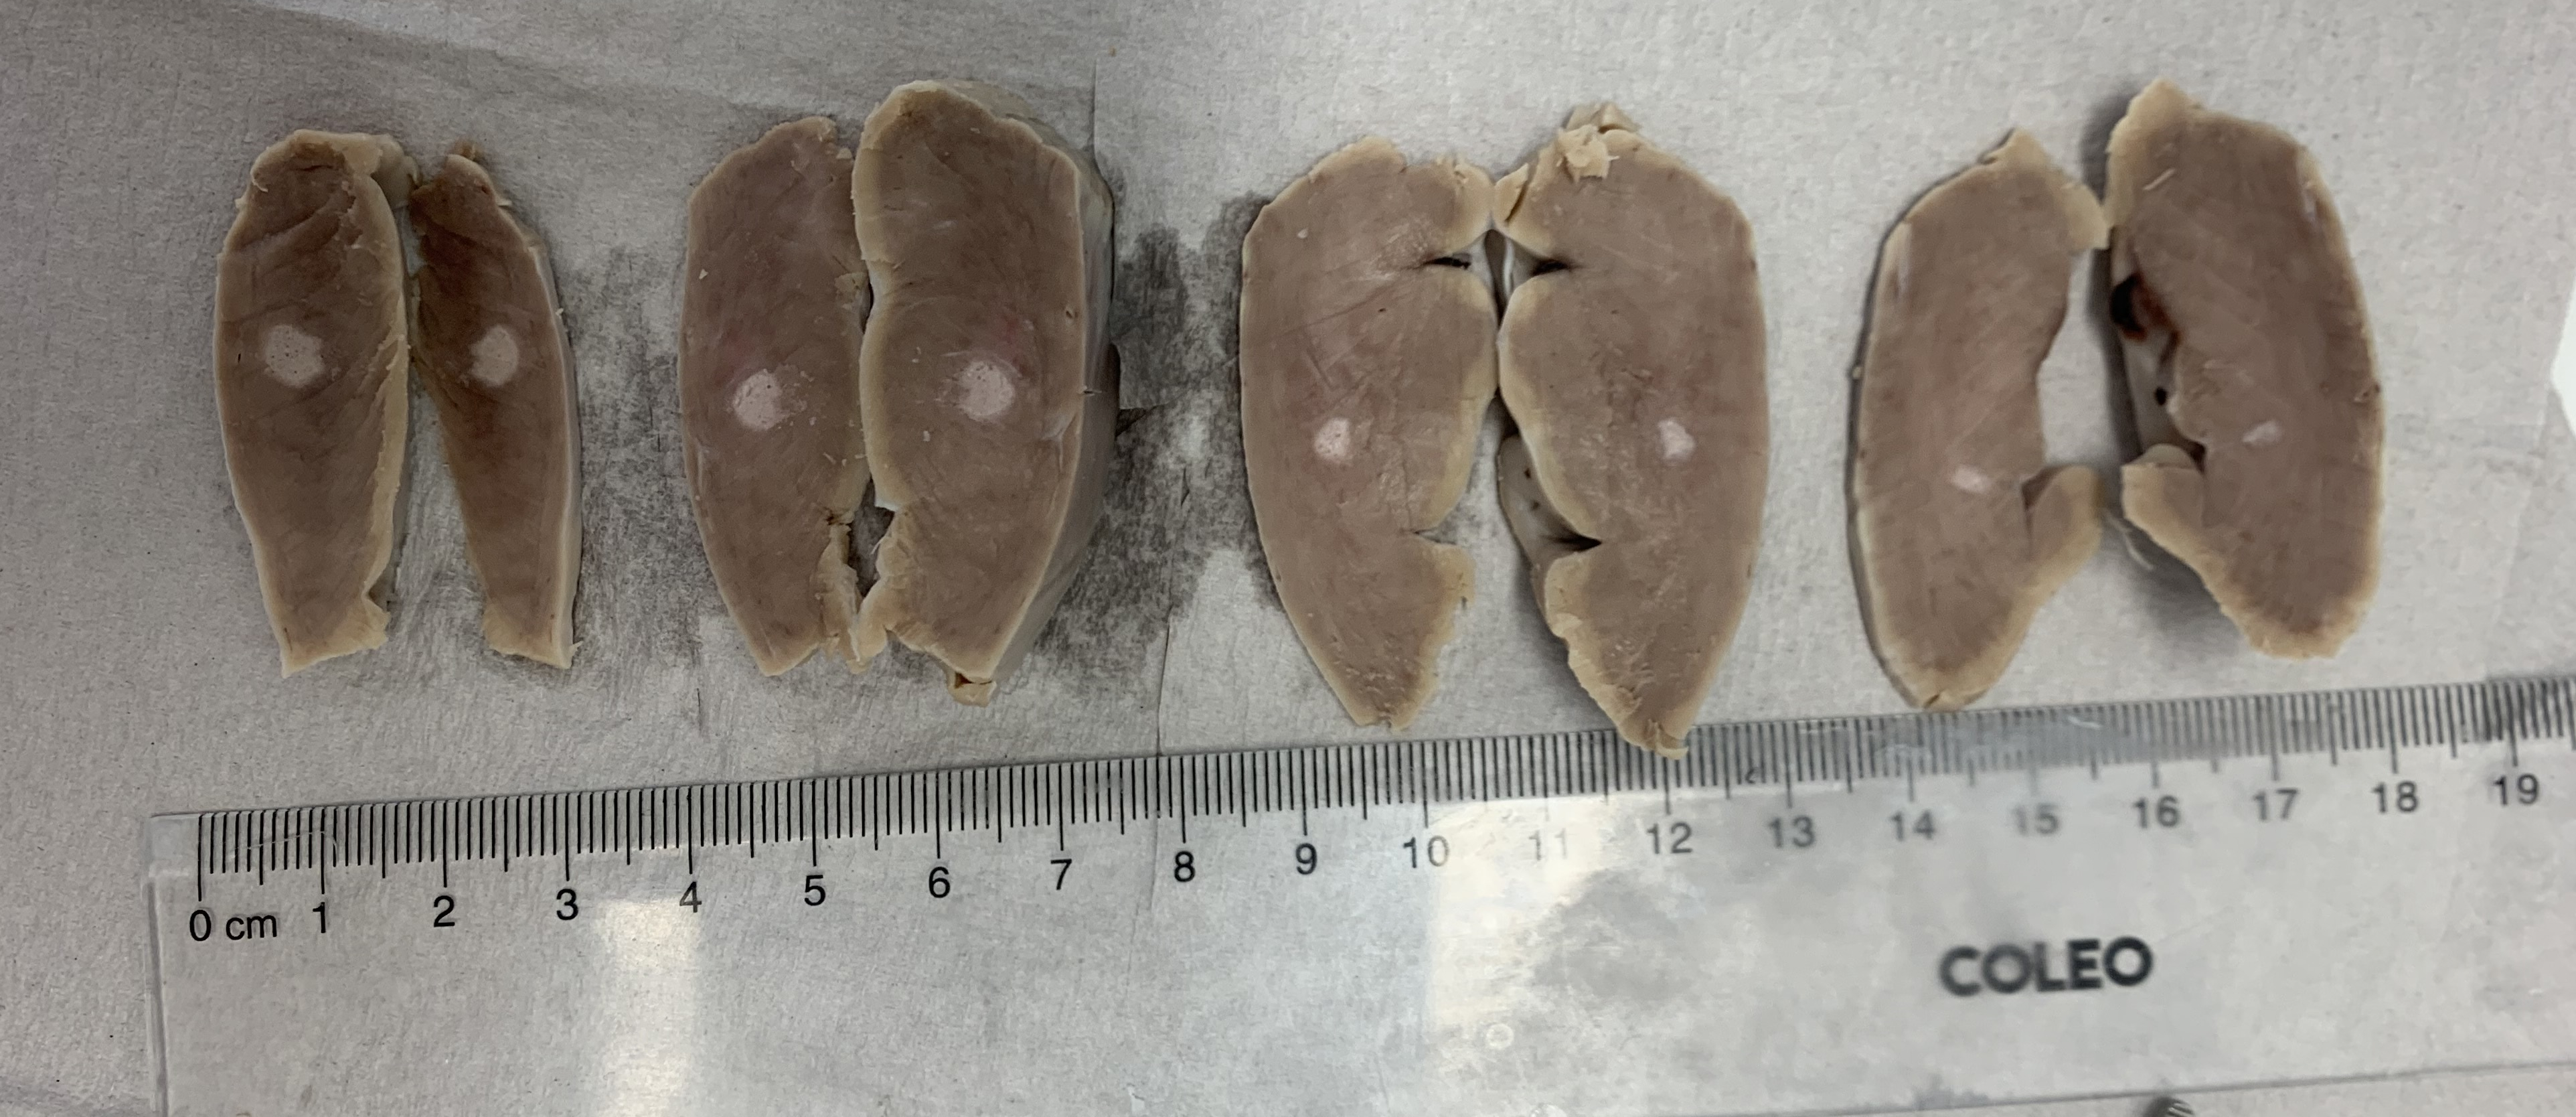
HIFU: Four different sonications with varying parameters were applied to the tissue sample. The parameters included 540W effective acoustic power, 10 000 to 18 000 cycles per pulse, pulse repetition frequencies between 1 and 4 Hz and sonication durations between 52 and 350 seconds. The samples were placed in formalin after the end of the experiment and were sliced along the lesions 14 days later.
Postprocessing: Based on the magnitude data of the 3D acquisition, data was pre-selected using a hard threshold. The phase difference between the second and the first echo of the 3D acquisitions was unwrapped using Laplacian unwrapping6. Background fields were removed using V-SHARP7 and the susceptibility distribution was reconstructed with STAR-QSM6. All steps were applied with STISuite 38.
RESULTS:
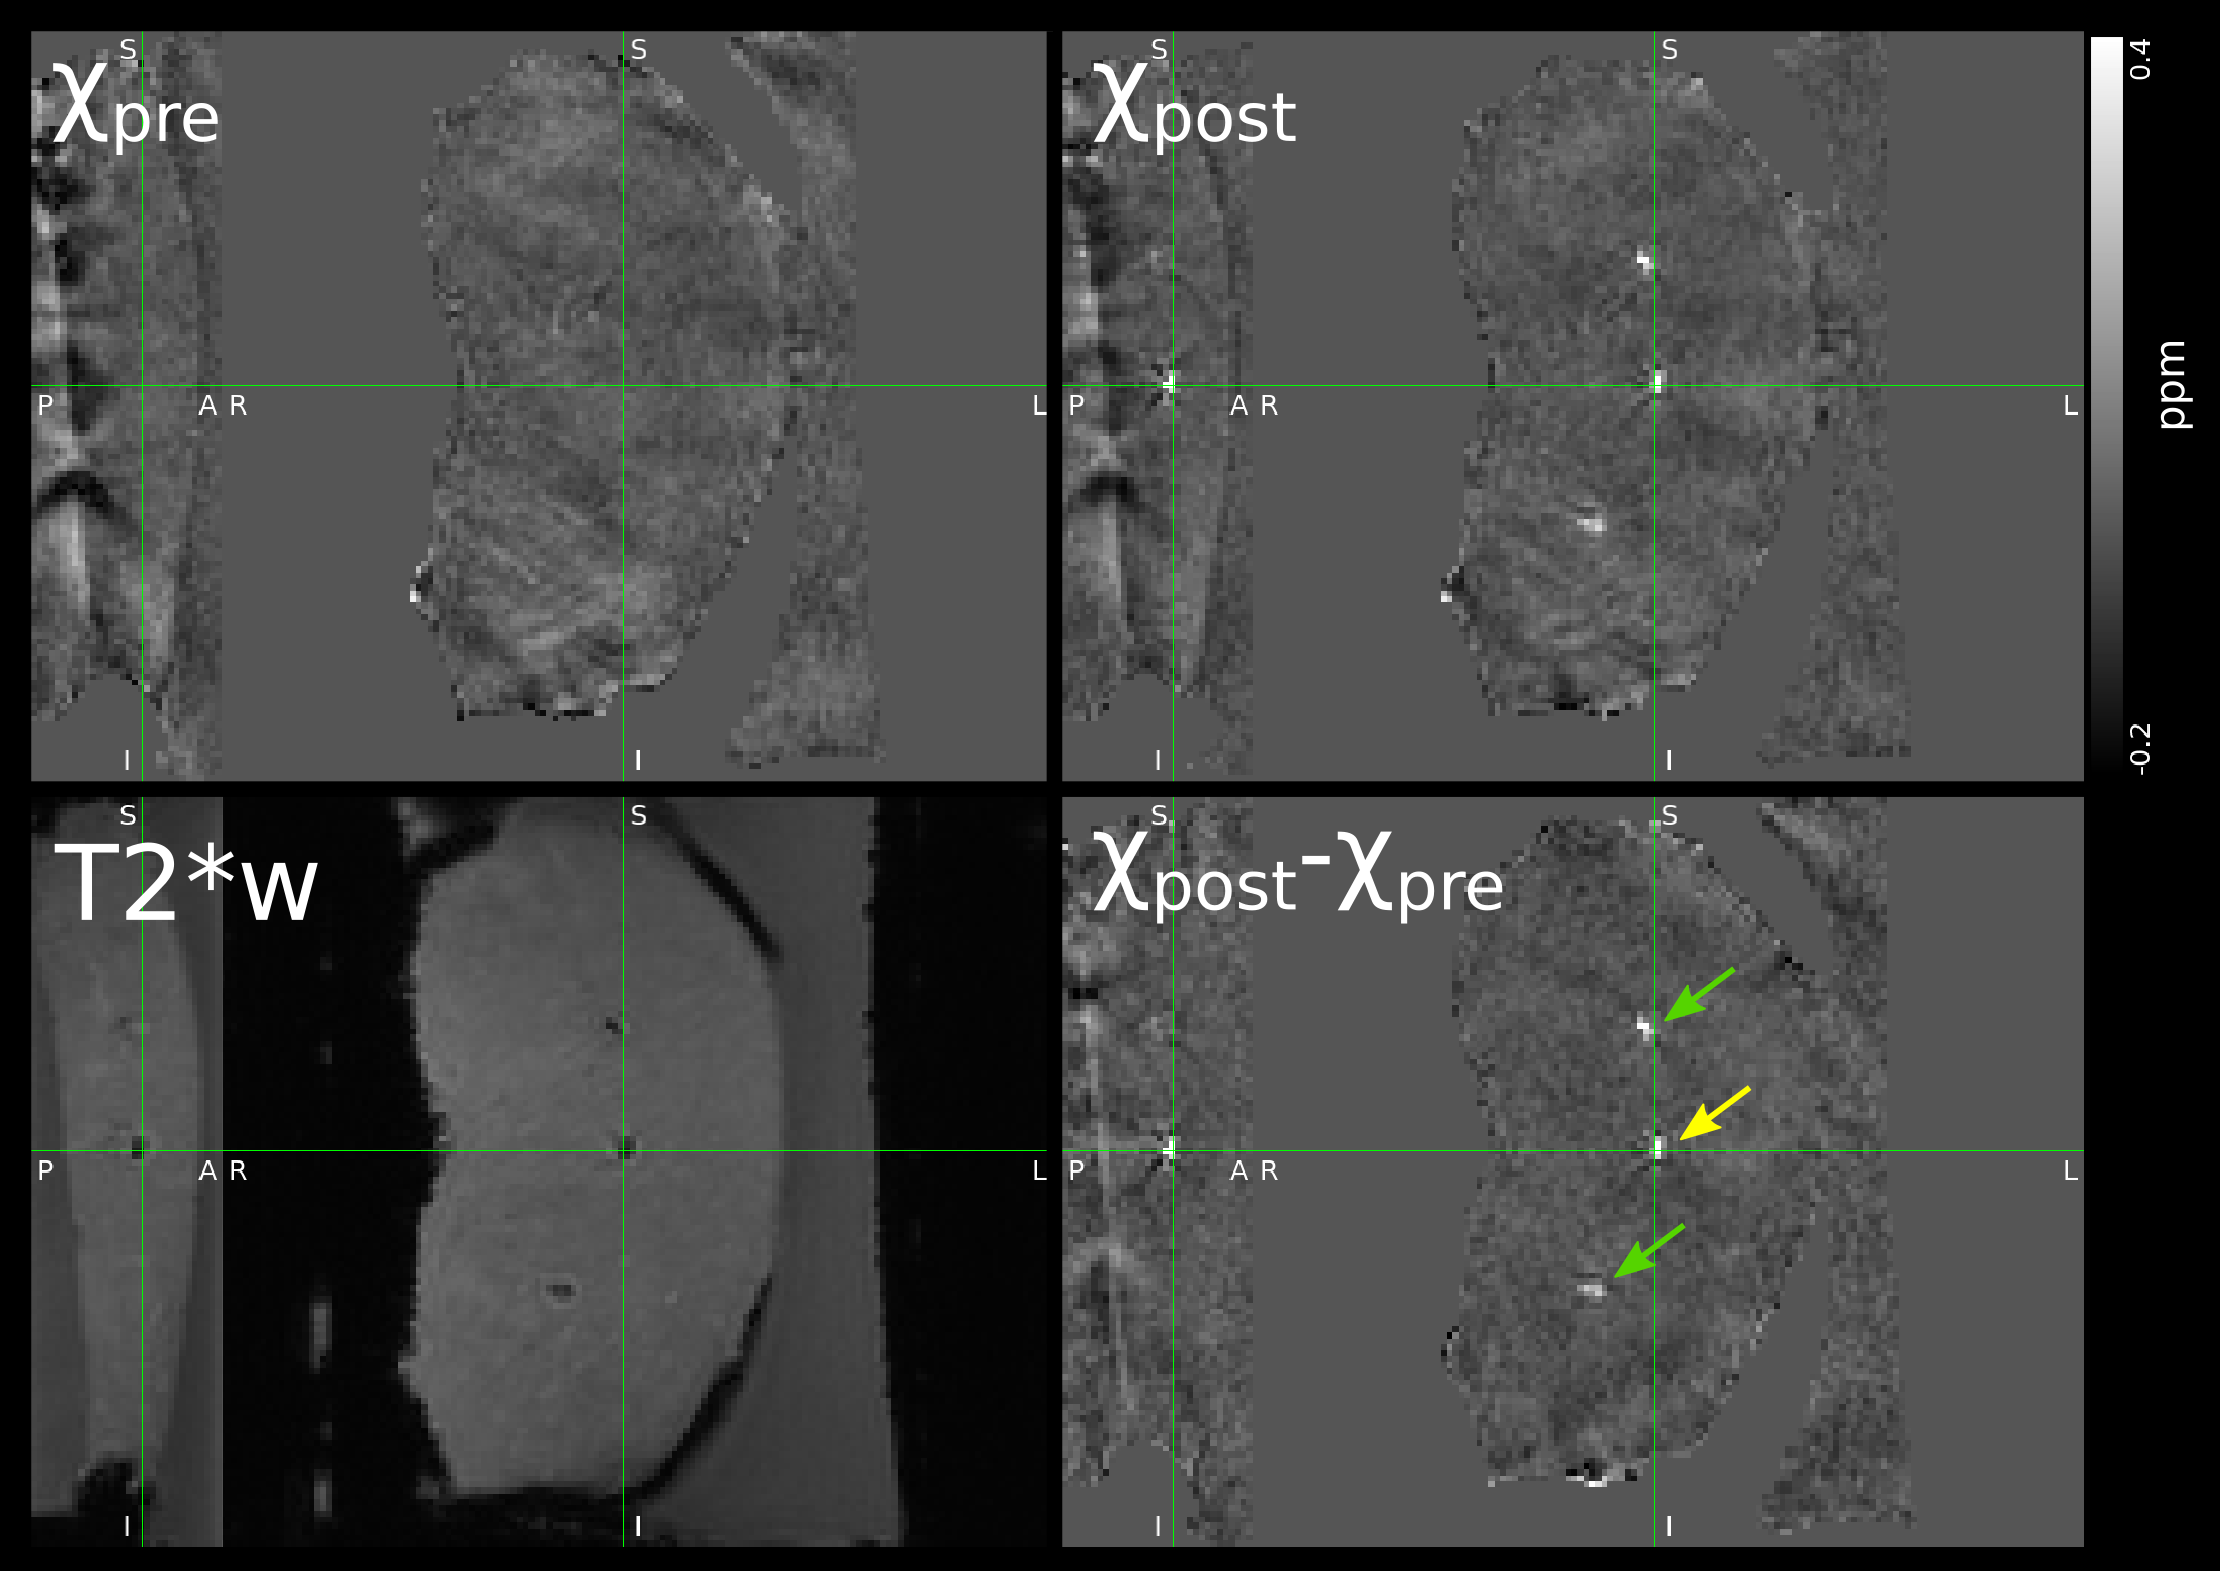
Post-sonication, the histotripsy lesions are clearly visible in the T2*-weighted magnitude image as displayed in Figure 2. The results of the QSM postprocessing are also shown in Figure 2, including a difference map of post- and pre-sonication maps, χpost and χpre. The lesions are clearly delineated and show a distinctly higher susceptibility value of up to 0.6 ppm compared to surrounding tissue. The fixated tissue slices exhibit the typical excavated nature of histotripsy lesions (Figure 3).DISCUSSION:
The lesion appearance in T2*-weighted images implies local field gradients, potentially originating in susceptibility contrast. This is confirmed by the QSM reconstruction, which would otherwise not produce clearly outlined contrast. With the strongly elevated susceptibility values, the lesions appear to contain air aggregation or, less likely, other sources of susceptibility contrast such as blood iron. This finding is particularly interesting as the post-sonication QSM data were acquired ten to fifteen minutes after sonications and may indicate persistence of generated air cavities over a longer time span. The chosen processing pipeline can produce QSM maps of the given data arrays within a few seconds on a normal workstation computer, so rapid calculations for monitoring are most likely feasible with a few optimizations.CONCLUSIONS:
Our findings indicate that QSM can assess generation of histotripsy lesions. Using a highly-accelerated double-echo gradient echo acquisition, e.g. with 3D EPI or Compressed SENSE, QSM may serve as a monitoring and feedback tool during histotripsy therapy.Acknowledgements
This work was supported by the German Federal Ministry of Education and Research (“MR-HIFU-Pancreas”, FKZ: 13GW0364D).References
1. Roberts, W. W. et al. Pulsed cavitational ultrasound: a noninvasive technology for controlled tissue ablation (histotripsy) in the rabbit kidney. J. Urol. 175, 734–738 (2006).
2. Khokhlova, T. D. et al. Controlled tissue emulsification produced by high intensity focused ultrasound shock waves and millisecond boiling. J. Acoust. Soc. Am. 130, 3498–3510 (2011).
3. Pahk, K. J. et al. Boiling Histotripsy-induced Partial Mechanical Ablation Modulates Tumour Microenvironment by Promoting Immunogenic Cell Death of Cancers. Sci. Rep. 9, 9050 (2019).
4. Khokhlova, V. A. et al. Histotripsy methods in mechanical disintegration of tissue: Towards clinical applications. Int. J. Hyperthermia 31, 145–162 (2015).
5. Ishihara, Y. et al. A precise and fast temperature mapping using water proton chemical shift. Magn. Reson. Med. 34, 814–823 (1995).
6. Wei, H. et al. Streaking artifact reduction for quantitative susceptibility mapping of sources with large dynamic range. NMR Biomed. 28, 1294–1303 (2015).
7. Li, W., Wu, B. & Liu, C. Quantitative susceptibility mapping of human brain reflects spatial variation in tissue composition. NeuroImage 55, 1645–1656 (2011).
8. STI Suite 3. (University of California, Berkeley).
Figures