4821
A mesh-based CNN for the evaluation of MR RF-induced heating of complex-shaped passive implants1Electrical and Computer Engineering, University of Houston, Houston, TX, United States, 2Stryker Corporation, Mahwah, NJ, United States, 3High Performance Computing for MRI Safety, LLC, Jasper, GA, United States
Synopsis
In this research, a convolutional neural network (CNN) model is developed to predict the RF-induced heating for several tibia plate systems. One thousand four hundred and sixteen device configurations were developed, and the peak 1g-average SAR values were extracted. A subset of the data was used as training set and simulation meshes were used as the input of the CNN model. Results showed a quick network convergence and high correlation. The network also had a low absolute and percentage error level. This demonstrates that one can potentially use CNN model to predict the RF-induced heating of plate systems.
Introduction
Magnetic Resonance Imaging (MRI) RF-induced heating inside patients with passive implantable medical devices (PIMDs) is one of the major safety concerns during an MR procedure. Since a typical PIMD system, such as plate systems, often has multiple components and can have various configurations, extensive electromagnetic simulations or measurements are often required to identify the worst-case heating configuration1.To reduce the required electromagnetic simulations, Artificial Neural Network (ANN) based method was used for the prediction of the peak specific absorption rate (SAR) for generic plate systems that can be described by a few sets of design parameters2-5. However, for complex systems that cannot be well-described by a few sets of parameters, the ANN based approach is not applicable. Since electromagnetic simulation results are directly correlated to numerical simulation meshes, this study attempts to use simulation meshes as the input of CNN to predict the RF-induced heating for implants with complex shapes and configurations.
In this efforts, four types of tibia plate were developed. EM simulations were conducted. The simulation meshes and the peak average SAR values were extracted as the input and output parameters for the CNN. Training and fitting of the network were implemented, and the error level and the correlation between prediction and simulation results were observed and discussed.
Method
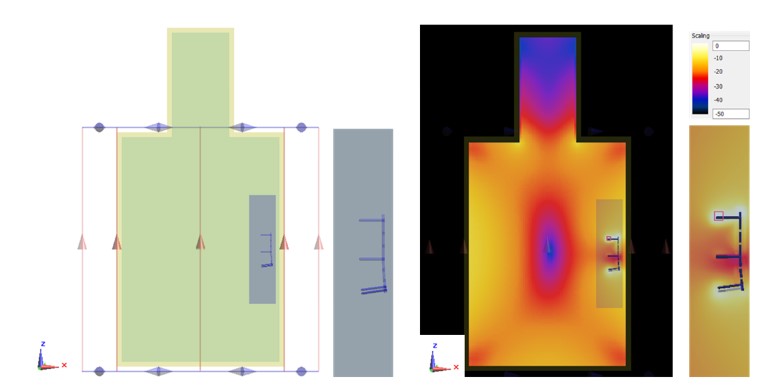
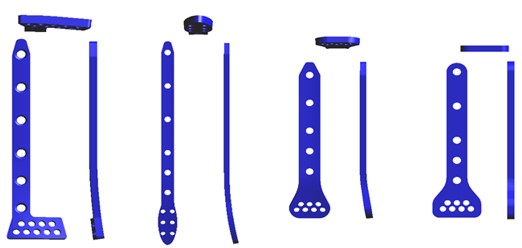
Electromagnetic simulations were conducted using SEMCAD 14.8.4 software package which is based on the finite-difference time-domain (FDTD) method. The numerical modeling and simulation followed the experimental procedure described in ASTM21821. Figure 1 shows a typical simulation setup, numerical meshes for the device, and the results of the electromagnetic simulations.The plate models used here were adapted from commercially available distal tibia plate systems for anterolateral, medial, anterior, and posterior treatments as shown in Figure 2. A total number of 1416 configurations were developed based on the variations of plate length, number of applicable screws, and the length of screw. After simulations, the 1g-averaged specific absorption rate (SAR) for each configuration was extracted. Meshes with sizes of 364*65*89 were extracted for the volume surrounding each configuration. The meshes were considered as a total of 65 channels of two-dimension (2-D) 364*89 mesh slice as the inputs for CNN.
The CNN used in this research was adapted from the CNN architecture AlexNet6. It composed of three 2-D convolution layers, three 2-D max pooling layers, one flatten layer, two fully connected layers, and one output layer. 70 % of the total data were randomly selected as the training set and the rest were used as testing dataset. Mean Absolute Percentage Error (MAPE) was chosen as the loss function of the CNN and Mean Absolute Error (MAE) was chosen as the metric to be evaluated through training along with the MAPE. Adam optimization was used as the optimizer of the network. The total training epoch was set to 100. The CNN sequential model was implemented in Python using Keras, which is a high-level deep learning API.
Results
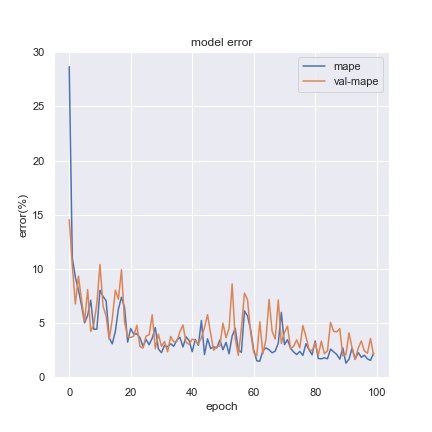
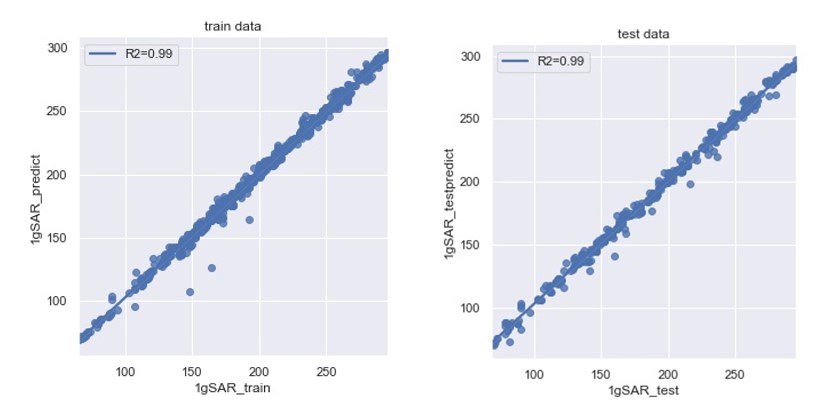
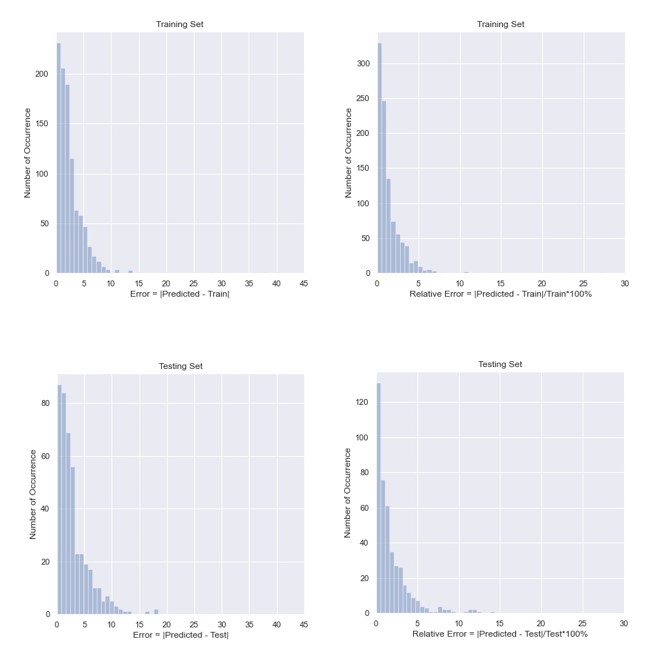
The total duration for CNN training was under 10 minutes. The averaged SAR values and the error metrics are evaluated. Averaged SAR value is 203.9 for training set and 196.8 for testing set. MAE is 2.52 for training set and 2.93 for testing set. MAPE is 1.46% for training set and 1.80% for testing set. The convergence of the MAPE is shown in Figure 3. The correlation between predicted and simulated peak SAR values for training and testing dataset are shown in Figure 4. R2 score which measures the correlation between the prediction and the simulation values is also calculated. Both training and testing dataset show an R2 score of 0.99. From the figure, majority of the data points are located along the x=y line, indicating good correlations between the predicted and simulated results. Histograms of the absolute error and percentage error distribution are shown in Figure 5. For the training set, differences between the predicted and calculated SAR values are less than 7.5 W/kg and the relative error are less than 7% for more than 90% of the data. For the testing set, the absolute errors are less than 12.5W/kg and relative errors are less than 10% for more than 90% of the data.Discussion
The CNN used in this research yields good convergence with acceptable training time. For the error distribution, although the maximum error reached to around 40W/kg, it is still acceptable as the maximum relative error is around 27%. With R2=0.99 between the simulation and predicted results, it demonstrates the effectiveness of the CNN for the prediction of PIMD RF-induced heating.Conclusion
In this research, a CNN model is used to perform the fast prediction of the 1g SAR value for tibia plate systems under MR RF exposure. Results show good training convergence and low error level, which proves the efficacy of CNN on predicting RF-induced heating of complex PIMDs.Disclaimer
The mention of commercial products, their sources, or their use in connection with material reported herein is not to be construed as either an actual or suggested endorsement of such products by the Department of Health and Human Services.Acknowledgements
No acknowledgement found.References
1. Assessment of Radiofrequency-Induced Heating in the Magnetic Resonance (MR) Environment for Multi-Configuration Passive Medical Devices, FDA guidance document for industry and FDA Staff, March 2021
2. Standard test method for measurement of radio frequency induced heating near passive implants during magnetic resonance imaging, ASTM standard F2182-19 West Conshohocken, 2019.
3. J. Zheng, Q. Lan, X. Zhang, et al. Prediction of MRI RF Exposure for Implantable Plate Devices Using Artificial Neural Network. 2020;62(3); 673-681
4. Q. Lan, J. Zheng, and J. Chen, Predicting MRI RF Exposure for Complex-shaped Medical Implants Using Artificial Neural Network. IEEE International Symposium on Antennas and Propagation and USNC-URSI Radio Science Meeting. 2019; 1861-1862
5. J. Zheng, R. Yang and J. Chen, Fast Prediction of MRI RF-induced Heating for Implantable Plate Devices Using Neural Network. IEEE International Symposium on Antennas and Propagation and USNC-URSI Radio Science Meeting. 2017; 1011-1012
6. Q. Lan, J. Zheng, J. Chang, et al. Predicting MRI RF Exposure for Passive Implantable Medical Devices Using a Mesh-based Convolutional Neural Network. IEEE International Symposium on Antennas and Propagation and USNC-URSI Radio Science Meeting. 2021, accepted for presentation.
Figures